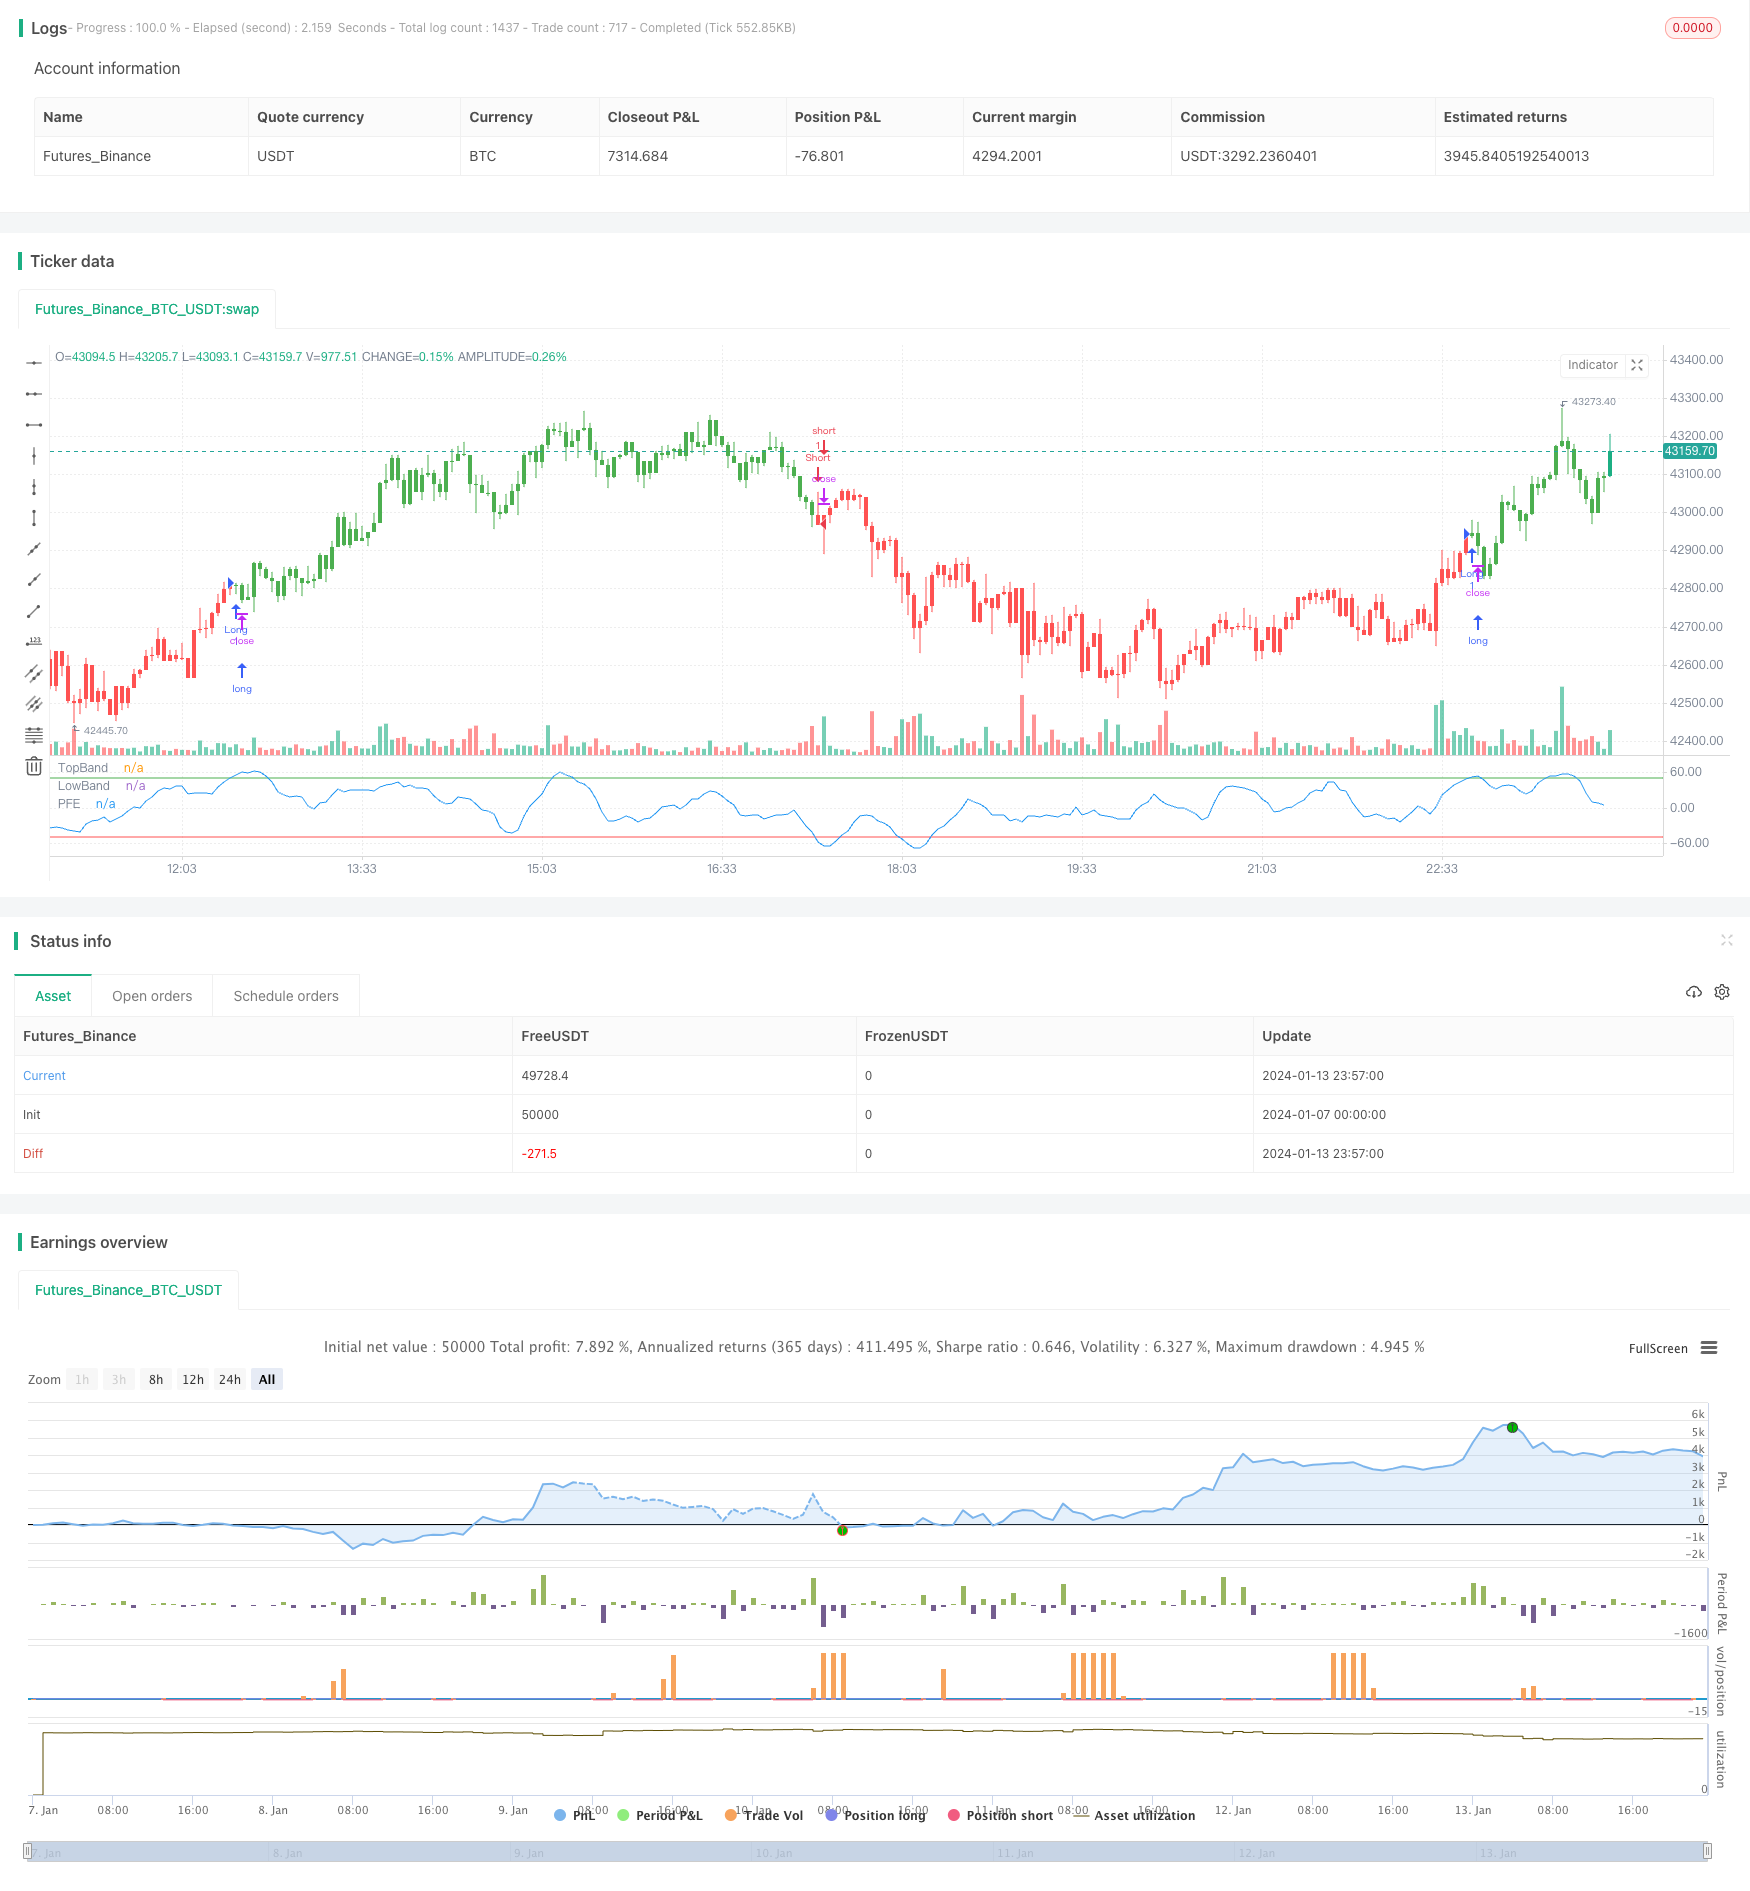
Polarized Fractal Efficiency (PFE) Trading Strategy
Author: ChaoZhang, Date: 2024-01-15 14:01:25Tags:

Overview
The Polarized Fractal Efficiency (PFE) trading strategy measures the efficiency of price movements by applying concepts from fractal geometry and chaos theory. The more linear and efficient the price movement, the shorter the distance prices travel between two points, and the higher the efficiency.
Strategy Logic
The core indicator of PFE trading strategy is Polarized Fractal Efficiency (PFE). It is calculated based on the following formula:
PFE = sqrt(pow(close - close[Length], 2) + 100)
Where Length is the lookback window, adjustable through input parameters. PFE essentially measures the “length” of price movement over the Length period, using Euclidean distance (straight-line distance) as an approximation.
To evaluate the efficiency of price movement, we need a benchmark for comparison. This benchmark is the length of the path connecting prices over Length period according to the actual sequence, called C2C (Close to Close), and is calculated as:
C2C = sum(sqrt(pow((close - close[1]), 2) + 1), Length)
Thus we can calculate fractal efficiency of price movement xFracEff:
xFracEff = iff(close - close[Length] > 0, round((PFE / C2C) * 100) , round(-(PFE / C2C) * 100))
Positive value when price rises and negative value when price falls. The larger the absolute number, the less efficient the movement.
To generate trading signals, we calculate the exponential moving average of xFracEff, called xEMA. Buy and sell bands are defined:
xEMA = ema(xFracEff, LengthEMA)

BuyBand = input(50)
SellBand = input(-50)
When xEMA crosses above BuyBand, it generates buy signal. When crossing below SellBand, it generates sell signal.
Advantage Analysis
The PFE trading strategy has the following advantages:
- Applies unique concepts from fractal geometry and chaos theory to measure price movement efficiency from a different angle
- Avoids some problems of conventional technical indicators like curve fitting
- Parameters can be adjusted to find suitable settings for different market environments
- Simple and clear trading rules, easy to implement
Risk Analysis
The PFE trading strategy also has the following risks:
- Difficult parameter optimization, prone to overfitting like all indicator strategies
- Unreliable signals during extreme market turbulence
- Need to cautiously handle extremes like price gaps
- Bear some time lag, may have missed best entry point when signal triggers
Optimization Directions
The PFE strategy can be optimized from the following aspects:
- Try different combinations of Length parameter to find optimal balance
- Optimize buy and sell bands to reduce erroneous trades
- Add stop loss to control single trade loss size
- Combine other indicators to improve signal quality
- Dynamically adjust parameters to adapt to changing market environments
Summary
The PFE trading strategy proposes a novel approach based on fractal geometry and chaos theory concepts to measure the efficiency of price movements. Compared to conventional technical indicators, this method has its unique advantages but also faces problems like time lag, parameter optimization, signal quality to some extent. With continuous testing and optimization, PFE strategy shows promise to become a reliable quantitative trading strategy choice.
/*backtest
start: 2024-01-07 00:00:00
end: 2024-01-14 00:00:00
period: 3m
basePeriod: 1m
exchanges: [{"eid":"Futures_Binance","currency":"BTC_USDT"}]
*/

//@version=2
////////////////////////////////////////////////////////////
//  Copyright by HPotter v1.0 29/09/2017
// The Polarized Fractal Efficiency (PFE) indicator measures the efficiency
// of price movements by drawing on concepts from fractal geometry and chaos
// theory. The more linear and efficient the price movement, the shorter the
// distance the prices must travel between two points and thus the more efficient
// the price movement.
//
// You can change long to short in the Input Settings
// WARNING:
// - For purpose educate only
// - This script to change bars colors.
////////////////////////////////////////////////////////////
strategy(title="PFE (Polarized Fractal Efficiency)", shorttitle="PFE (Polarized Fractal Efficiency)")
Length = input(9, minval=1)
LengthEMA = input(5, minval=1)
BuyBand = input(50, step = 0.1)
SellBand = input(-50, step = 0.1)
reverse = input(false, title="Trade reverse")
hline(BuyBand, color=green, linestyle=line, title = "TopBand")
hline(SellBand, color=red, linestyle=line, title = "LowBand")
PFE = sqrt(pow(close - close[Length], 2) + 100)
C2C = sum(sqrt(pow((close - close[1]), 2) + 1), Length)
xFracEff = iff(close - close[Length] > 0,  round((PFE / C2C) * 100) , round(-(PFE / C2C) * 100))
xEMA = ema(xFracEff, LengthEMA)
pos = iff(xEMA < SellBand, -1,
	   iff(xEMA > BuyBand, 1, nz(pos[1], 0)))
possig = iff(reverse and pos == 1, -1,
          iff(reverse and pos == -1, 1, pos))
if (possig == 1)
    strategy.entry("Long", strategy.long)
if (possig == -1)
    strategy.entry("Short", strategy.short)
barcolor(possig == -1 ? red: possig == 1 ? green : blue )
plot(xEMA, color=blue, title="PFE")
- FraMA and MA Crossover Trading Strategy Based on FRAMA Indicator
- Trend Following Strategy Based on SSL Baseline
- Bollinger Bands Trend Following Strategy
- Momentum Trend Following Trading Strategy
- Open Close Cross Moving Average Trend Following Strategy
- Adaptive Trend Following Strategy
- Multi Timeframe RSI Strategy
- Bollinger Bands and K-line Combined Strategy
- Aroon Oscillator Based Stock Trading Strategy
- EintSimple Pullback Strategy
- Eleven Moving Averages Crossover Strategy
- Dual Moving Average Reversal Trading Strategy
- RSI of MACD Reversal Strategy
- Lunar Phase Based Bitcoin Trading Strategy
- Volatility Filtered Market Timing Strategy
- Trend Following Channel Breakout Strategy with Moving Average and Trailing Stop
- Quantitative Trading Dual Indicator Strategy
- Bidirectional Moving Average Reversion Trading Strategy
- RSI Bullish and Bearish Divergence Trading Strategy
- Box Breakout Based Silver Bullet Strategy