Momentum Trend Following Trading Strategy
Author: ChaoZhang, Date: 2024-01-15 14:27:09Tags:

Overview
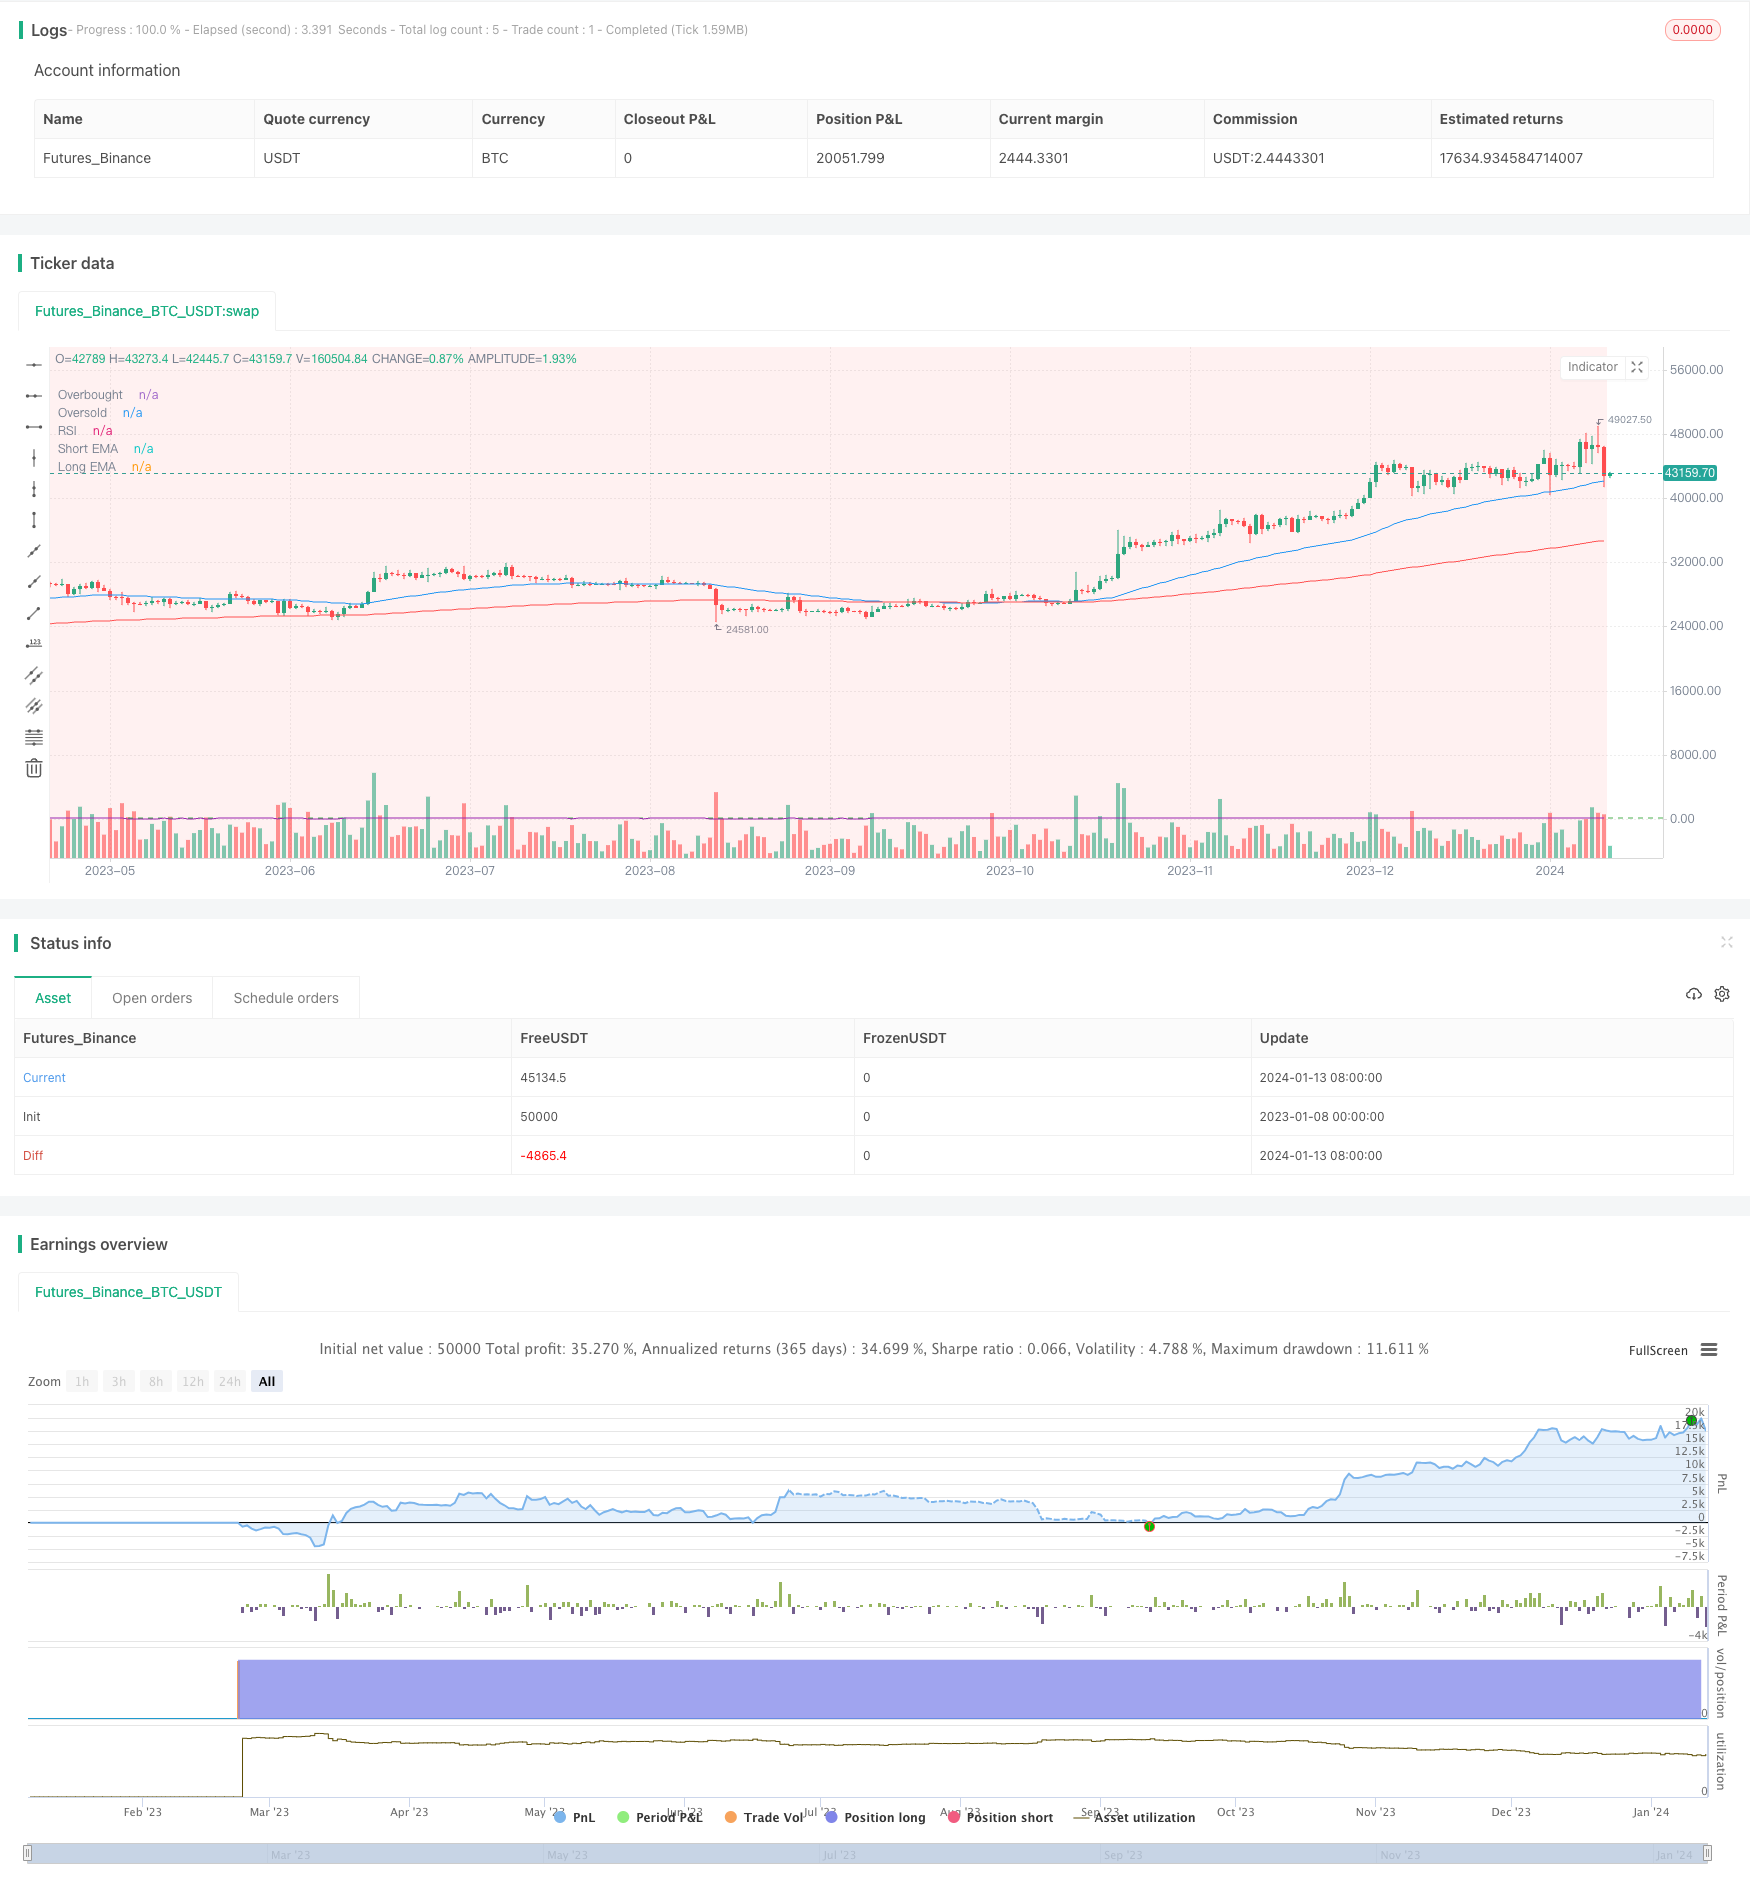
The momentum trend following trading strategy is a quantitative trading strategy that combines trend following with overbought-oversold indicators. The strategy uses EMA lines to determine price trend direction and combines RSI indicator to judge overbought-oversold levels. It enters trades following confirmed trend direction. Meanwhile, it utilizes demand and supply zones to determine more precise entry points.
Strategy Logic
The core of this strategy is based on EMA lines and RSI indicator to determine price trend and overbought-oversold levels. Specifically, it uses crossover between fast EMA 50-day line and slow EMA 200-day line to determine price trend direction. Golden cross is bullish signal while death cross is bearish signal. It goes long when price breaks above fast EMA line after golden cross and goes short when price breaks below fast EMA line after death cross. In the meantime, it uses RSI indicator to filter false breakouts. RSI above 55 is considered overbought zone while below 45 oversold zone. Trades are only triggered with trend signal when not in overbought-oversold situation. Finally, it utilizes demand and supply zones to further filter entry price. It buys in demand zone and sells in supply zone to ensure better entry price.
Advantage Analysis
The strategy combines trend following and overbought-oversold indicators to effectively filter false breakout noise and ensure signal quality. Using demand and supply zones to determine entries also makes entry price more precise. In summary, advantages of this strategy include:
-
Using EMA lines to determine major trend avoids whipsaws in ranging markets.
-
RSI filters false breakout in overbought-oversold situations.
-
Demand and supply zones offer precise entry timing.
-
Combining multiple indicators makes strategy more robust.
Risk Analysis
Despite advantages, the strategy also has some risks to note. Major risks include:
-
Potential missed initial entries during strong trends when EMA and RSI lag. Can optimize by shortening parameter cycle.
-
Potential whipsaws in ranging market when stops are triggered from price oscillation around EMA lines. Can loosen stop distance.
-
Subjectivity in determining demand and supply zones. Needs incorporation of more factors like volume changes.
Optimization Directions
Main optimization directions for this strategy:
-
Dynamically adjust EMA parameters to faster adapt to changing market conditions.
-
Optimize RSI parameters for better overbought-oversold representation.
-
Use more indicators to determine demand and supply zones objectively.
-
Add stop loss and take profit for risk control.
-
Test robustness across different products and assess adaptability.
Summary
The momentum trend following strategy comprehensively considers trend, overbought-oversold levels, demand and supply in ensuring high quality signal filtering and entries. It effectively controls key risks in trend trading and demonstrates organic incorporation of multiple technical indicators and concepts. Future improvements can be made in areas like parameter optimization, stop loss mechanism and adaptability to enhance strategy performance.
/*backtest
start: 2023-01-08 00:00:00
end: 2024-01-14 00:00:00
period: 1d
basePeriod: 1h
exchanges: [{"eid":"Futures_Binance","currency":"BTC_USDT"}]
*/

//@version=4
strategy("Trading Trend Following", overlay=true)

// Define EMA parameters
emaLengthShort = input(50, title="Short EaMA Length")
emaLengthLong = input(200, title="Long EMA Length")
ema50 = ema(close, emaLengthShort)
ema200 = ema(close, emaLengthLong)

// Calculate RSI
rsiLength = input(14, title="RSI Length")
rsiValue = rsi(close, rsiLength)

// Define Demand and Supply zones
demandZone = input(true, title="Demand Zone")
supplyZone = input(true, title="Supply Zone")

// Define Buy and Sell conditions
buyCondition = crossover(ema50, ema200) and close > ema50 and rsiValue > 55
sellCondition = crossunder(ema50, ema200) and close < ema50 and rsiValue < 45

// Entry point buy when the price is closed above Demand and EMA gives a buy signal
buyEntryCondition = close > ema50 and demandZone
strategy.entry("Buy", strategy.long, when=buyCondition and buyEntryCondition)

// Entry point sell when the price is closed below Supply and EMA gives a sell signal
sellEntryCondition = close < ema50 and supplyZone
strategy.entry("Sell", strategy.short, when=sellCondition and sellEntryCondition)

// Plot EMAs for visualization
plot(ema50, color=color.blue, title="Short EMA")
plot(ema200, color=color.red, title="Long EMA")

// Plot RSI for visualization
hline(55, "Overbought", color=color.red)
hline(45, "Oversold", color=color.green)
plot(rsiValue, color=color.purple, title="RSI")

// Plot Demand and Supply zones
bgcolor(demandZone ? color.new(color.green, 90) : na)
bgcolor(supplyZone ? color.new(color.red, 90) : na)
- Dual Confirmation Quant Trading Strategy
- Confirmed Divergence Strategy
- Bollinger Wave Strategy
- Myo_LS_D Quantitative Strategy
- Multiplicative Moving Average Dual-direction Trading Strategy
- Donchian Channels Long Term Trend Following Strategy
- IBS and Weekly High Based SP500 Futures Trading Strategy
- FraMA and MA Crossover Trading Strategy Based on FRAMA Indicator
- Trend Following Strategy Based on SSL Baseline
- Bollinger Bands Trend Following Strategy
- Open Close Cross Moving Average Trend Following Strategy
- Adaptive Trend Following Strategy
- Multi Timeframe RSI Strategy
- Bollinger Bands and K-line Combined Strategy
- Aroon Oscillator Based Stock Trading Strategy
- EintSimple Pullback Strategy
- Polarized Fractal Efficiency (PFE) Trading Strategy
- Eleven Moving Averages Crossover Strategy
- Dual Moving Average Reversal Trading Strategy
- RSI of MACD Reversal Strategy