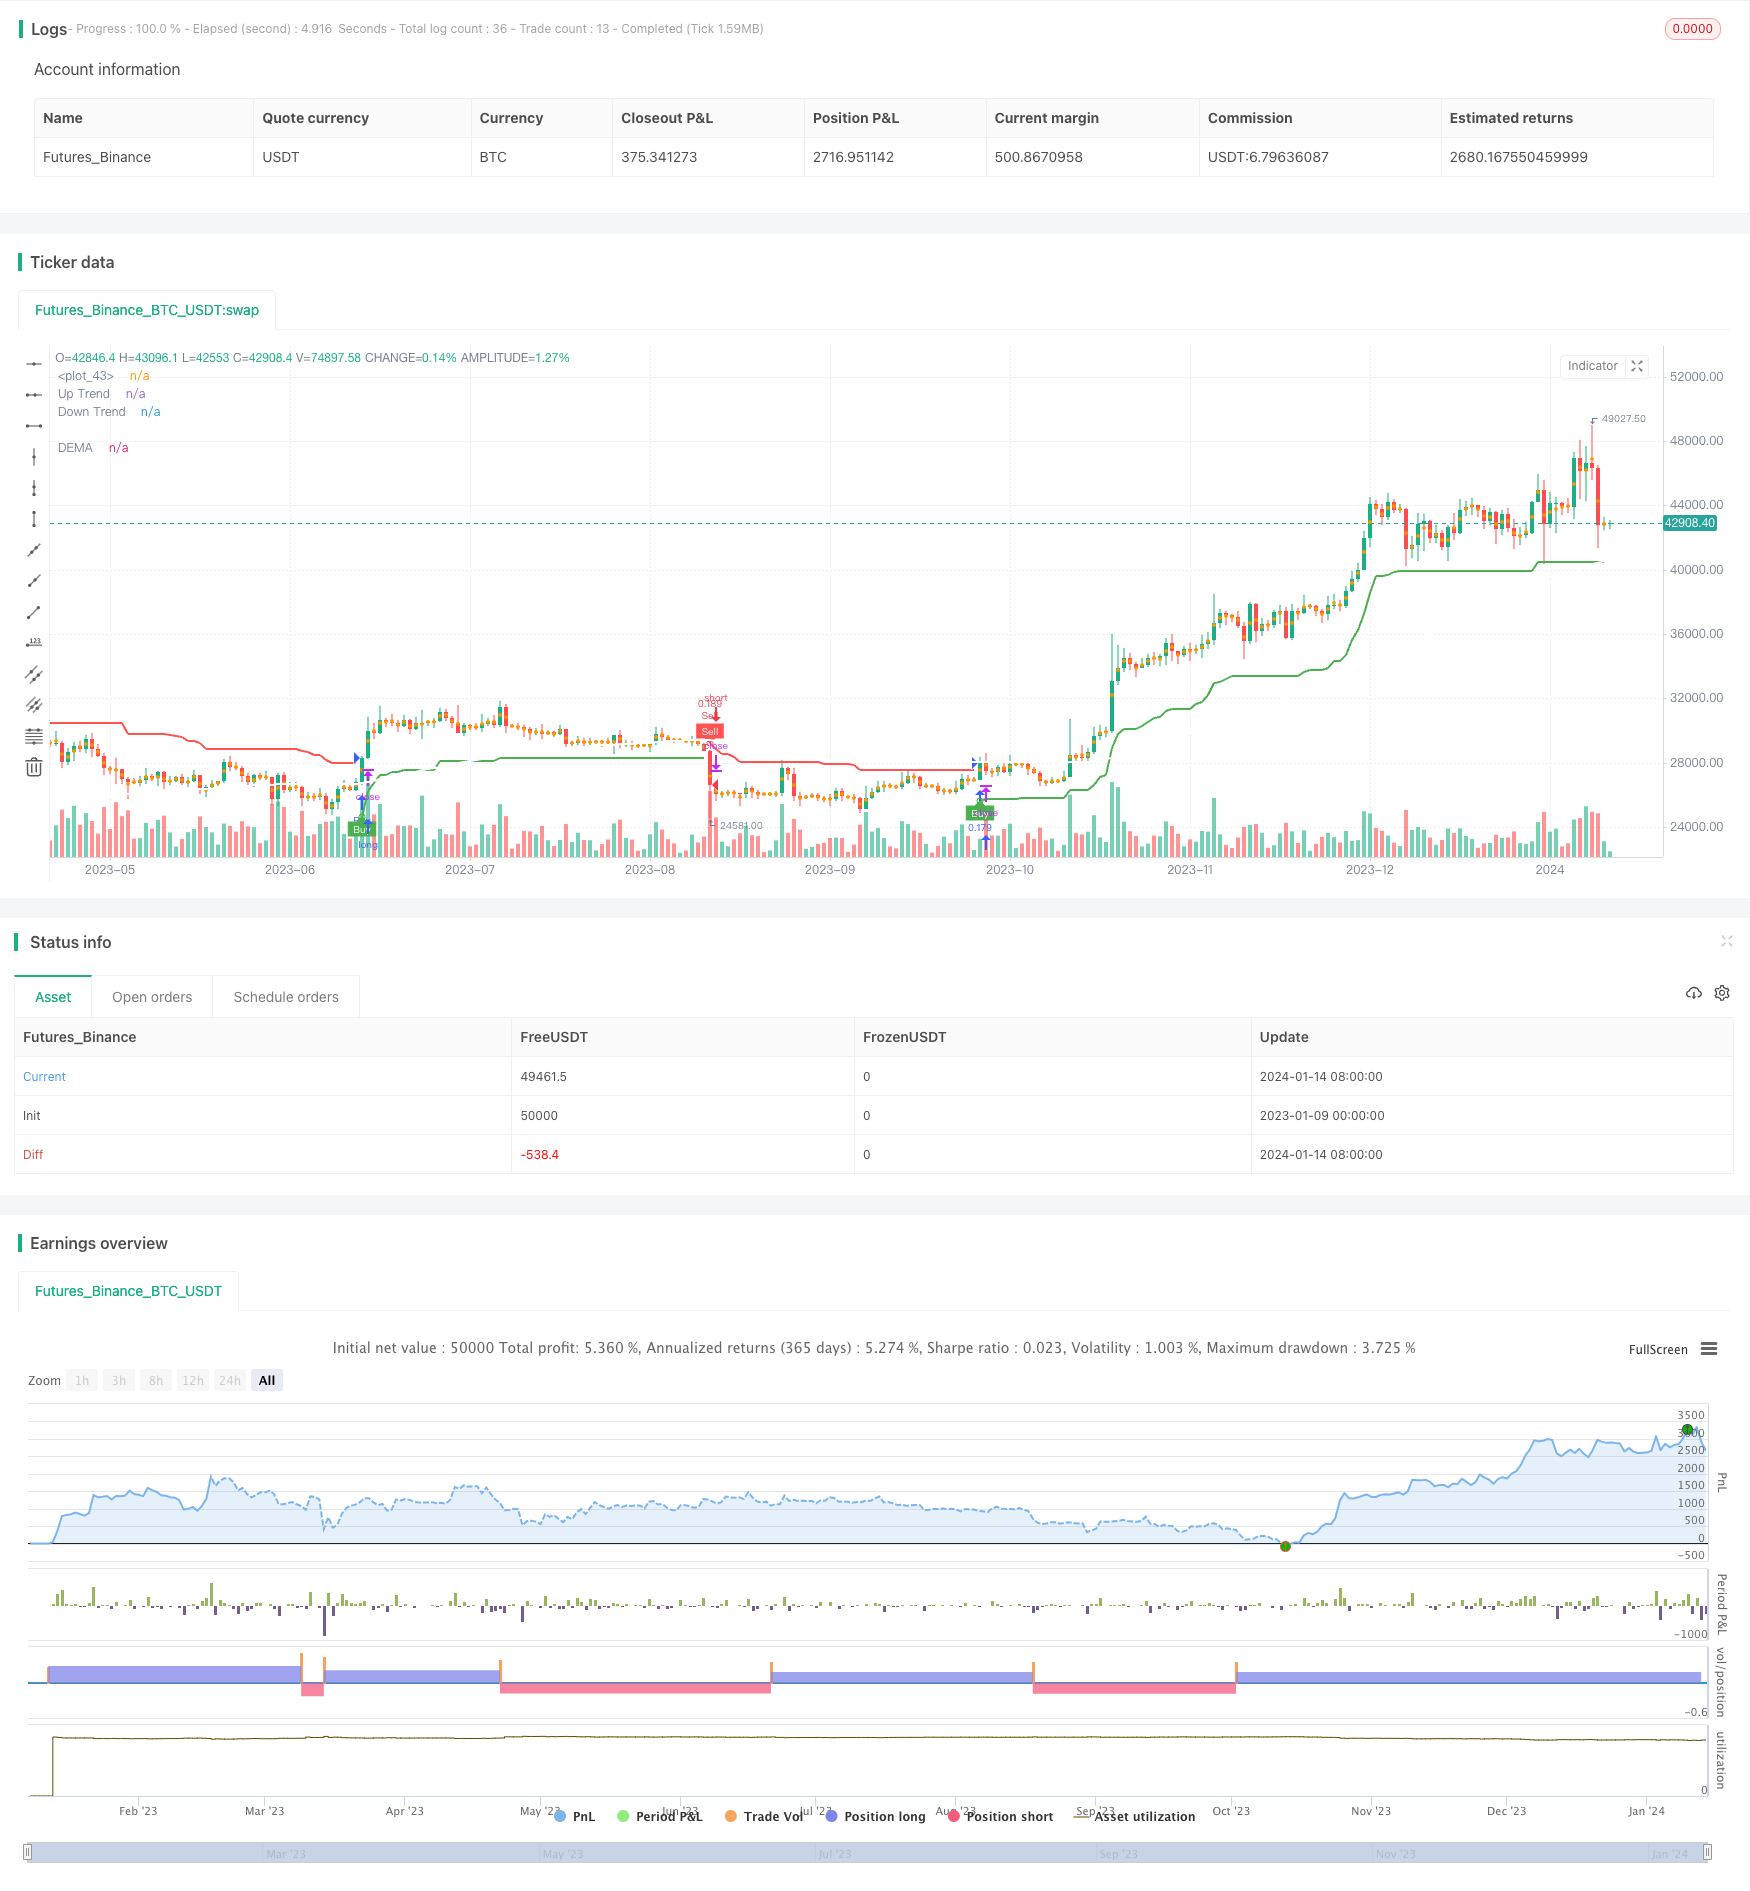
Dual Trend Tracking Strategy
Author: ChaoZhang, Date: 2024-01-16 15:03:55Tags:

Overview
The Dual Trend Tracking Strategy is a composite strategy combining the Supertrend indicator, Double Exponential Moving Average (DEMA) and Bollinger Bands. It aims to timely capture buy and sell signals when trends reverse by leveraging the advantages of multiple technical indicators.
Strategy Logic
The strategy consists of three main parts:
-
Supertrend Indicator: Calculates the up breakout line and down breakout line to determine the current trend direction. It generates buy signals when the price breaks out upwards from the supertrend line, and sell signals when the price breaks out downwards.
-
Double Exponential Moving Average (DEMA): A trend tracking indicator that combines the features of simple moving average and exponential moving average, which can respond to price changes faster. The strategy sets a 200-day DEMA to judge the long-term trend direction.
-
Bollinger Bands: Represents the fluctuation range of prices. Abnormal contraction or expansion of Bollinger Bands signals potential trend reversals.
When the Supertrend indicator and DEMA both issue buy/sell signals, the strategy enters the corresponding position. In addition, anomalies of Bollinger Bands can serve as auxiliary judgment signals.
Advantages
-
Combination of multiple indicators reduces false signals.
-
Supertrend indicator is insensitive to minor price changes and only generates signals at trend turning points, avoiding excessive frequency of trading.
-
DEMA smooth curve accurately and reliably judges long-term trends.
-
Bollinger Bands assist in determining trend reversal points.
Risks and Solutions
-
Overly sensitive supertrend parameters may generate more noise. Optimizing the ATR period and multiplier parameters can improve it.
-
Long DEMA period results in poor trend following capability. Can test shortened periods like 100-day.
-
Inconsistent signals when combining judgment of multiple indicators. In this case, the supertrend indicator can be considered the primary signal.
Optimization Directions
-
Test different ATR periods and multiplier parameters to find the optimal combination for the supertrend indicator.
-
Optimize the DEMA period parameter.
-
Add other auxiliary indicators like KDJ, MACD etc.
-
Introduce stop loss strategies.
Summary
The Dual Trend Tracking Strategy combines the strengths of Supertrend, DEMA and Bollinger Bands by using multiple indicators, improving signal quality while capturing trends. Further performance improvements can be expected through parameter optimization and adding stop loss mechanisms.
/*backtest
start: 2023-01-09 00:00:00
end: 2024-01-15 00:00:00
period: 1d
basePeriod: 1h
exchanges: [{"eid":"Futures_Binance","currency":"BTC_USDT"}]
*/

//@version=4
strategy("Supertrend + DEMA + Bollinger Bands", overlay=true, default_qty_type=strategy.percent_of_equity, default_qty_value=10, precision=2)

// Input parameters for Supertrend
atrLength = input(title="ATR Period", type=input.integer, defval=12)
src = input(hl2, title="Source")
multiplier = input(title="ATR Multiplier", type=input.float, step=0.1, defval=3.0)
changeATR = input(title="Change ATR Calculation Method?", type=input.bool, defval=true)
showSupertrend = input(title="Show Supertrend Indicator?", type=input.bool, defval=true)

// Input parameters for DEMA
demaLength = input(200, title="DEMA Period")
showDEMA = input(title="Show DEMA Indicator?", type=input.bool, defval=true)

// Calculate ATR for Supertrend
atr2 = sma(tr, atrLength)
atr = changeATR ? atr(atrLength) : atr2

// Calculate Supertrend
up = src - (multiplier * atr)
up1 = nz(up[1], up)
up := close[1] > up1 ? max(up, up1) : up

dn = src + (multiplier * atr)
dn1 = nz(dn[1], dn)
dn := close[1] < dn1 ? min(dn, dn1) : dn

trend = 1
trend := nz(trend[1], trend)
trend := trend == -1 and close > dn1 ? 1 : trend == 1 and close < up1 ? -1 : trend

// Plot Supertrend
upPlot = plot(showSupertrend ? (trend == 1 ? up : na) : na, title="Up Trend", style=plot.style_linebr, linewidth=2, color=color.new(color.green, 0))
buySignal = trend == 1 and trend[1] == -1
plotshape(buySignal ? up : na, title="UpTrend Begins", location=location.absolute, style=shape.circle, size=size.tiny, color=color.new(color.green, 0))
plotshape(buySignal ? up : na, title="Buy", text="Buy", location=location.absolute, style=shape.labelup, size=size.tiny, color=color.new(color.green, 0), textcolor=color.new(color.white, 0))

dnPlot = plot(showSupertrend ? (trend == 1 ? na : dn) : na, title="Down Trend", style=plot.style_linebr, linewidth=2, color=color.new(color.red, 0))
sellSignal = trend == -1 and trend[1] == 1
plotshape(sellSignal ? dn : na, title="DownTrend Begins", location=location.absolute, style=shape.circle, size=size.tiny, color=color.new(color.red, 0))
plotshape(sellSignal ? dn : na, title="Sell", text="Sell", location=location.absolute, style=shape.labeldown, size=size.tiny, color=color.new(color.red, 0), textcolor=color.new(color.white, 0))

mPlot = plot(ohlc4, title="", style=plot.style_circles, linewidth=0)

longFillColor = (trend == 1 ? color.new(color.green, 80) : color.new(color.white, 0))
shortFillColor = (trend == -1 ? color.new(color.red, 80) : color.new(color.white, 0))

fill(mPlot, upPlot, title="UpTrend Highlighter", color=longFillColor)
fill(mPlot, dnPlot, title="DownTrend Highlighter", color=shortFillColor)

// Alert conditions
alertcondition(buySignal, title="Custom Supertrend Buy", message="Custom Supertrend Buy!")
alertcondition(sellSignal, title="Custom Supertrend Sell", message="Custom Supertrend Sell!")

// Calculate DEMA
ema1 = ema(close, demaLength)
dema = 2 * ema1 - ema(ema1, demaLength)

// Plot DEMA with white color
plot(showDEMA ? dema : na, color=color.new(color.white, 0), title="DEMA", linewidth=2)

// Add push notification on mobile if buy and sell occurred
if (buySignal)
    strategy.entry("Buy", strategy.long)
    strategy.exit("Sell")
    alert("Buy Signal - Supertrend")

if (sellSignal)
    strategy.entry("Sell", strategy.short)
    strategy.exit("Cover")
    alert("Sell Signal - Supertrend")
- ADX Momentum Trend Strategy
- Combination Strategy of 123 Reversal and Pivot Point
- Moving Average and Stochastic RSI Combination Trading Strategy
- Dynamic Trend Tracking Reversal Strategy
- Daily DCA Strategy with Touching EMAs
- Trend Strength Confirm Bars Strategy
- Super Trend Dual Moving Average Strategy
- WaveTrend and DER Based Swing Trading Strategy
- Hull Fisher Adaptive Intelligent Multi-factor Strategy
- Dynamic Position Sizing Strategy Based on Equity Curve
- Adaptive Intelligent Grid Trading Strategy
- Trend Tracking Reversal Strategy
- Price Channel Breakout Strategy
- SAR Alternating Timeframe Trading Strategy
- EMA/MA Crossover Options Trading Strategy
- RMI Trend Sync Strategy
- Multi Timeframe MACD Moving Average Trading Strategy
- ADX Dynamic Trend Strategy
- Trend Following Strategy Based on Hull Moving Average and True Range
- Dual Confirmation Quant Trading Strategy