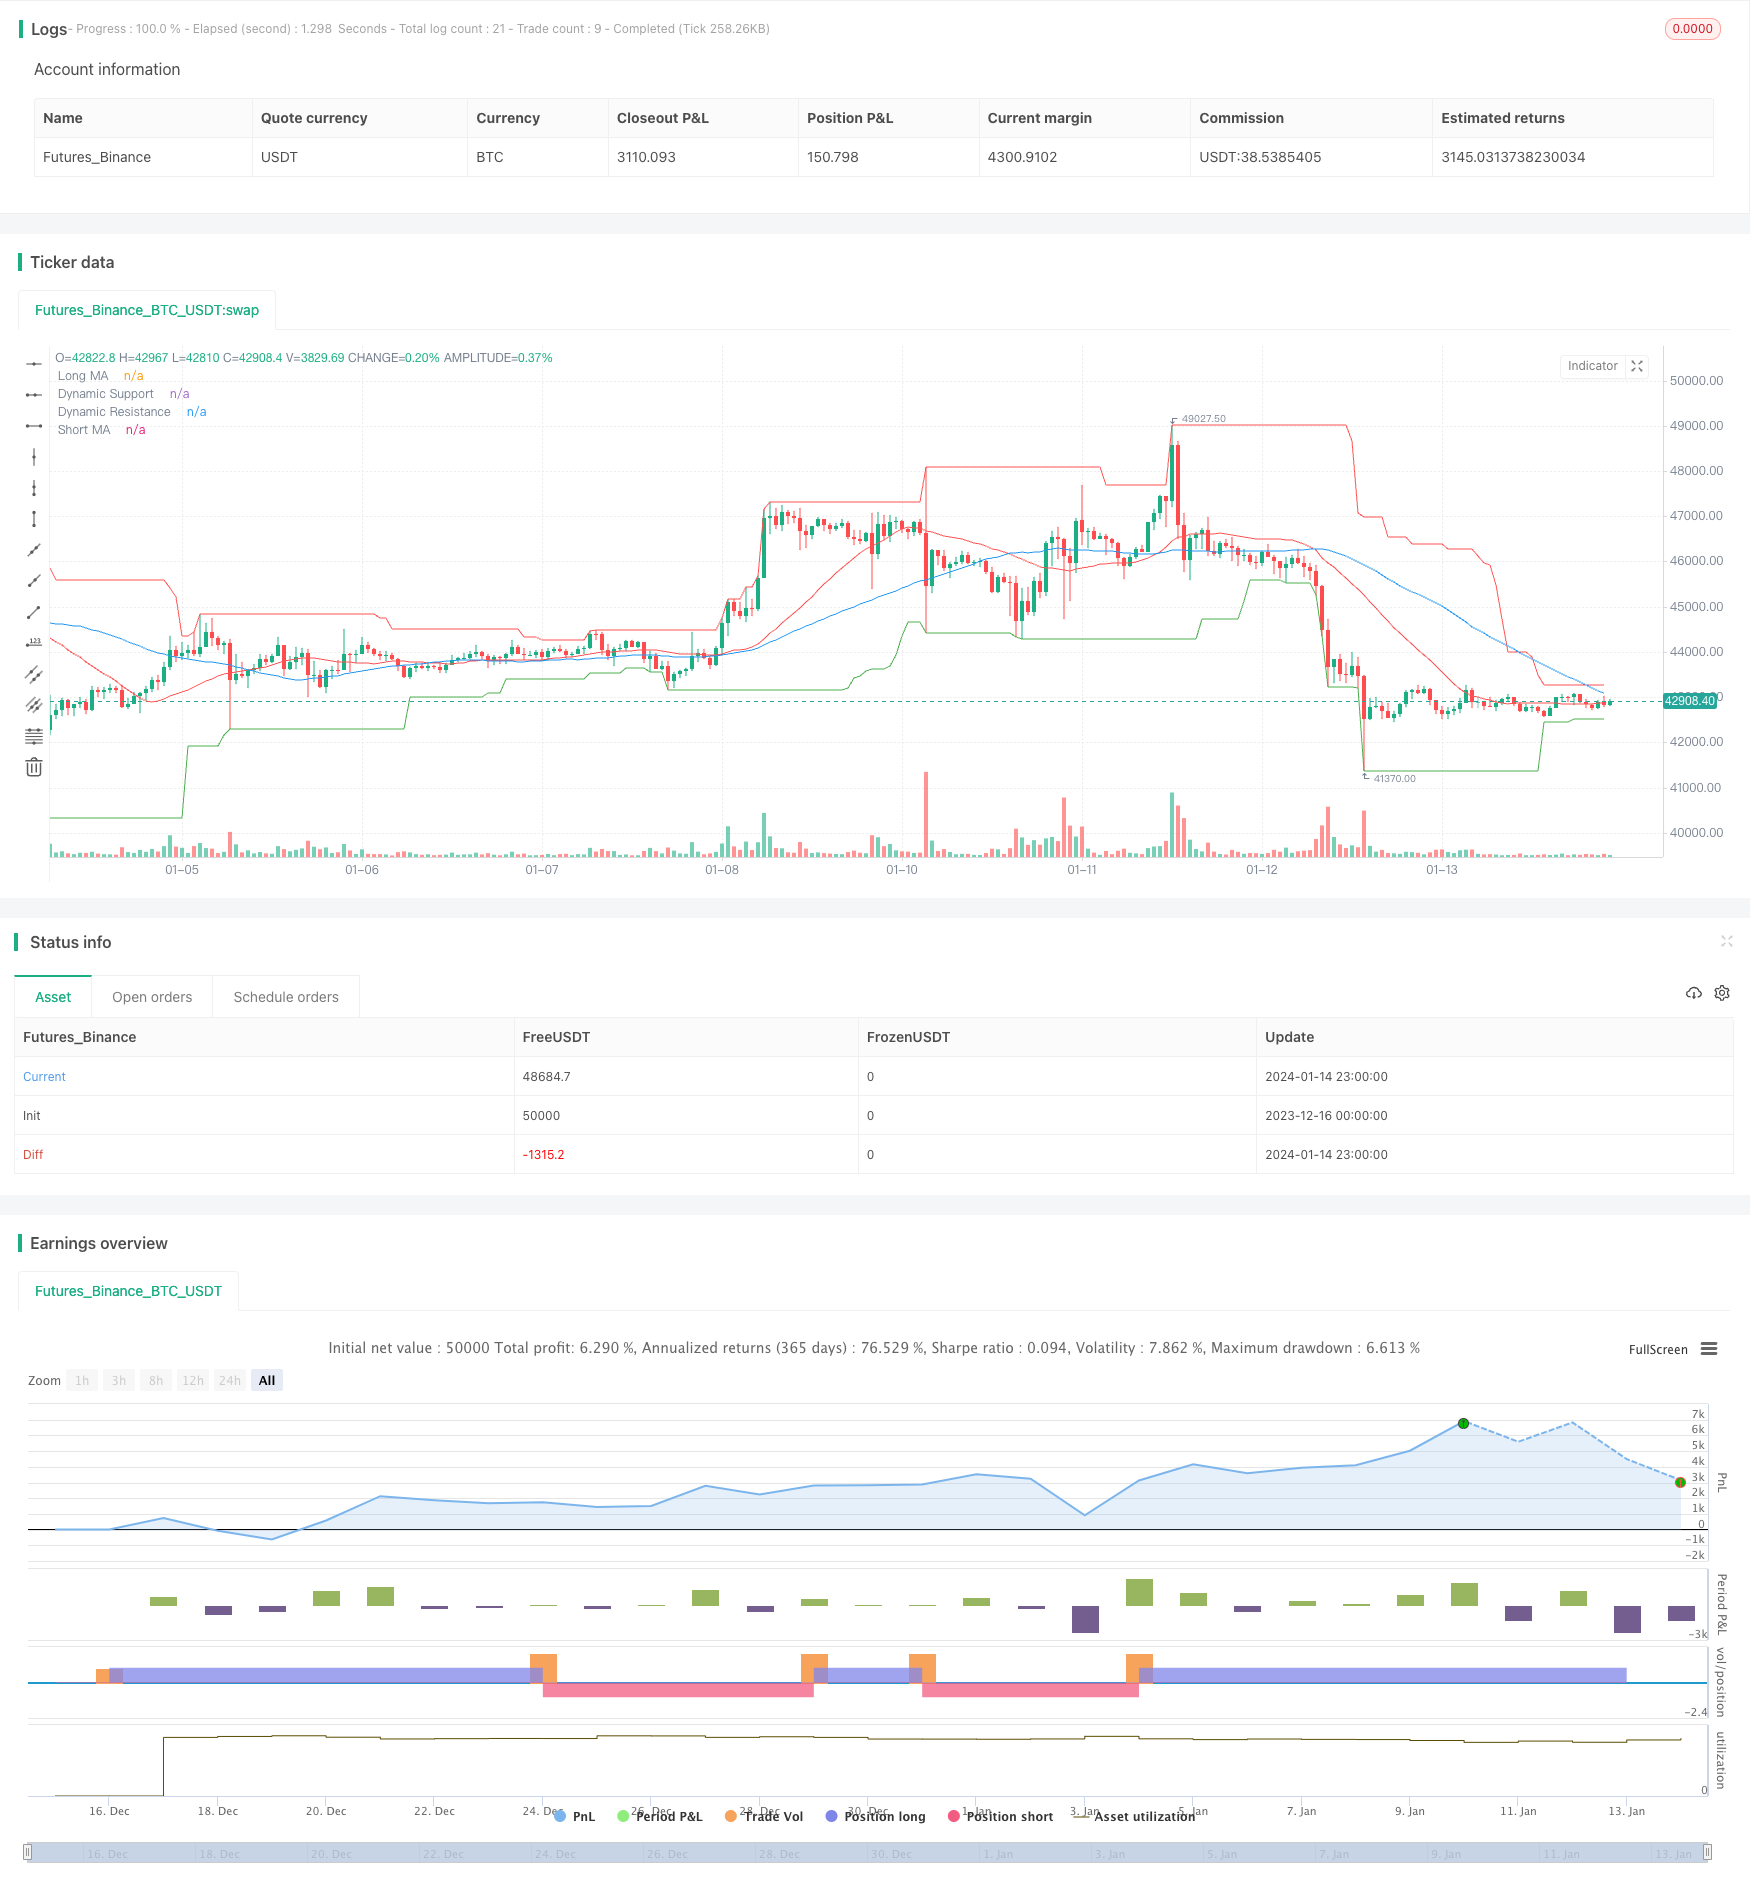
Trend Following Strategy Based on Price Action and Volume
Author: ChaoZhang, Date: 2024-01-16 17:34:04Tags:

Overview
This strategy mainly uses a combination of simple moving average and trading volume to determine the direction of market trend. It tries to identify appropriate entry and exit points when the market trend is relatively strong. It belongs to the category of trend following quantitative strategies.
Strategy Logic
The strategy adopts two simple moving averages of different periods to determine the market trend. The shorter period moving average can capture price change trend more quickly, while the longer period one helps filter some noise. A buy signal is generated when the shorter period MA crosses over the longer period one, indicating the start of an upward trend. A sell signal is generated when the shorter MA crosses below the longer MA, indicating the start of a downward trend.
In addition, this strategy also incorporates trading volume indicator to confirm the trend signals. Valid buy and sell signals are only triggered when volume is higher than a certain period average, thus filtering some potential false breakouts.
When entering positions, the strategy also considers the dynamic support/resistance levels to select appropriate entry points. It only buys when price is above support level and only sells when price is below resistance level. This helps mitigate the risk of whipsaws in range-bound markets to some extent.
Advantages
The strategy has the following outstanding advantages:
-
The signal rules are simple and clear, easy to understand and tune parameters, suitable for quant trading beginners.
-
It combines price action and volume analysis to better determine market trend and filter false breakouts.
-
It uses dynamic support/resistance levels to select favorable entry timing to alleviate the risk of being whipsawed.
-
It has abundant backtest data and the parameters have gone through multiple optimization, leading to relatively stable live performance.
Risks
The strategy also has some potential risks, mainly in the following aspects:
-
As a trend following strategy, it can suffer consistent losses during range-bound markets.
-
Simple moving average itself responds slowly to price changes, unable to capture fast reversals in a timely manner.
-
There can be some lag in determining the dynamic support/resistance levels, unable to completely avoid false breakout risks.
-
Optimization carries the risk of overfitting. Live performance may deviate from backtest results to some extent.
The above risks could be alleviated by:
- Improving entry/exit rules combining trend and reversal indicators.
- Continuously optimizing parameters via machine learning to make the strategy more robust.
- Adding stop loss to control single trade loss amount.
Optimization Directions
There is still large room for improving this strategy:
-
Try different types of moving averages, e.g. exponential MA, KAMA.
-
Conduct multi-dimensional analysis of volume, e.g. climactic volume, shrinkage.
-
Enable automatic parameter tuning/updating using machine learning.
-
Add reversal indicators to cut loss and reverse position timely in ranging markets.
-
Incorporate fundamental data to determine the fair value of individual stocks.
-
Design benchmark-specific parameter sets and backtest workflows.
Conclusion
In summary, this is a typical trend following strategy template with some general applicability. It synthesizes price action, volume and other dimensions to filter noise effectively. But as a trend following strategy, it still carries systematic risks and needs continuous improvements and optimizations before it can be reliably traded live.
/*backtest
start: 2023-12-16 00:00:00
end: 2024-01-15 00:00:00
period: 1h
basePeriod: 15m
exchanges: [{"eid":"Futures_Binance","currency":"BTC_USDT"}]
*/

//@version=4
strategy("PVSRA Strategy", overlay=true)

// Price Action
shortMaPeriod = input(50, "Short MA Period")
longMaPeriod = input(25, "Long MA Period")
shortMa = sma(close, shortMaPeriod)  // Simple Moving Average for short period
longMa = sma(close, longMaPeriod)    // Simple Moving Average for long period

// Volume Analysis
volMaPeriod = input(25, "Volume MA Period")
volMa = sma(volume, volMaPeriod)     // Simple Moving Average for volume

// Support and Resistance
support = lowest(low, 30)
resistance = highest(high, 30)

// Entry Conditions
longCondition = crossover(shortMa, longMa) and (volume > volMa) and (close > support)
shortCondition = crossunder(shortMa, longMa) and (volume > volMa) and (close < resistance)

// Plotting
plot(shortMa, color=color.blue, title="Short MA")
plot(longMa, color=color.red, title="Long MA")
plot(support, color=color.green, title="Dynamic Support")
plot(resistance, color=color.red, title="Dynamic Resistance")

// Entering and Exiting Positions
if (longCondition)
    strategy.entry("Long", strategy.long)
if (shortCondition)
    strategy.entry("Short", strategy.short)
- MA Turning Point Long and Short Strategy
- RSI Target and Stop Loss Tracking Strategy
- RSI Indicator Based Short-term Trading Strategy
- Moving Average and Super Trend Tracking Stop Loss Strategy
- Linear Regression Channel Strategy
- Combination Trading Strategy Based on Dual EMA and Bandpass Filter
- Trend Tracking Trailing Stop Strategy
- Key Reversal Backtest Strategy
- Triangular Moving Average Crossover Trading Strategy
- Quantitative Trading Strategy Based on Moving Average
- Ichimoku Kinko Hyo Breakout Strategy
- ADX Momentum Trend Strategy
- Combination Strategy of 123 Reversal and Pivot Point
- Moving Average and Stochastic RSI Combination Trading Strategy
- Dynamic Trend Tracking Reversal Strategy
- Daily DCA Strategy with Touching EMAs
- Trend Strength Confirm Bars Strategy
- Super Trend Dual Moving Average Strategy
- WaveTrend and DER Based Swing Trading Strategy
- Hull Fisher Adaptive Intelligent Multi-factor Strategy