Overview
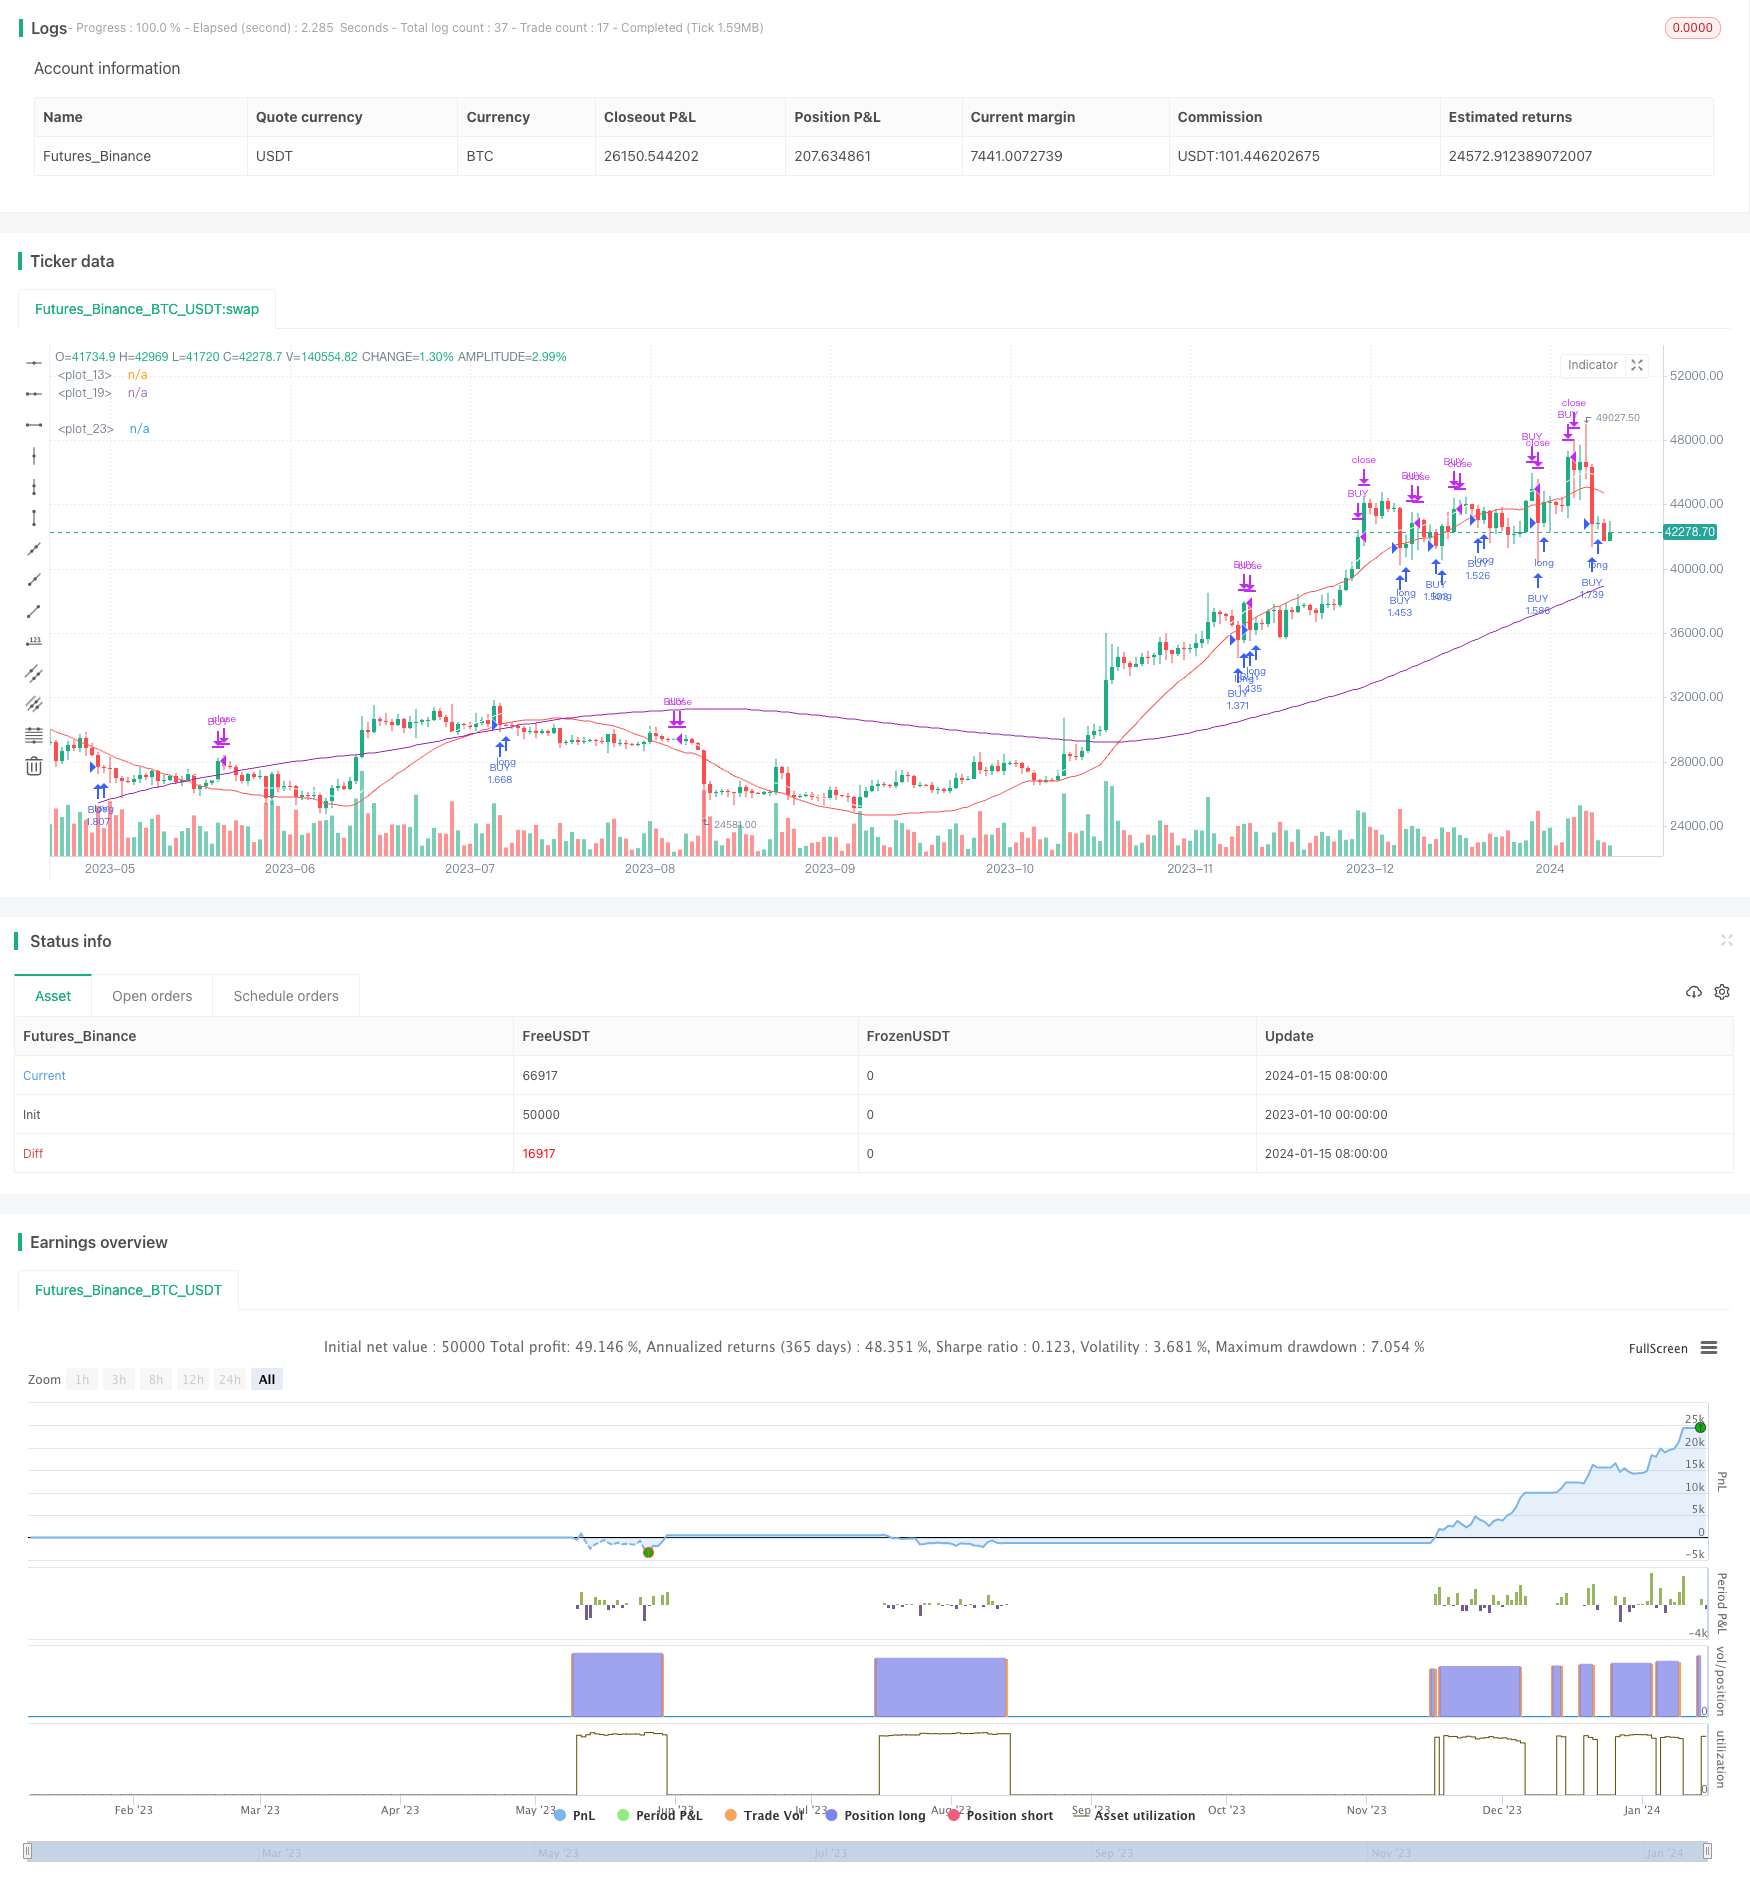
The Linear Regression Channel strategy is a short-term trading strategy based on linear regression analysis and moving average indicators. The strategy combines linear regression channel and Hull moving average to identify trend direction and find relatively low-risk entry points.
Strategy Logic
The Linear Regression Channel strategy mainly relies on two indicators:
Linear Regression Channel: The channel range calculated by linear regression analysis. The strategy sets a 55-day linear regression line to represent the long-term trend of prices. At the same time, it calculates the upper limit of the channel, representing the higher temperature area of prices.
Hull Moving Average: A moving average-like trend tracking indicator with a length of 400 days is used to determine the overall trend and direction of prices.
The specific trading logic is:
When the price is below the upper limit of the channel and below the 400-day Hull moving average, go long; when the price rises back above the linear regression midpoint, close the position to take profits.
This allows you to buy lows during consolidations and cash out for a profit when prices re-enter the uptrend channel.
Advantage Analysis
This strategy has the following advantages:
The linear regression channel can judge price heat and long-term trend direction more accurately, avoiding blind entries in choppy markets.
The Hull moving average filters out short-term market noise, making entry timing clearer.
The strategy has a relatively low frequency of operations and a smaller risk of drawdowns. It won’t chase tops and hit bottoms in volatile markets.
Profit points are clear, and decent returns can often be captured in medium and short-term trends.
Risk Analysis
The Linear Regression Channel strategy also poses some risks:
In a bull market, the linear regression channel may flatten or decline slightly, missing buying opportunities. This can be optimized by properly adjusting parameters.
In the event of a major reversal caused by an unexpected event, the stop loss may be hit, incurring a large loss. The ratio of stop loss can be set to control single transaction loss.
If the pullback goes too deep and breaks the Hull MA line, it may fail to make a profit on the exit. Hull MA parameters or stop loss can be adjusted.
Trading frequency may be too low. Shorten linear regression cycle to increase trade frequency.
Optimization
The Linear Regression Channel strategy can be optimized in the following aspects:
Dynamically adjust linear regression channel parameters to make the channel closer to actual price fluctuations.
Optimize Hull MA parameters to better determine trend reversal points.
Set trailing stop loss points within the channel to effectively control single loss risk.
Add volatility indicators to avoid opening positions in volatile markets.
Combine trading volume indicators to determine true breakouts.
Summary
Overall, the Linear Regression Channel strategy is a relatively robust trend-following strategy. It avoids market noise and enters the right direction when trends start. By optimizing parameters and combining indicators, trading risks can be further reduced and profitability improved. This strategy is suitable for medium-to-long-term holding without the need for frequent trading. In general, it has strong practical value for live trading.
/*backtest
start: 2023-01-10 00:00:00
end: 2024-01-16 00:00:00
period: 1d
basePeriod: 1h
exchanges: [{"eid":"Futures_Binance","currency":"BTC_USDT"}]
*/

// This source code is subject to the terms of the Mozilla Public License 2.0 at https://mozilla.org/MPL/2.0/
// © TradingAmmo

//@version=4
strategy("Linear Channel", overlay=true, default_qty_type=strategy.percent_of_equity, default_qty_value=100, commission_type=strategy.commission.percent, commission_value=0.075, currency='USD')
startP = timestamp(input(2017, "Start Year"), input(12, "Month"), input(17, "Day"), 0, 0)
end   = timestamp(input(9999, "End Year"),  1, 1,  0, 0)
_testPeriod() => true

//linreg
length = input(55)
linreg = linreg(close, length, 0)
plot(linreg, color=color.white)

//calc band
Value = input(-2)
sub = (Value/100)+1
Band2 = linreg*sub
plot(Band2, color=color.red)

//HMA as a filter
HMA = input(400, minval=1)
plot(hma(close, HMA), color=color.purple)

long_condition = close <  Band2  and hma(close, HMA) < close and _testPeriod()
strategy.entry('BUY', strategy.long, when=long_condition)

short_condition =  close > linreg
strategy.close('BUY', when=short_condition)