Overview
This strategy is a trend-following trading system based on dual moving average crossovers and time optimization. It utilizes the intersection of short-term and long-term moving averages to generate buy and sell signals, while incorporating a specific trading time window to optimize trade execution. The strategy also includes multiple target prices and stop-loss levels to manage risk and profit-taking.
Strategy Principles
The core principle of this strategy is to use two moving averages (MAs) with different periods to identify market trends and generate trading signals. Specifically:
Short-term and Long-term MAs: The strategy uses two user-defined moving average periods, representing short-term and long-term market trends.
Crossover Signals: A buy signal is generated when the short-term MA crosses above the long-term MA; a sell signal is generated when the short-term MA crosses below the long-term MA.
Time Optimization: The strategy introduces a trading time window concept, executing trades only within a user-specified UTC time range, helping to avoid periods of high market volatility or low liquidity.
Multiple Target Prices: The strategy sets two target prices (Target_1 and Target_2) for each trade, allowing for stepped profit-taking.
Risk Management: Each trade is set with a stop-loss point to limit potential losses.
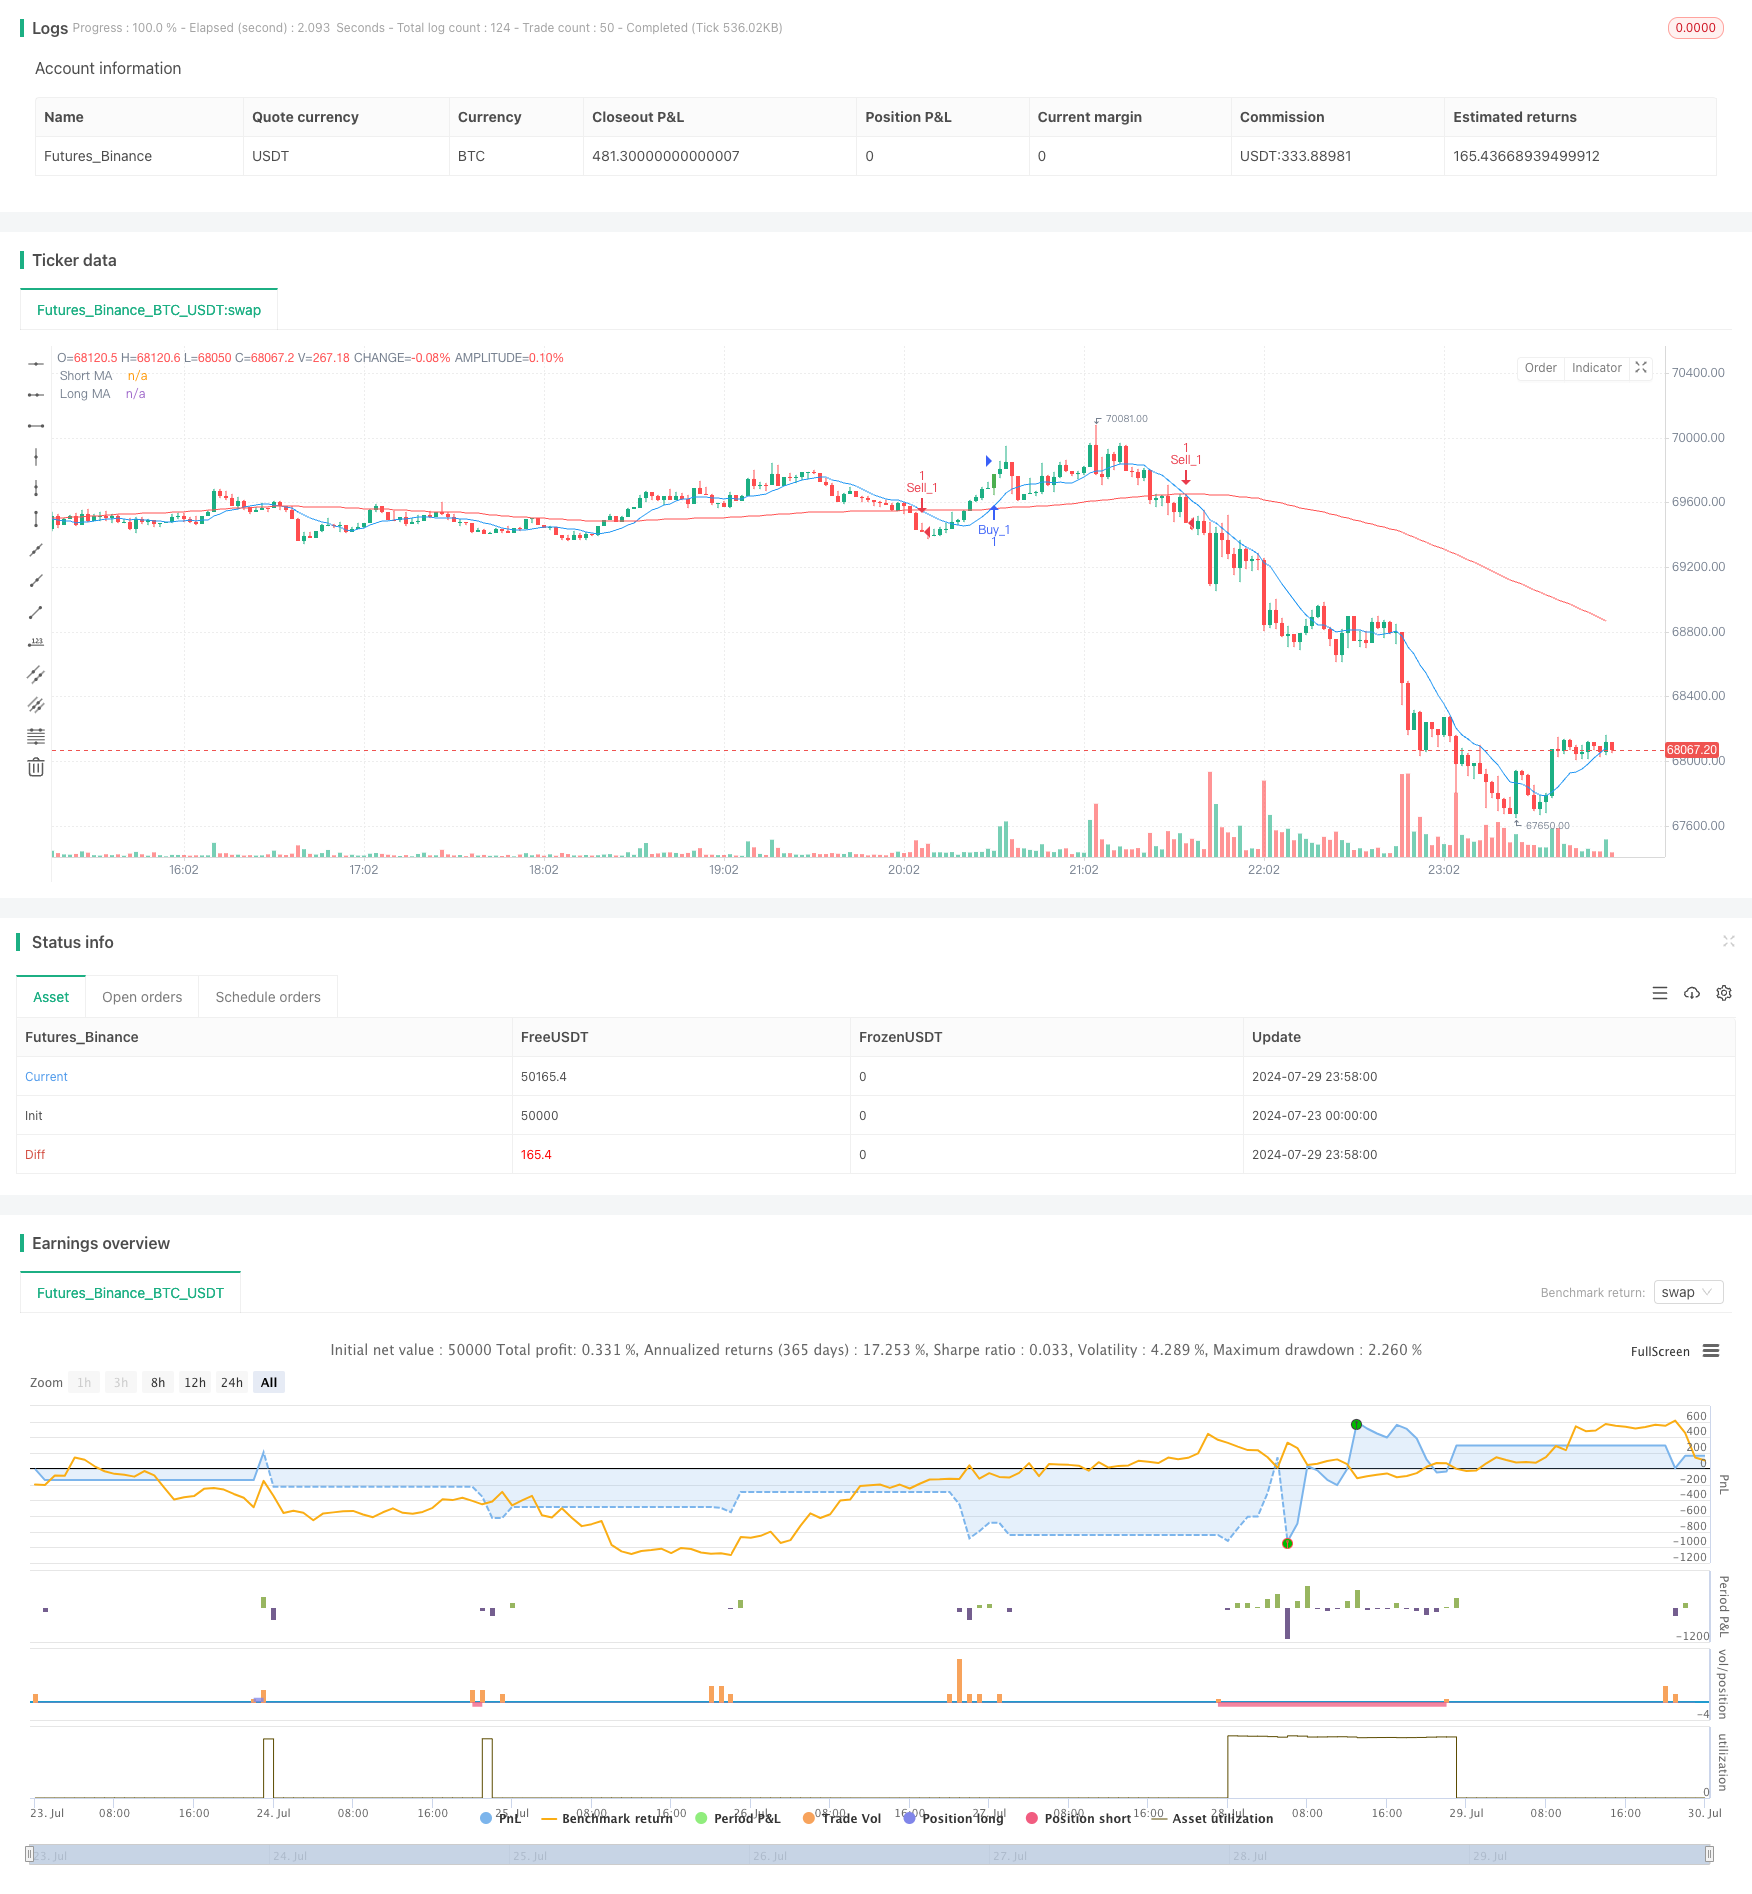
Visualization: The strategy marks buy and sell signals and labels price targets on the chart, allowing traders to intuitively understand market dynamics.
Strategy Advantages
Trend Following: By using moving average crossovers, the strategy can effectively capture market trends, increasing profit opportunities.
Time Optimization: By limiting the trading time window, the strategy can focus on the most active and profitable market periods, improving trading efficiency.
Risk Management: Multiple target prices and stop-loss settings help balance risk and reward, protecting capital safety.
Flexibility: Users can adjust MA periods, target prices, and trading time windows according to personal preferences and market characteristics.
Visual Assistance: By annotating buy/sell signals and target price achievements on the chart, traders can more intuitively understand strategy performance.
Bi-directional Trading: The strategy supports both long and short positions, seeking opportunities in various market environments.
Strategy Risks
Choppy Market Risk: In sideways markets, frequent MA crossovers may lead to excessive false signals and trading costs.
Slippage Risk: In fast markets, actual execution prices may differ significantly from prices at signal generation.
Over-reliance on Historical Data: Moving averages are lagging indicators and may not react timely to sudden market reversals.
Time Window Limitations: Strict trading time restrictions may cause missed important market opportunities.
Fixed Stop-Loss Risk: Using fixed-point stop-losses may not be flexible enough during high volatility periods.
Overtrading: Under certain market conditions, the strategy may generate too many trading signals, increasing transaction costs.
Strategy Optimization Directions
Dynamic Parameter Adjustment: Consider introducing adaptive mechanisms to dynamically adjust MA periods and trading parameters based on market volatility.
Volatility Filtering: Evaluate market volatility before generating trading signals to avoid overtrading during low volatility periods.
Improved Stop-Loss Mechanism: Consider using dynamic stop-losses based on ATR (Average True Range) to adapt to different market conditions.
Integration of Other Technical Indicators: Such as RSI or MACD, to confirm trend strength and improve signal quality.
Backtesting Optimization: Conduct more extensive historical data backtesting to find optimal parameter combinations and time window settings.
Capital Management Optimization: Implement more sophisticated position sizing strategies, such as dynamically adjusting trade size based on account size and market volatility.
Consideration of Fundamental Factors: Adjust strategy behavior before and after important economic data releases to avoid trading during high uncertainty periods.
Machine Learning Integration: Explore using machine learning algorithms to optimize parameter selection and signal generation processes.
Conclusion
The Dual Moving Average Momentum Trading Strategy is a trend-following system that combines technical analysis with time optimization. By leveraging moving average crossovers and a carefully designed trading time window, the strategy aims to capture market trends and optimize trade execution. While the strategy has advantages such as intuitiveness and flexibility, it also faces risks like market volatility and overtrading. Through continuous optimization and improvement, such as introducing dynamic parameter adjustments, improving risk management mechanisms, and integrating more technical indicators, this strategy has the potential to become a more robust and efficient trading system. Traders using this strategy should fully understand its principles and make appropriate parameter adjustments based on personal risk preferences and market environments.
/*backtest
start: 2024-07-23 00:00:00
end: 2024-07-30 00:00:00
period: 2m
basePeriod: 1m
exchanges: [{"eid":"Futures_Binance","currency":"BTC_USDT"}]
*/

//@version=5
strategy("Gold Trend Trader", shorttitle="Gold Trader", overlay=true)

// User-defined input for moving averages
shortMA = input.int(10, minval=1, title="Short MA Period")
longMA = input.int(100, minval=1, title="Long MA Period")
target_1 = input.int(100, minval=1, title="Target_1")
target_2 = input.int(150, minval=1, title="Target_2")

// User-defined input for the start and end times with default values
startTimeInput = input.int(12, title="Start Time for Session (UTC, in hours)", minval=0, maxval=23)
endTimeInput = input.int(17, title="End Time Session (UTC, in hours)", minval=0, maxval=23)
// Convert the input hours to minutes from midnight
startTime = startTimeInput * 60
endTime = endTimeInput * 60

// Function to convert the current exchange time to UTC time in minutes
toUTCTime(exchangeTime) =>
    exchangeTimeInMinutes = exchangeTime / 60000
    // Adjust for UTC time
    utcTime = exchangeTimeInMinutes % 1440
    utcTime

// Get the current time in UTC in minutes from midnight
utcTime = toUTCTime(time)

// Check if the current UTC time is within the allowed timeframe
isAllowedTime = (utcTime >= startTime and utcTime < endTime)

// Calculating moving averages
shortMAValue = ta.sma(close, shortMA)
longMAValue = ta.sma(close, longMA)

// Plotting the MAs
plot(shortMAValue, title="Short MA", color=color.blue)
plot(longMAValue, title="Long MA", color=color.red)

// Tracking buy and sell signals
var float buyEntryPrice_1 = na
var float buyEntryPrice_2 = na
var float sellEntryPrice_1 = na
var float sellEntryPrice_2 = na

// Logic for Buy and Sell signals
buySignal = ta.crossover(shortMAValue, longMAValue) and isAllowedTime
sellSignal = ta.crossunder(shortMAValue, longMAValue) and isAllowedTime

// Entry conditions for long and short trades
if (buySignal)
    strategy.entry("Buy_1", strategy.long)
    strategy.exit("TP_1", "Buy_1", limit=close + target_1, stop=close - 100)

    strategy.entry("Buy_2", strategy.long)
    strategy.exit("TP_2", "Buy_2", limit=close + target_2, stop=close - 1500)

if (sellSignal)
    strategy.entry("Sell_1", strategy.short)
    strategy.exit("TP_3", "Sell_1", limit=close - target_1, stop=close + 100)

    strategy.entry("Sell_2", strategy.short)
    strategy.exit("TP_4", "Sell_2", limit=close - target_2, stop=close + 150)

// Apply background color for entry candles
barcolor(buySignal ? color.green : sellSignal ? color.red : na)

// Creating buy and sell labels
if (buySignal)
    label.new(bar_index, low, text="BUY", style=label.style_label_up, color=color.green, textcolor=color.white, yloc=yloc.belowbar)

if (sellSignal)
    label.new(bar_index, high, text="SELL", style=label.style_label_down, color=color.red, textcolor=color.white, yloc=yloc.abovebar)

// Creating labels for 100-point movement
if (not na(buyEntryPrice_1) and close >= buyEntryPrice_1 + target_1)
    label.new(bar_index, high, text=str.tostring(target_1), style=label.style_label_down, color=color.green, textcolor=color.white, yloc=yloc.abovebar)
    buyEntryPrice_1 := na // Reset after label is created

if (not na(buyEntryPrice_2) and close >= buyEntryPrice_2 + target_2)
    label.new(bar_index, high, text=str.tostring(target_2), style=label.style_label_down, color=color.green, textcolor=color.white, yloc=yloc.abovebar)
    buyEntryPrice_2 := na // Reset after label is created

if (not na(sellEntryPrice_1) and close <= sellEntryPrice_1 - target_1)
    label.new(bar_index, low, text=str.tostring(target_1), style=label.style_label_up, color=color.red, textcolor=color.white, yloc=yloc.belowbar)
    sellEntryPrice_1 := na // Reset after label is created

if (not na(sellEntryPrice_2) and close <= sellEntryPrice_2 - target_2)
    label.new(bar_index, low, text=str.tostring(target_2), style=label.style_label_up, color=color.red, textcolor=color.white, yloc=yloc.belowbar)
    sellEntryPrice_2 := na // Reset after label is created