Overview
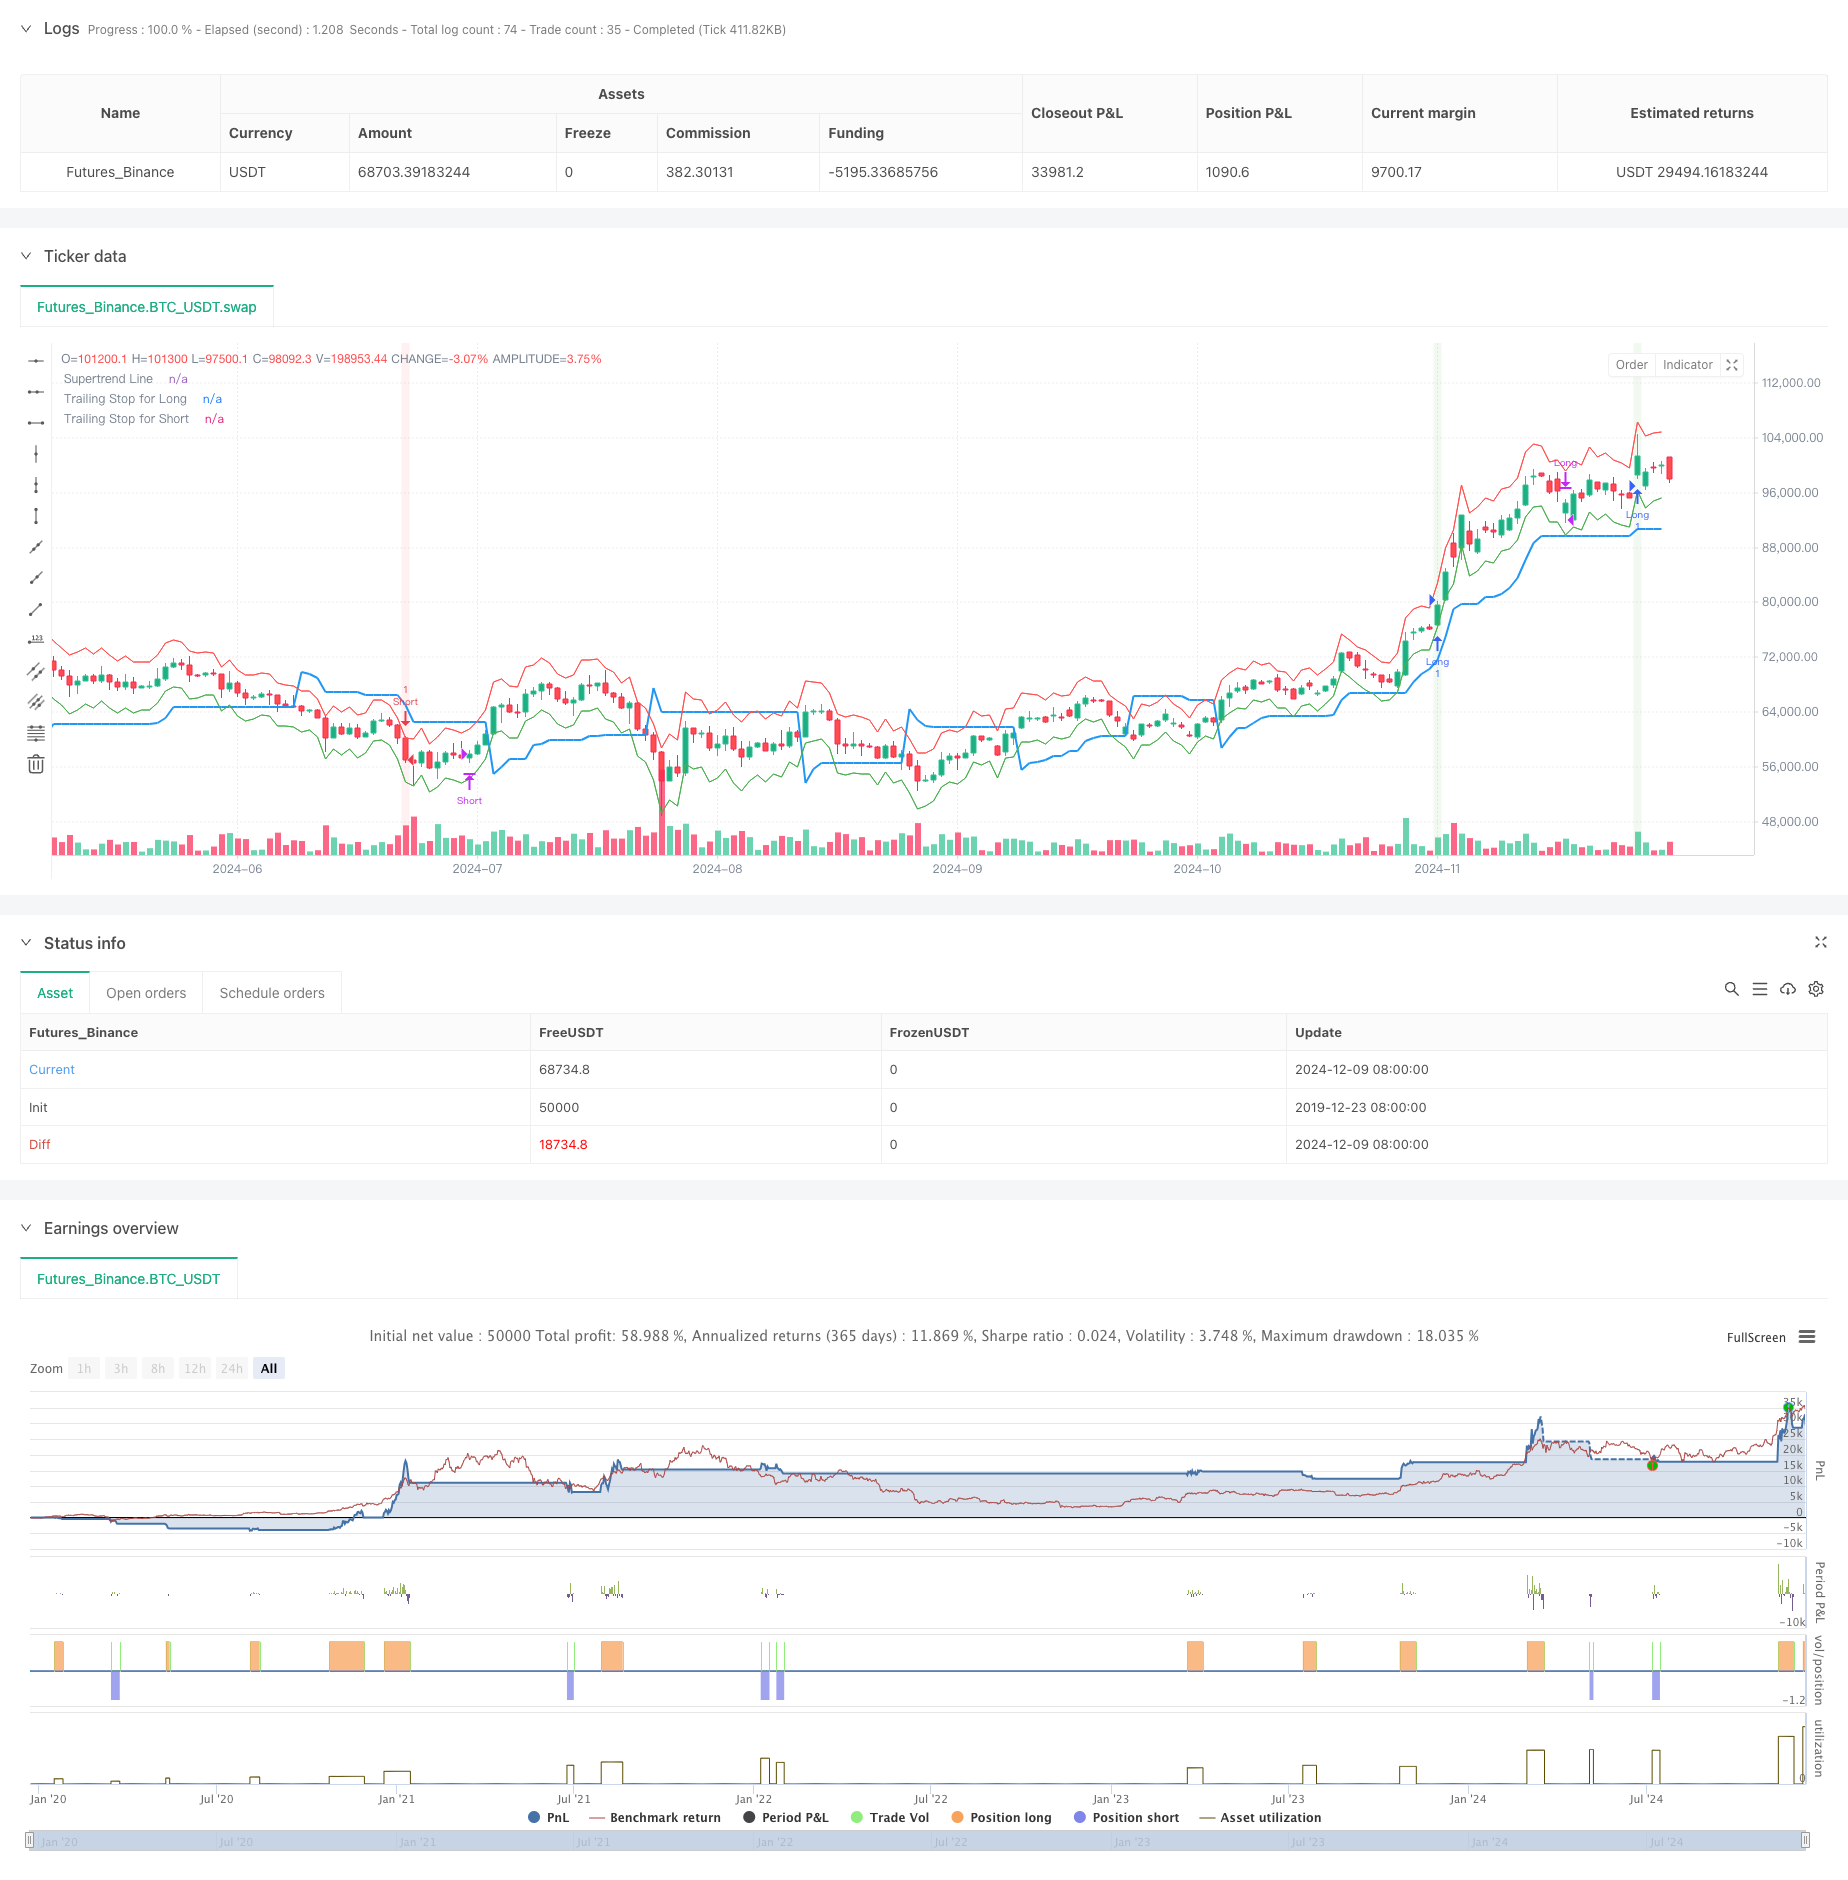
This strategy is a multi-technical indicator trend following trading system that combines Bollinger Bands, trend indicators, momentum indicators, and volatility indicators, making trading decisions through price-volume analysis. The strategy uses Bollinger Bands breakout as the primary entry signal, combined with ADX trend strength confirmation and volume breakthrough verification, using MACD and ATR trailing stop as exit mechanisms.
Strategy Principles
The core logic of the strategy is based on the following aspects: 1. Using Bollinger Bands as a reference for price volatility range, looking for long opportunities when price breaks above the upper band and short opportunities when it breaks below the lower band 2. Using the ADX indicator to judge trend strength, only opening positions when the trend is strong enough (ADX>25) 3. Requiring volume surge (1.5 times above 20-day average volume) to confirm price breakout validity 4. Using SuperTrend indicator as trend direction filter, only entering positions when price is on the correct side of the trend line 5. Using MACD death cross, ATR trailing stop, or ADX weakening as exit conditions
Strategy Advantages
- Multiple signal combinations improve trading accuracy and effectively reduce risks from false breakouts
- ADX and volume confirmation improve the win rate of trend trading
- Dynamic stop loss mechanism (ATR trailing stop) protects profits while giving trends enough room to develop
- Combines advantages of trend following and reversal strategies, capturing major trends without missing important reversal opportunities
- Has comprehensive risk control mechanisms, including trend strength confirmation, price-volume correlation, and dynamic stop loss
Strategy Risks
- May generate frequent false signals in oscillating markets, leading to consecutive stop losses
- Multiple conditions stacking may cause missing some important trading opportunities
- ATR stops may trigger too early when volatility suddenly increases
- Depends on trend continuity, may experience significant drawdowns during sudden trend reversals
- Requires large sample size to verify strategy effectiveness
Strategy Optimization Directions
- Consider adding market environment judgment mechanism, using different parameter combinations under different market conditions
- Can introduce time filtering to avoid known high volatility periods
- Optimize stop loss parameters, dynamically adjust ATR multiplier in different volatility environments
- Increase depth of volume analysis, considering volume quality rather than just quantity
- Consider adding more market sentiment indicators to improve signal reliability
Summary
This is a well-designed multi-indicator trend following strategy that constructs a trading system combining trend following and risk control through organic integration of Bollinger Bands, ADX, SuperTrend, MACD, and other indicators. The strategy’s advantages lie in multiple signal confirmation and comprehensive risk control mechanisms, but it also faces challenges of over-optimization and parameter sensitivity. Through continuous optimization and dynamic adaptation to market environment, this strategy has the potential to maintain stable performance across different market conditions.
/*backtest
start: 2019-12-23 08:00:00
end: 2024-12-10 08:00:00
period: 1d
basePeriod: 1d
exchanges: [{"eid":"Futures_Binance","currency":"BTC_USDT"}]
*/

//@version=5
strategy("Nifty Options Trendy Markets with TSL", overlay=true)
// Input Parameters
lengthBB = input(20, title="Bollinger Bands Length")
multBB = input(2.0, title="Bollinger Bands Multiplier")
adxLength = input(14, title="ADX Length")
adxThreshold = input(25, title="ADX Entry Threshold")
adxExitThreshold = input(20, title="ADX Exit Threshold")
superTrendLength = input(10, title="Supertrend Length")
superTrendMultiplier = input(3.0, title="Supertrend Multiplier")
macdFast = input(12, title="MACD Fast Length")
macdSlow = input(26, title="MACD Slow Length")
macdSignal = input(9, title="MACD Signal Length")
atrLength = input(14, title="ATR Length")
atrMultiplier = input(1.5, title="Trailing Stop ATR Multiplier")
volumeSpikeMultiplier = input(1.5, title="Volume Spike Multiplier")

// Calculations
[macdLine, signalLine,_ ] = ta.macd(close, macdFast, macdSlow, macdSignal)
macdCrossover = ta.crossover(macdLine, signalLine)
macdCrossunder = ta.crossunder(macdLine, signalLine)
[middleBB,upperBB,lowerBB] = ta.bb(close, lengthBB, multBB)
[supertrend, direction]  = ta.supertrend(superTrendMultiplier,superTrendLength)
len = input.int(17, minval=1, title="DI Length")
lensig = input.int(14, title="ADX Smoothing", minval=1, maxval=50)
[diplus, diminus, adx] = ta.dmi(len, lensig)
atr = ta.atr(atrLength)
trailingStopLong = close - atr * atrMultiplier // For long trades
trailingStopShort = close + atr * atrMultiplier // For short trades
volumeSpike = volume > ta.sma(volume, 20) * volumeSpikeMultiplier

// Entry Conditions
longEntry = ta.crossover(close, upperBB) and adx > adxThreshold and volumeSpike and close > supertrend
shortEntry = ta.crossunder(close, lowerBB) and adx > adxThreshold and volumeSpike and close < supertrend

// Exit Conditions
longExit = ta.crossunder(macdLine, signalLine) or close < trailingStopLong or adx < adxExitThreshold
shortExit = ta.crossover(macdLine, signalLine) or close > trailingStopShort or adx < adxExitThreshold

// Strategy Entries and Exits
if (longEntry)
    strategy.entry("Long", strategy.long)
if (shortEntry)
    strategy.entry("Short", strategy.short)
if (longExit)
    strategy.close("Long")
if (shortExit)
    strategy.close("Short")

// Plotting
plot(supertrend, color=color.blue, style=plot.style_line, linewidth=2, title="Supertrend Line")
plot(trailingStopLong, title="Trailing Stop for Long", color=color.green, style=plot.style_line)
plot(trailingStopShort, title="Trailing Stop for Short", color=color.red, style=plot.style_line)
bgcolor(longEntry ? color.new(color.green, 90) : shortEntry ? color.new(color.red, 90) : na, title="Background for Entry")

// Alerts
alertcondition(longEntry, title="Long Entry", message="Buy Call: Long entry conditions met")
alertcondition(shortEntry, title="Short Entry", message="Buy Put: Short entry conditions met")
alertcondition(longExit, title="Long Exit", message="Exit Call: Long exit conditions met")
alertcondition(shortExit, title="Short Exit", message="Exit Put: Short exit conditions met")