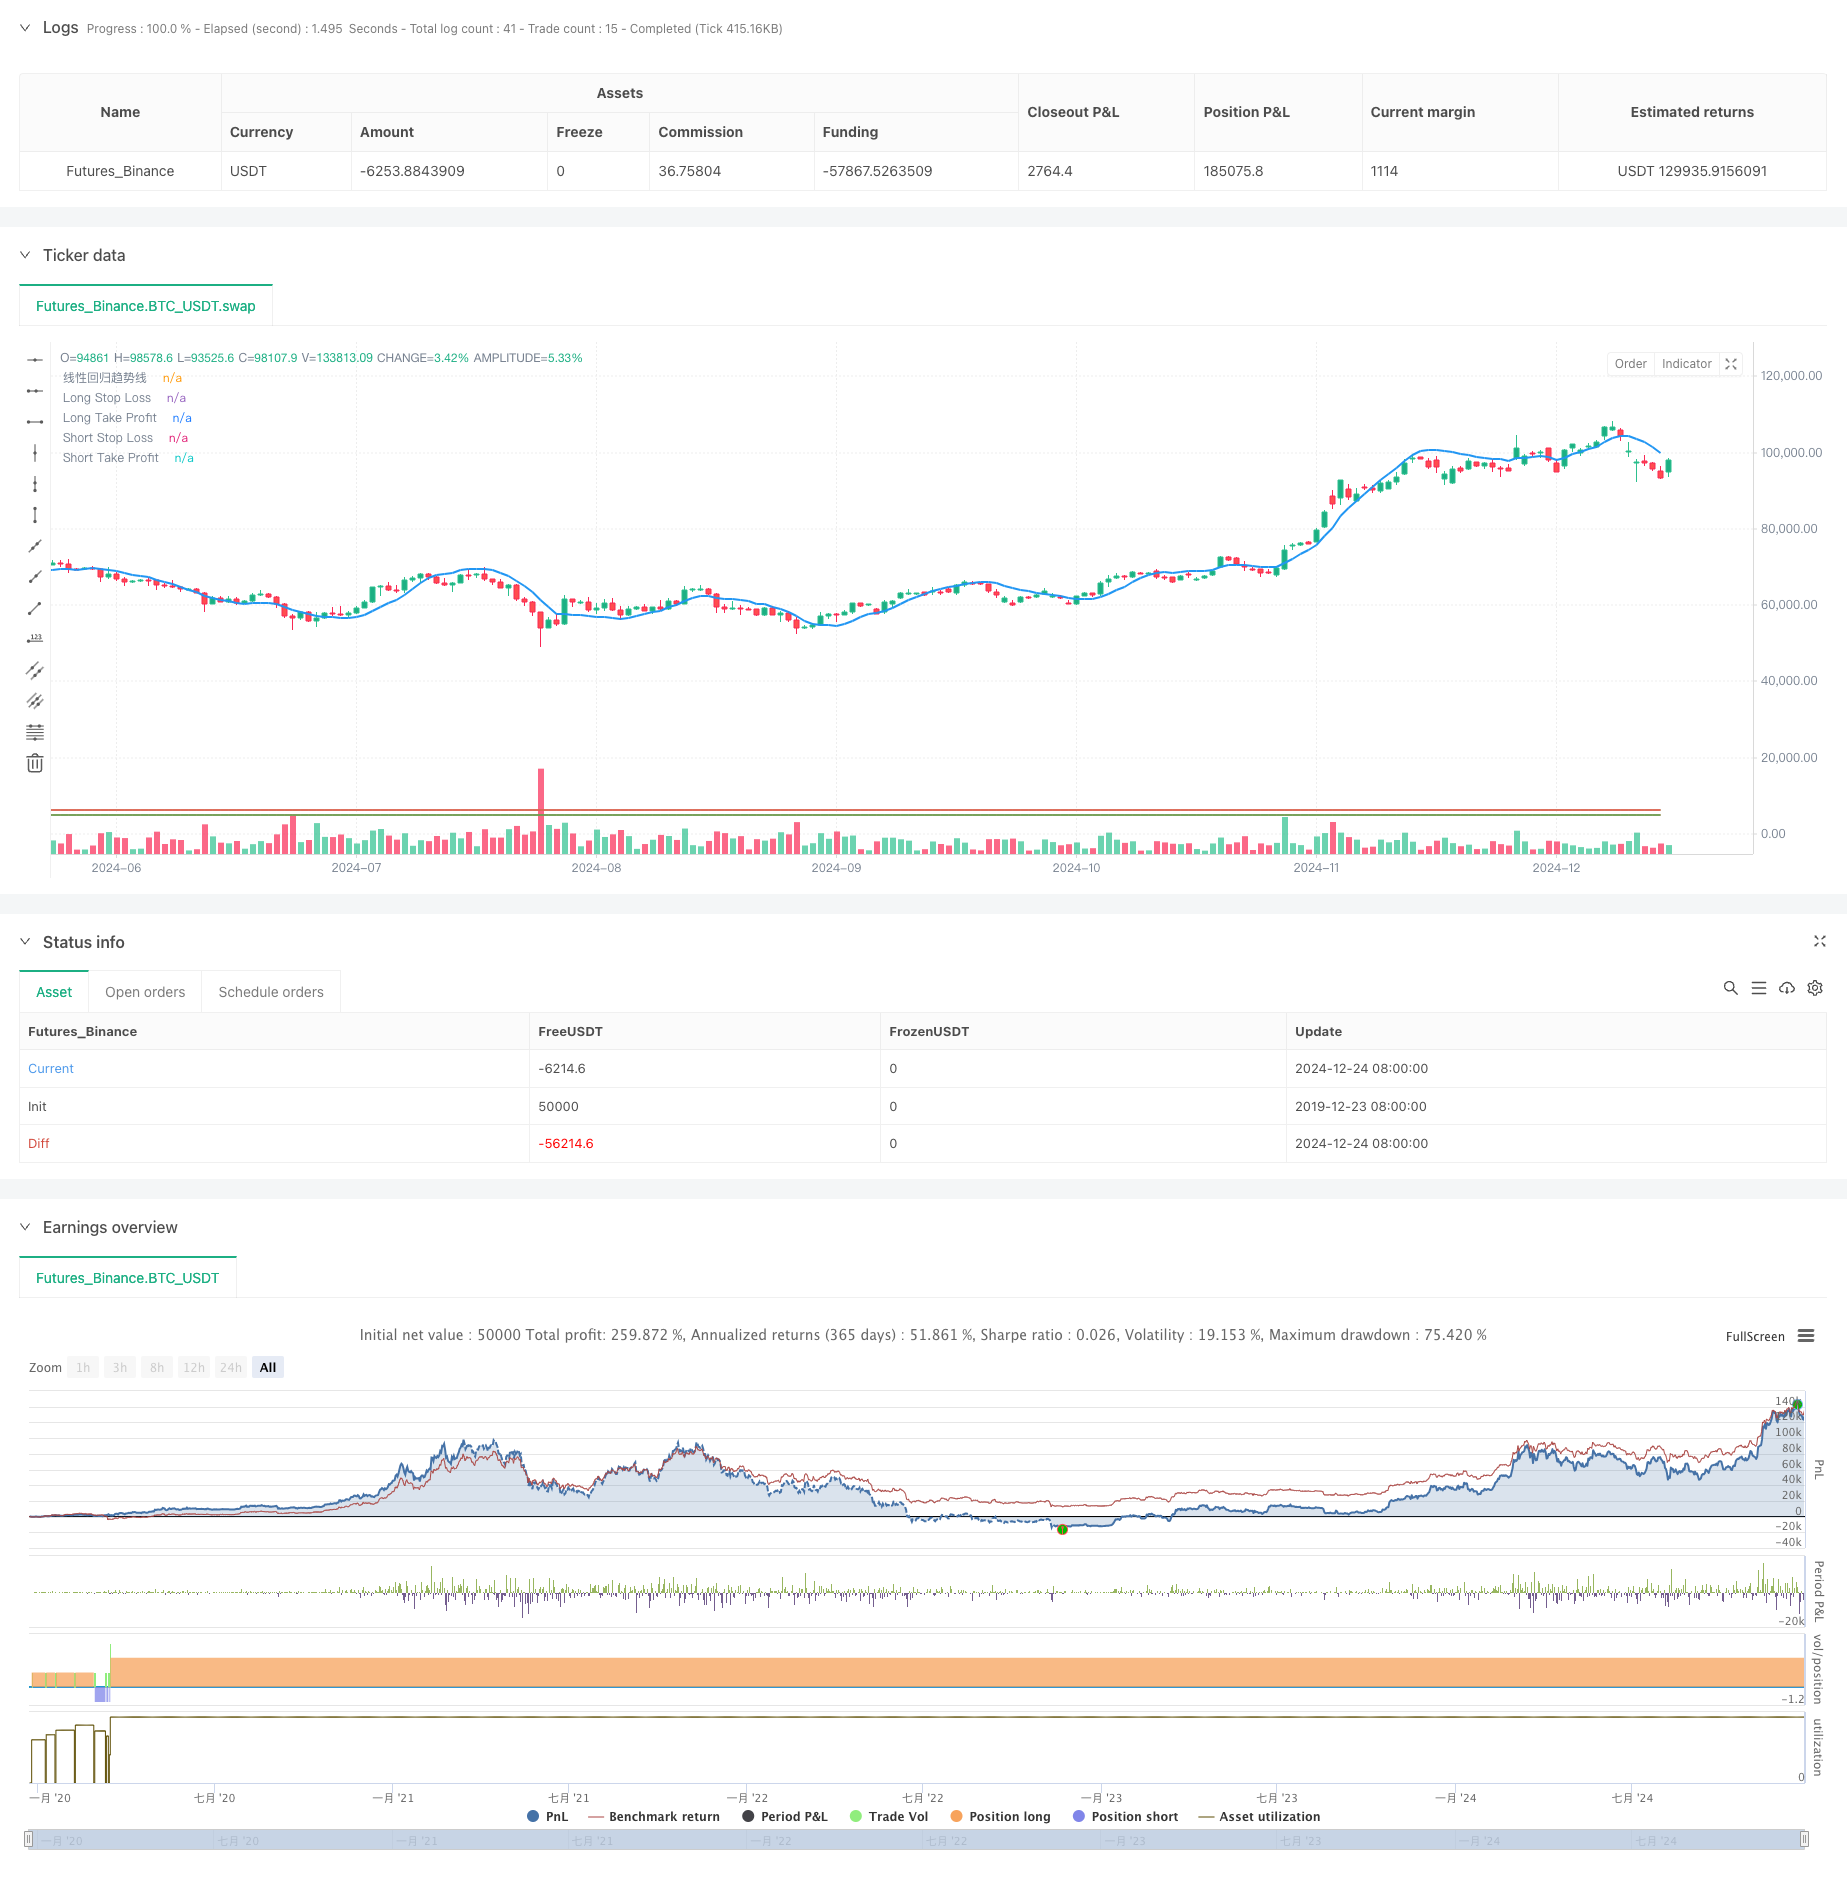
Overview
This strategy is a breakout trading system based on linear regression trendlines. It executes trades when price breaks through the trendline by a certain percentage, incorporating stop-loss, take-profit, and position reversal mechanisms. The core concept is to capture sustained price movements following trendline breakouts while using position reversal to handle false signals.
Strategy Principle
The strategy uses the ta.linreg function to calculate a linear regression trendline over a specified period as the primary trend indicator. Long signals are generated when price breaks above the trendline by more than the set threshold, while short signals occur when price breaks below. The strategy employs a unidirectional position mechanism, allowing only long or short positions at any time. Risk management includes stop-loss and take-profit conditions, along with a position reversal mechanism that automatically opens a counter position with increased size when stops are hit.
Strategy Advantages
- Strong trend following capability: Linear regression trendlines effectively capture market trends and reduce false breakouts.
- Comprehensive risk control: Implements stop-loss and take-profit mechanisms to effectively control single trade risk.
- Position reversal mechanism: Quickly adjusts position direction during trend reversals with increased position size.
- Breakout confirmation: Uses threshold settings to filter minor fluctuations and improve signal reliability.
- Flexible position management: Controls overall position risk through maximum trade size limits and unidirectional positioning.
Strategy Risks
- Choppy market risk: May trigger frequent false breakout signals in ranging markets, leading to consecutive losses.
- Reversal trading risk: Position reversal mechanism may amplify losses during severe market volatility.
- Parameter sensitivity: Strategy performance heavily depends on parameter settings, which may lead to overtrading or missed opportunities.
- Slippage impact: Actual execution prices for stop and limit orders may significantly deviate from expected levels in fast markets.
- Money management risk: Inappropriate reversal multiplier settings may result in overly aggressive capital utilization.
Strategy Optimization Directions
- Incorporate volatility indicators: Dynamically adjust breakout thresholds based on market volatility to improve adaptability.
- Enhance reversal mechanism: Add conditional checks for reversals, such as trend strength indicators, to avoid unsuitable market conditions.
- Improve position sizing: Implement dynamic position management based on account equity and market volatility.
- Add market environment filters: Include trend strength and market state assessments to reduce trading frequency in unfavorable conditions.
- Optimize stop-loss methods: Introduce trailing stops or ATR-based dynamic stops for more flexible risk management.
Summary
This strategy constructs a complete trading system using linear regression trendlines and breakout trading concepts. It manages risk through stop-loss, take-profit, and position reversal mechanisms, demonstrating good trend-following capabilities. However, careful consideration is needed for parameter settings and market environment selection. Thorough parameter optimization and backtesting are recommended before live trading. Future improvements can focus on incorporating additional technical indicators and optimizing trading rules to enhance stability and adaptability.
/*backtest
start: 2019-12-23 08:00:00
end: 2024-12-25 08:00:00
period: 1d
basePeriod: 1d
exchanges: [{"eid":"Futures_Binance","currency":"BTC_USDT"}]
*/

//@version=6
strategy("BTC Trendline Strategy - 1min - One Direction", overlay=true)

// 输入设置
stop_loss_pct = input.float(10, title="止损百分比", minval=0.1, step=0.1) / 100
take_profit_pct = input.float(10, title="止盈百分比", minval=0.1, step=0.1) / 100
multiplier = input.int(2, title="止损触发时翻倍倍数", minval=1)
length = input.int(20, title="趋势线计算周期", minval=1)
breakout_threshold = input.float(1, title="突破幅度百分比", minval=0.1) / 100  // 设置突破的幅度条件
max_qty = 1000000000000.0  // 设置最大允许的交易量

// 计算线性回归趋势线
regression = ta.linreg(close, length, 0)  // 使用线性回归计算价格的趋势线

// 绘制趋势线
plot(regression, color=color.blue, linewidth=2, title="线性回归趋势线")

// 判断突破条件:增加一个价格偏差条件
long_condition = close > (regression * (1 + breakout_threshold))  // 当前价格高于趋势线且突破幅度超过设定百分比时做多
short_condition = close < (regression * (1 - breakout_threshold))  // 当前价格低于趋势线且突破幅度超过设定百分比时做空

// 确保每次只能有一个方向持仓:避免多空同时持仓
if (strategy.position_size == 0)  // 当前没有持仓时
    if (long_condition)
        strategy.entry("Long", strategy.long)
    if (short_condition)
        strategy.entry("Short", strategy.short)

// 止损和止盈设置
long_stop_loss = strategy.position_avg_price * (1 - stop_loss_pct)
long_take_profit = strategy.position_avg_price * (1 + take_profit_pct)
short_stop_loss = strategy.position_avg_price * (1 + stop_loss_pct)
short_take_profit = strategy.position_avg_price * (1 - take_profit_pct)

// 绘制止损和止盈线,便于调试
plot(long_stop_loss, color=color.red, linewidth=1, title="Long Stop Loss")
plot(long_take_profit, color=color.green, linewidth=1, title="Long Take Profit")
plot(short_stop_loss, color=color.red, linewidth=1, title="Short Stop Loss")
plot(short_take_profit, color=color.green, linewidth=1, title="Short Take Profit")

// 止损和止盈退出策略
strategy.exit("LongExit", from_entry="Long", stop=long_stop_loss, limit=long_take_profit)
strategy.exit("ShortExit", from_entry="Short", stop=short_stop_loss, limit=short_take_profit)

// 反手交易逻辑
reverse_qty = math.min(math.abs(strategy.position_size) * multiplier, max_qty)  // 限制最大交易量
if (strategy.position_size < 0 and close > short_stop_loss)  // 空单止损时,反手做多并翻倍仓位
    strategy.entry("Long Reverse", strategy.long, qty=reverse_qty)

if (strategy.position_size > 0 and close < long_stop_loss)  // 多单止损时,反手做空并翻倍仓位
    strategy.entry("Short Reverse", strategy.short, qty=reverse_qty)

// 打印日志帮助调试止损
if (strategy.position_size > 0)
    label.new(bar_index, close, text="Long SL: " + str.tostring(long_stop_loss), color=color.green, style=label.style_label_up)

if (strategy.position_size < 0)
    label.new(bar_index, close, text="Short SL: " + str.tostring(short_stop_loss), color=color.red, style=label.style_label_down)