Overview
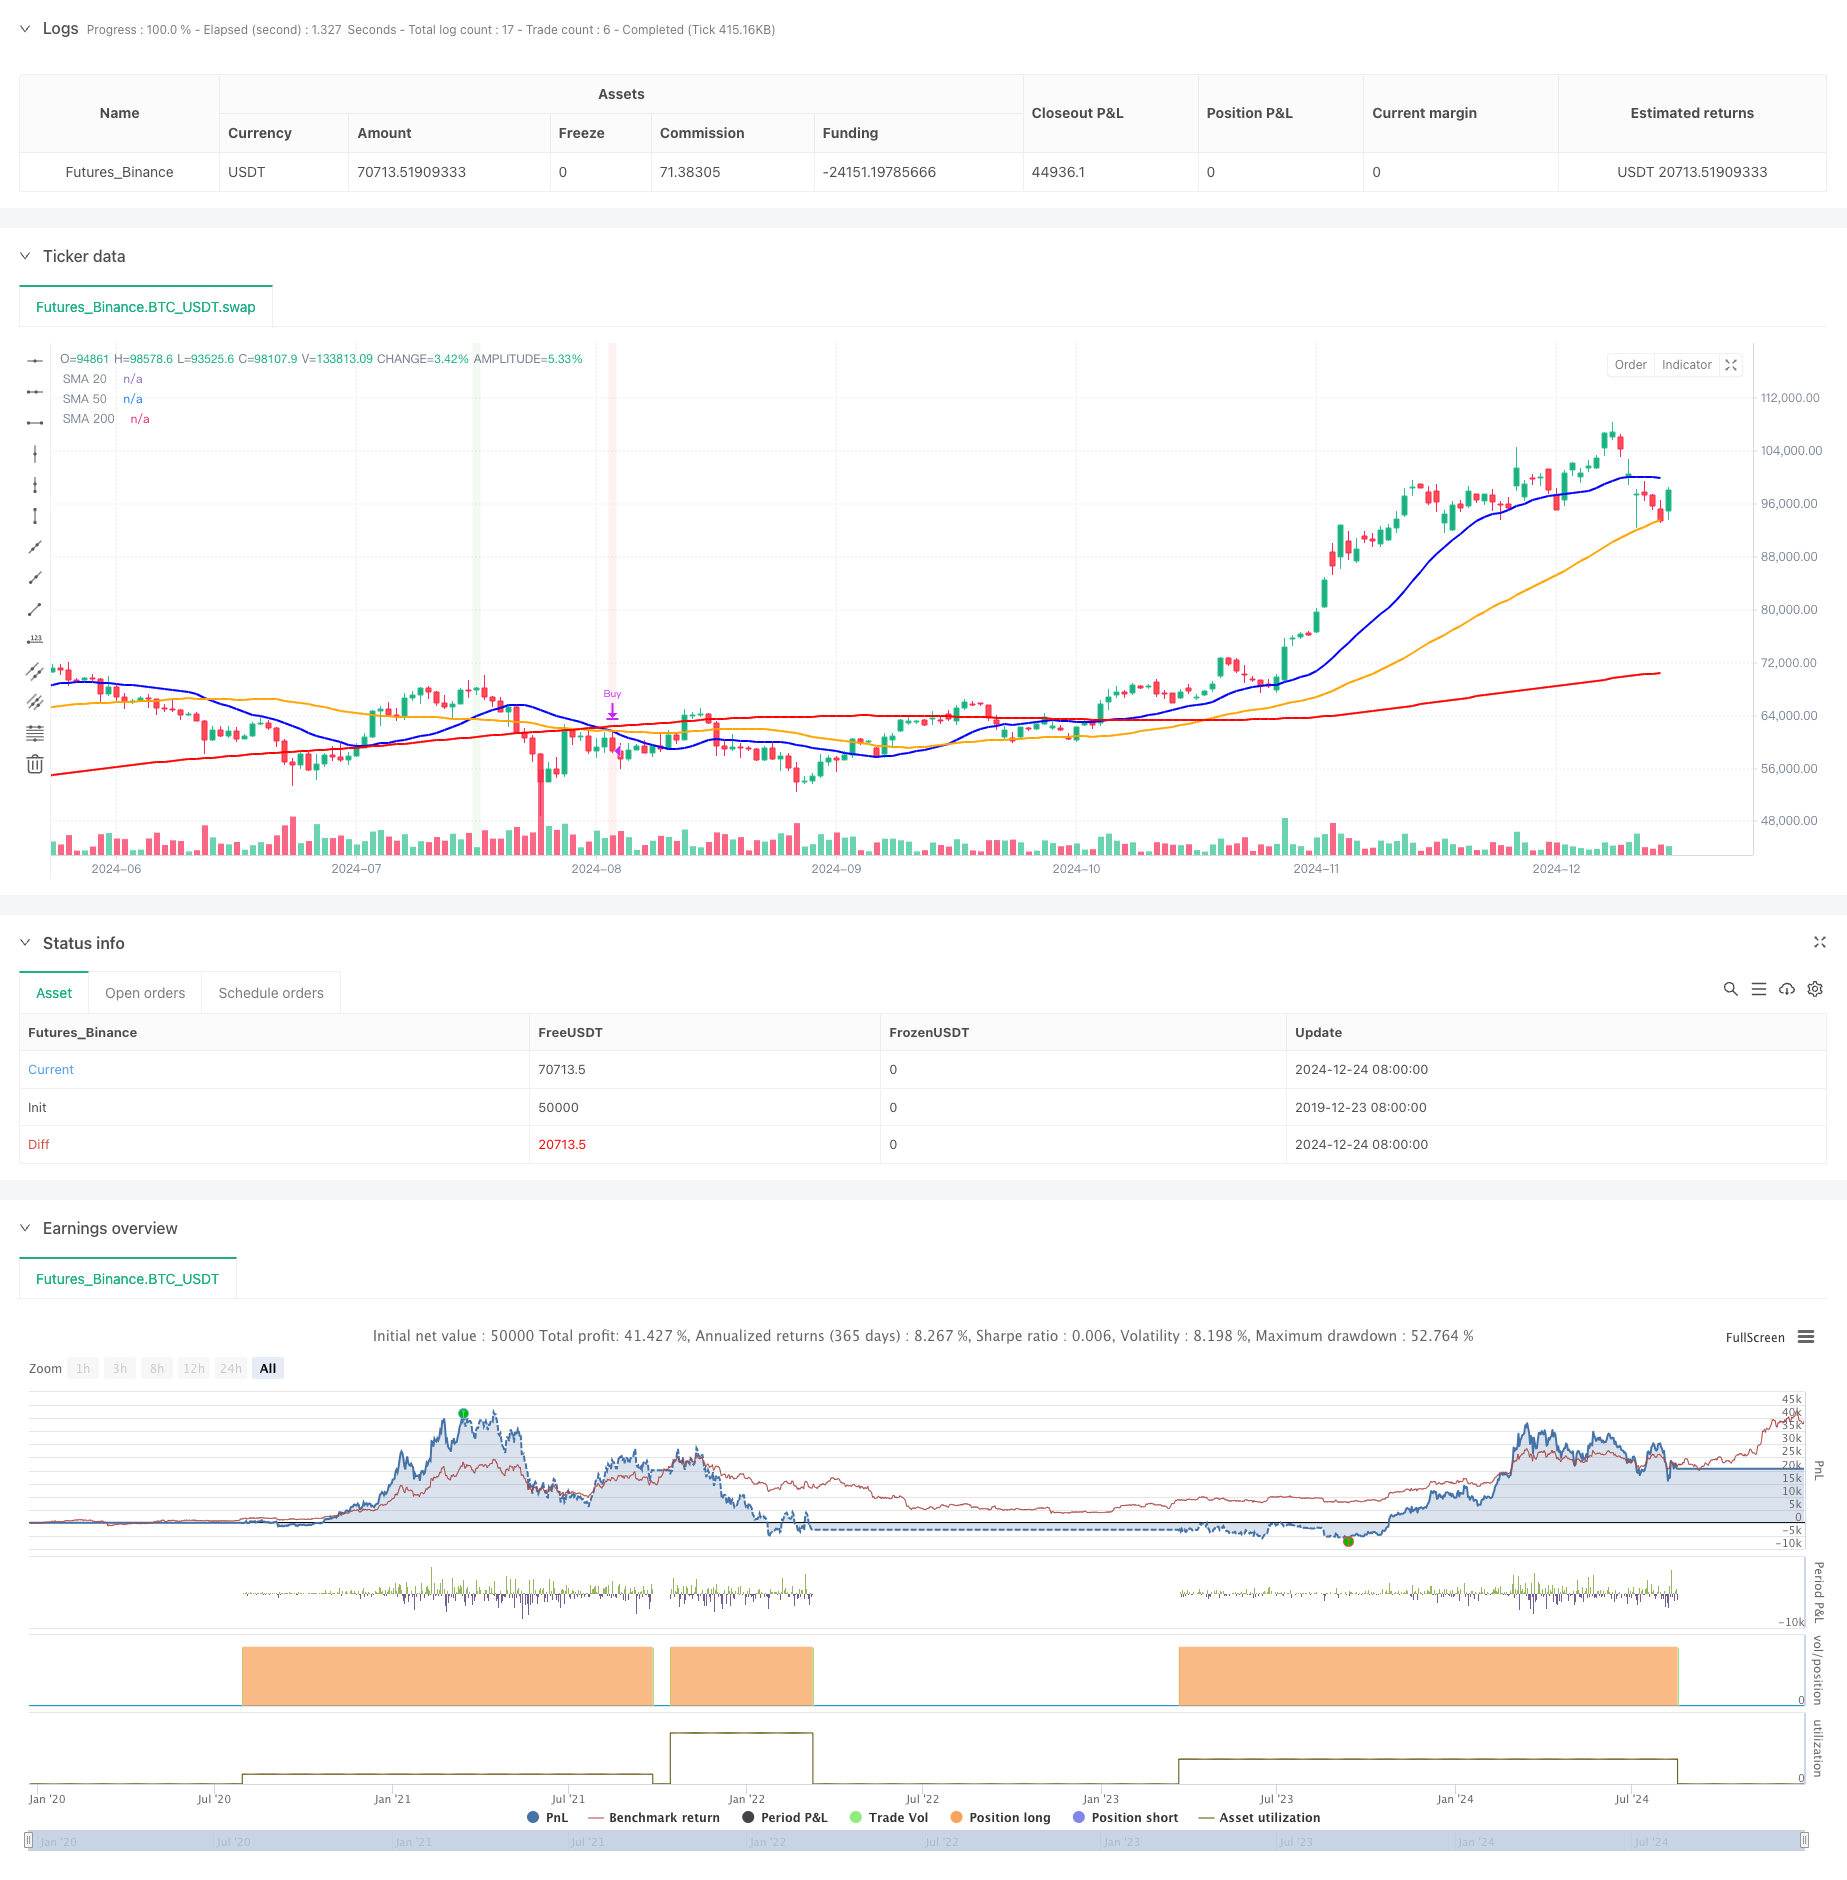
This strategy is a quantitative trading system based on multiple Simple Moving Average (SMA) crossover signals. It utilizes three SMAs with different periods (20, 50, and 200 days) to identify market trend changes and potential trading opportunities by capturing moving average crossovers and price position relationships. The strategy considers both short-term and medium-term moving average crossovers while using the long-term moving average as a trend filter to enhance trading quality.
Strategy Principles
The core logic is based on the following key elements: 1. Uses 20-day SMA as short-term trend indicator, 50-day SMA as medium-term trend indicator, and 200-day SMA as long-term trend indicator 2. Main entry signal: When 20-day SMA crosses above 50-day SMA and price is above 200-day SMA, system generates long signal 3. Main exit signal: When 20-day SMA crosses below 50-day SMA and price is below 200-day SMA, system generates closing signal 4. Secondary signals: Monitors crossovers between 50-day and 200-day SMAs as supplementary indicators 5. Visualizes trading signals through markers and background color changes
Strategy Advantages
- Multi-timeframe analysis: Integrates moving averages of different periods for comprehensive trend analysis
- Trend filtering: Uses 200-day SMA as trend filter to effectively reduce false breakout risks
- Signal hierarchy: Distinguishes between primary and secondary signals for better market insight
- Enhanced visualization: Uses markers and background colors to improve strategy readability
- Flexible parameters: Allows customization of moving average periods, colors, and line widths to adapt to different trading needs
Strategy Risks
- Sideways market risk: May generate frequent false signals during consolidation phases
- Lag risk: Moving averages are inherently lagging indicators and may miss critical turning points
- Parameter dependency: Optimal parameters may vary significantly across different market environments
- Trend dependency: Strategy performs better in trending markets but underperforms in ranging markets
- Signal conflicts: Multiple moving averages may generate contradictory signals
Strategy Optimization Directions
- Incorporate volatility indicators: Consider adding ATR or other volatility indicators for dynamic position sizing
- Add volume confirmation: Integrate volume analysis to improve signal reliability
- Optimize exit mechanism: Design more flexible stop-loss and take-profit strategies
- Add market environment filtering: Develop market state recognition module to use different parameters in different market conditions
- Implement adaptive parameters: Dynamically adjust moving average periods based on market characteristics
Summary
This is a well-structured moving average trading strategy with clear logic. By comprehensively utilizing moving averages of different periods combined with price position relationships, the strategy effectively captures market trend changes. While it has certain inherent risks such as lag and sideways market vulnerability, the strategy maintains practical value through reasonable parameter settings and signal filtering. Future improvements can focus on incorporating additional technical indicators and optimizing signal generation mechanisms to enhance strategy stability and reliability.
/*backtest
start: 2019-12-23 08:00:00
end: 2024-12-25 08:00:00
period: 1d
basePeriod: 1d
exchanges: [{"eid":"Futures_Binance","currency":"BTC_USDT"}]
*/

//@version=5
strategy("SMA 20/50/200 Strateji", overlay=true)

// SMA Periyotlarını, renklerini ve çizgi kalınlıklarını özelleştirme
sma20_period = input.int(20, title="SMA 20 Periyodu", minval=1)
sma50_period = input.int(50, title="SMA 50 Periyodu", minval=1)
sma200_period = input.int(200, title="SMA 200 Periyodu", minval=1)

sma20_color = input.color(color.blue, title="SMA 20 Rengi")
sma50_color = input.color(color.orange, title="SMA 50 Rengi")
sma200_color = input.color(color.red, title="SMA 200 Rengi")

sma20_width = input.int(2, title="SMA 20 Kalınlığı", minval=1, maxval=5)
sma50_width = input.int(2, title="SMA 50 Kalınlığı", minval=1, maxval=5)
sma200_width = input.int(2, title="SMA 200 Kalınlığı", minval=1, maxval=5)

// SMA Hesaplamaları
sma20 = ta.sma(close, sma20_period)
sma50 = ta.sma(close, sma50_period)
sma200 = ta.sma(close, sma200_period)

// Al ve Sat Koşulları
buyCondition = ta.crossover(sma20, sma50) and close > sma200
sellCondition = ta.crossunder(sma20, sma50) and close < sma200

buyCondition_50_200 = ta.crossover(sma50, sma200)
sellCondition_50_200 = ta.crossunder(sma50, sma200)

// Grafik üzerine SMA çizimleri
plot(sma20, color=sma20_color, linewidth=sma20_width, title="SMA 20")
plot(sma50, color=sma50_color, linewidth=sma50_width, title="SMA 50")
plot(sma200, color=sma200_color, linewidth=sma200_width, title="SMA 200")

// Al-Sat Stratejisi
if buyCondition
    strategy.entry("Buy", strategy.long)
    label.new(bar_index, low, "BUY", style=label.style_label_up, color=color.new(color.green, 0), textcolor=color.white)

if sellCondition
    strategy.close("Buy")
    label.new(bar_index, high, "SELL", style=label.style_label_down, color=color.new(color.red, 0), textcolor=color.white)

if buyCondition_50_200
    label.new(bar_index, low, "50/200 BUY", style=label.style_label_up, color=color.new(color.blue, 0), textcolor=color.white)

if sellCondition_50_200
    label.new(bar_index, high, "50/200 SELL", style=label.style_label_down, color=color.new(color.orange, 0), textcolor=color.white)

// Performans Görselleştirmesi İçin Arka Plan Rengi
bgColor = buyCondition ? color.new(color.green, 90) : sellCondition ? color.new(color.red, 90) : na
bgcolor(bgColor)