Overview
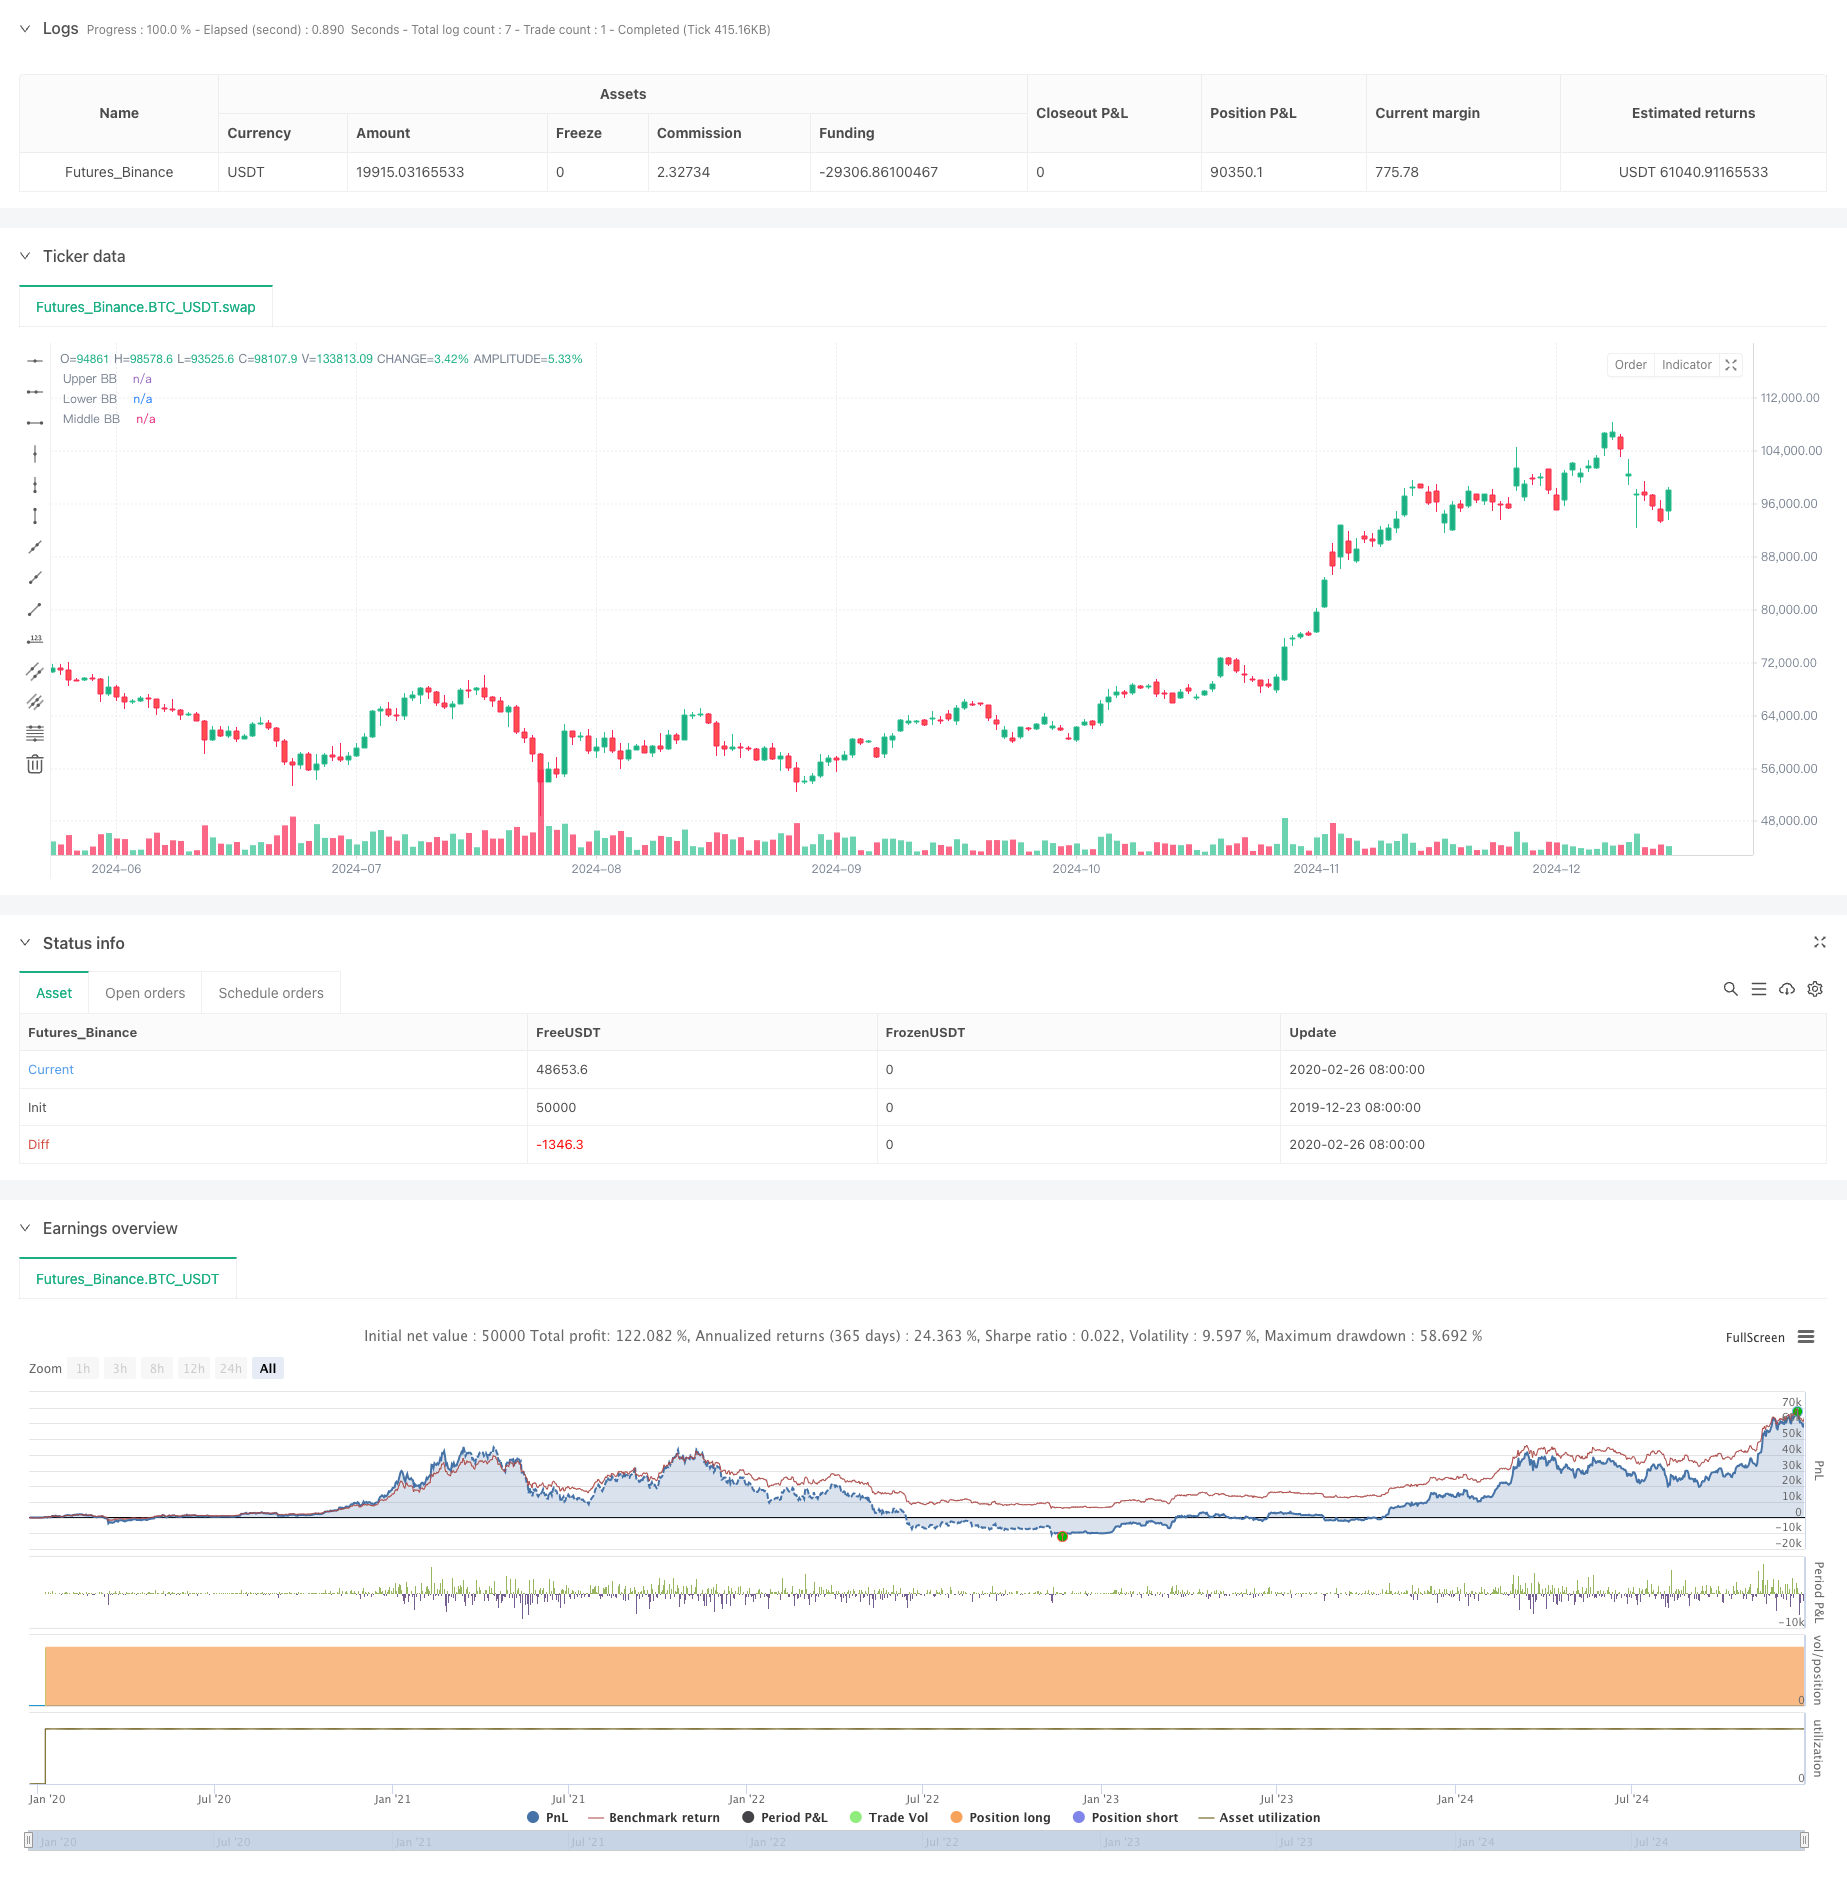
This strategy is a multi-level quantitative trading system based on Bollinger Bands trend divergence and dynamic bandwidth changes. The strategy constructs a complete trading decision framework by monitoring Bollinger Bands width dynamics, price breakouts, and EMA200 coordination. It employs an adaptive volatility tracking mechanism to effectively capture market trend turning points.
Strategy Principles
The strategy is based on the following key elements: 1. Bollinger Bands calculation using 20-period moving average and 2 standard deviations 2. Trend strength determination through bandwidth changes across three consecutive time points 3. Breakout validation using candle body to bandwidth ratio 4. EMA200 as a medium-long term trend filter 5. Long entry when price breaks above upper band with expanding bandwidth conditions 6. Exit when price breaks below lower band with contracting bandwidth conditions
Strategy Advantages
- Forward-looking signal system that identifies potential trend turning points
- Multiple technical indicator cross-validation reduces false signals
- Bandwidth change rate indicator adapts well to market volatility
- Clear entry and exit logic, easy to implement programmatically
- Comprehensive risk control mechanisms effectively control drawdowns
Strategy Risks
- May generate frequent trades in ranging markets
- Potential lag during sudden trend changes
- Parameter optimization faces overfitting risk
- Slippage risk during high market volatility periods
- Requires constant monitoring of bandwidth indicator effectiveness
Strategy Optimization Directions
- Introduce adaptive parameter optimization mechanisms
- Add volume and other auxiliary indicators for validation
- Optimize stop-loss and take-profit conditions
- Improve quantitative standards for trend strength assessment
- Incorporate additional market environment filters
Summary
The strategy builds a robust trading system through Bollinger Bands trend divergence and dynamic bandwidth changes. While performing excellently in trending markets, improvements are needed for ranging markets and parameter optimization. Overall, the strategy demonstrates good practical value and room for expansion.
/*backtest
start: 2019-12-23 08:00:00
end: 2024-12-25 08:00:00
period: 1d
basePeriod: 1d
exchanges: [{"eid":"Futures_Binance","currency":"BTC_USDT"}]
*/

//@version=6
strategy("BBDIV_Strategy", overlay=true)

// Inputs for Bollinger Bands
length = input.int(20, title="BB Length")
mult = input.float(2.0, title="BB Multiplier")

// Calculate Bollinger Bands
basis = ta.sma(close, length)
deviation = mult * ta.stdev(close, length)
upperBB = basis + deviation
lowerBB = basis - deviation

// Calculate Bollinger Band width
bb_width = upperBB - lowerBB
prev_width = ta.valuewhen(not na(bb_width[1]), bb_width[1], 0)
prev_prev_width = ta.valuewhen(not na(bb_width[2]), bb_width[2], 0)

// Determine BB state
bb_state = bb_width > prev_width and prev_width > prev_prev_width ? 1 : bb_width < prev_width and prev_width < prev_prev_width ? -1 : 0

// Assign colors based on BB state
bb_color = bb_state == 1 ? color.green : bb_state == -1 ? color.red : color.gray

// Highlight candles closed outside BB
candle_size = high - low
highlight_color = (candle_size > bb_width / 2 and close > upperBB) ? color.new(color.green, 50) : (candle_size > bb_width / 2 and close < lowerBB) ? color.new(color.red, 50) : na

bgcolor(highlight_color, title="Highlight Candles")

// Plot Bollinger Bands
plot(upperBB, title="Upper BB", color=bb_color, linewidth=2, style=plot.style_line)
plot(lowerBB, title="Lower BB", color=bb_color, linewidth=2, style=plot.style_line)
plot(basis, title="Middle BB", color=color.blue, linewidth=1, style=plot.style_line)

// Calculate EMA 200
ema200 = ta.ema(close, 200)

// Plot EMA 200
plot(ema200, title="EMA 200", color=color.orange, linewidth=2, style=plot.style_line)

// Strategy logic
enter_long = highlight_color == color.new(color.green, 50)
exit_long = highlight_color == color.new(color.red, 50)

if (enter_long)
    strategy.entry("Buy", strategy.long)

if (exit_long)
    strategy.close("Buy")

// Display profit at close
if (exit_long)
    var float entry_price = na
    var float close_price = na
    var float profit = na

    if (strategy.opentrades > 0)
        entry_price := strategy.opentrades.entry_price(strategy.opentrades - 1)
        close_price := close
        profit := (close_price - entry_price) * 100 / entry_price * 2 * 10 // Assuming 1 pip = 0.01 for XAUUSD
        label.new(bar_index, high + (candle_size * 2), str.tostring(profit, format.mintick) + " USD", style=label.style_label_up, color=color.green)