Overview
This strategy is a quantitative trading system that combines multiple technical indicators, primarily using EMA for trend identification, MACD for momentum detection, and RSI for overbought/oversold conditions. This multi-indicator approach effectively filters out false signals and improves trading accuracy.
Strategy Principles
The core logic includes several key components: 1. Trend Identification: Uses 50-period and 200-period EMAs, confirming uptrend when short-term EMA is above long-term EMA 2. Entry Signals: Under confirmed uptrend conditions, requires MACD below zero with upward reversal pattern 3. Exit Signals: Uses RSI overbought zone (70) downward breakout for profit-taking 4. Stop Loss: Triggers when short-term EMA crosses below long-term EMA for risk control
Strategy Advantages
- Complementary Indicators: Combines trend (EMA), momentum (MACD), and oscillator (RSI) indicators for multi-dimensional signal confirmation
- Robust Risk Control: Implements clear stop-loss conditions for effective downside risk management
- Trend Following Characteristics: Designed to capture strong upward trends for significant trend-based returns
- High Signal Reliability: Multiple conditions required for entry reduce false signals
Strategy Risks
- Lag Risk: Moving average systems have inherent lag, potentially causing delayed entry or exit
- Consolidation Market Risk: May generate frequent false signals in range-bound markets
- Parameter Sensitivity: Strategy performance is sensitive to parameter settings, requiring adjustment for different market conditions
- Trend Dependency: May underperform in non-trending markets
Optimization Directions
- Parameter Adaptation: Consider implementing automatic parameter adjustment based on market volatility
- Signal Confirmation: Add volume analysis for additional signal validation
- Position Management: Introduce dynamic position sizing based on signal strength and market volatility
- Market Environment Recognition: Develop market condition identification module for parameter optimization
Summary
This strategy creates a comprehensive trading system through the synergy of multiple technical indicators. Its strengths lie in high signal reliability and robust risk control, though it faces challenges with lag and parameter sensitivity. Through suggested optimizations, particularly adaptive parameters and dynamic position management, the strategy’s stability and profitability can be enhanced. It is best suited for trending markets, and investors should adjust parameters according to specific market characteristics.
/*backtest
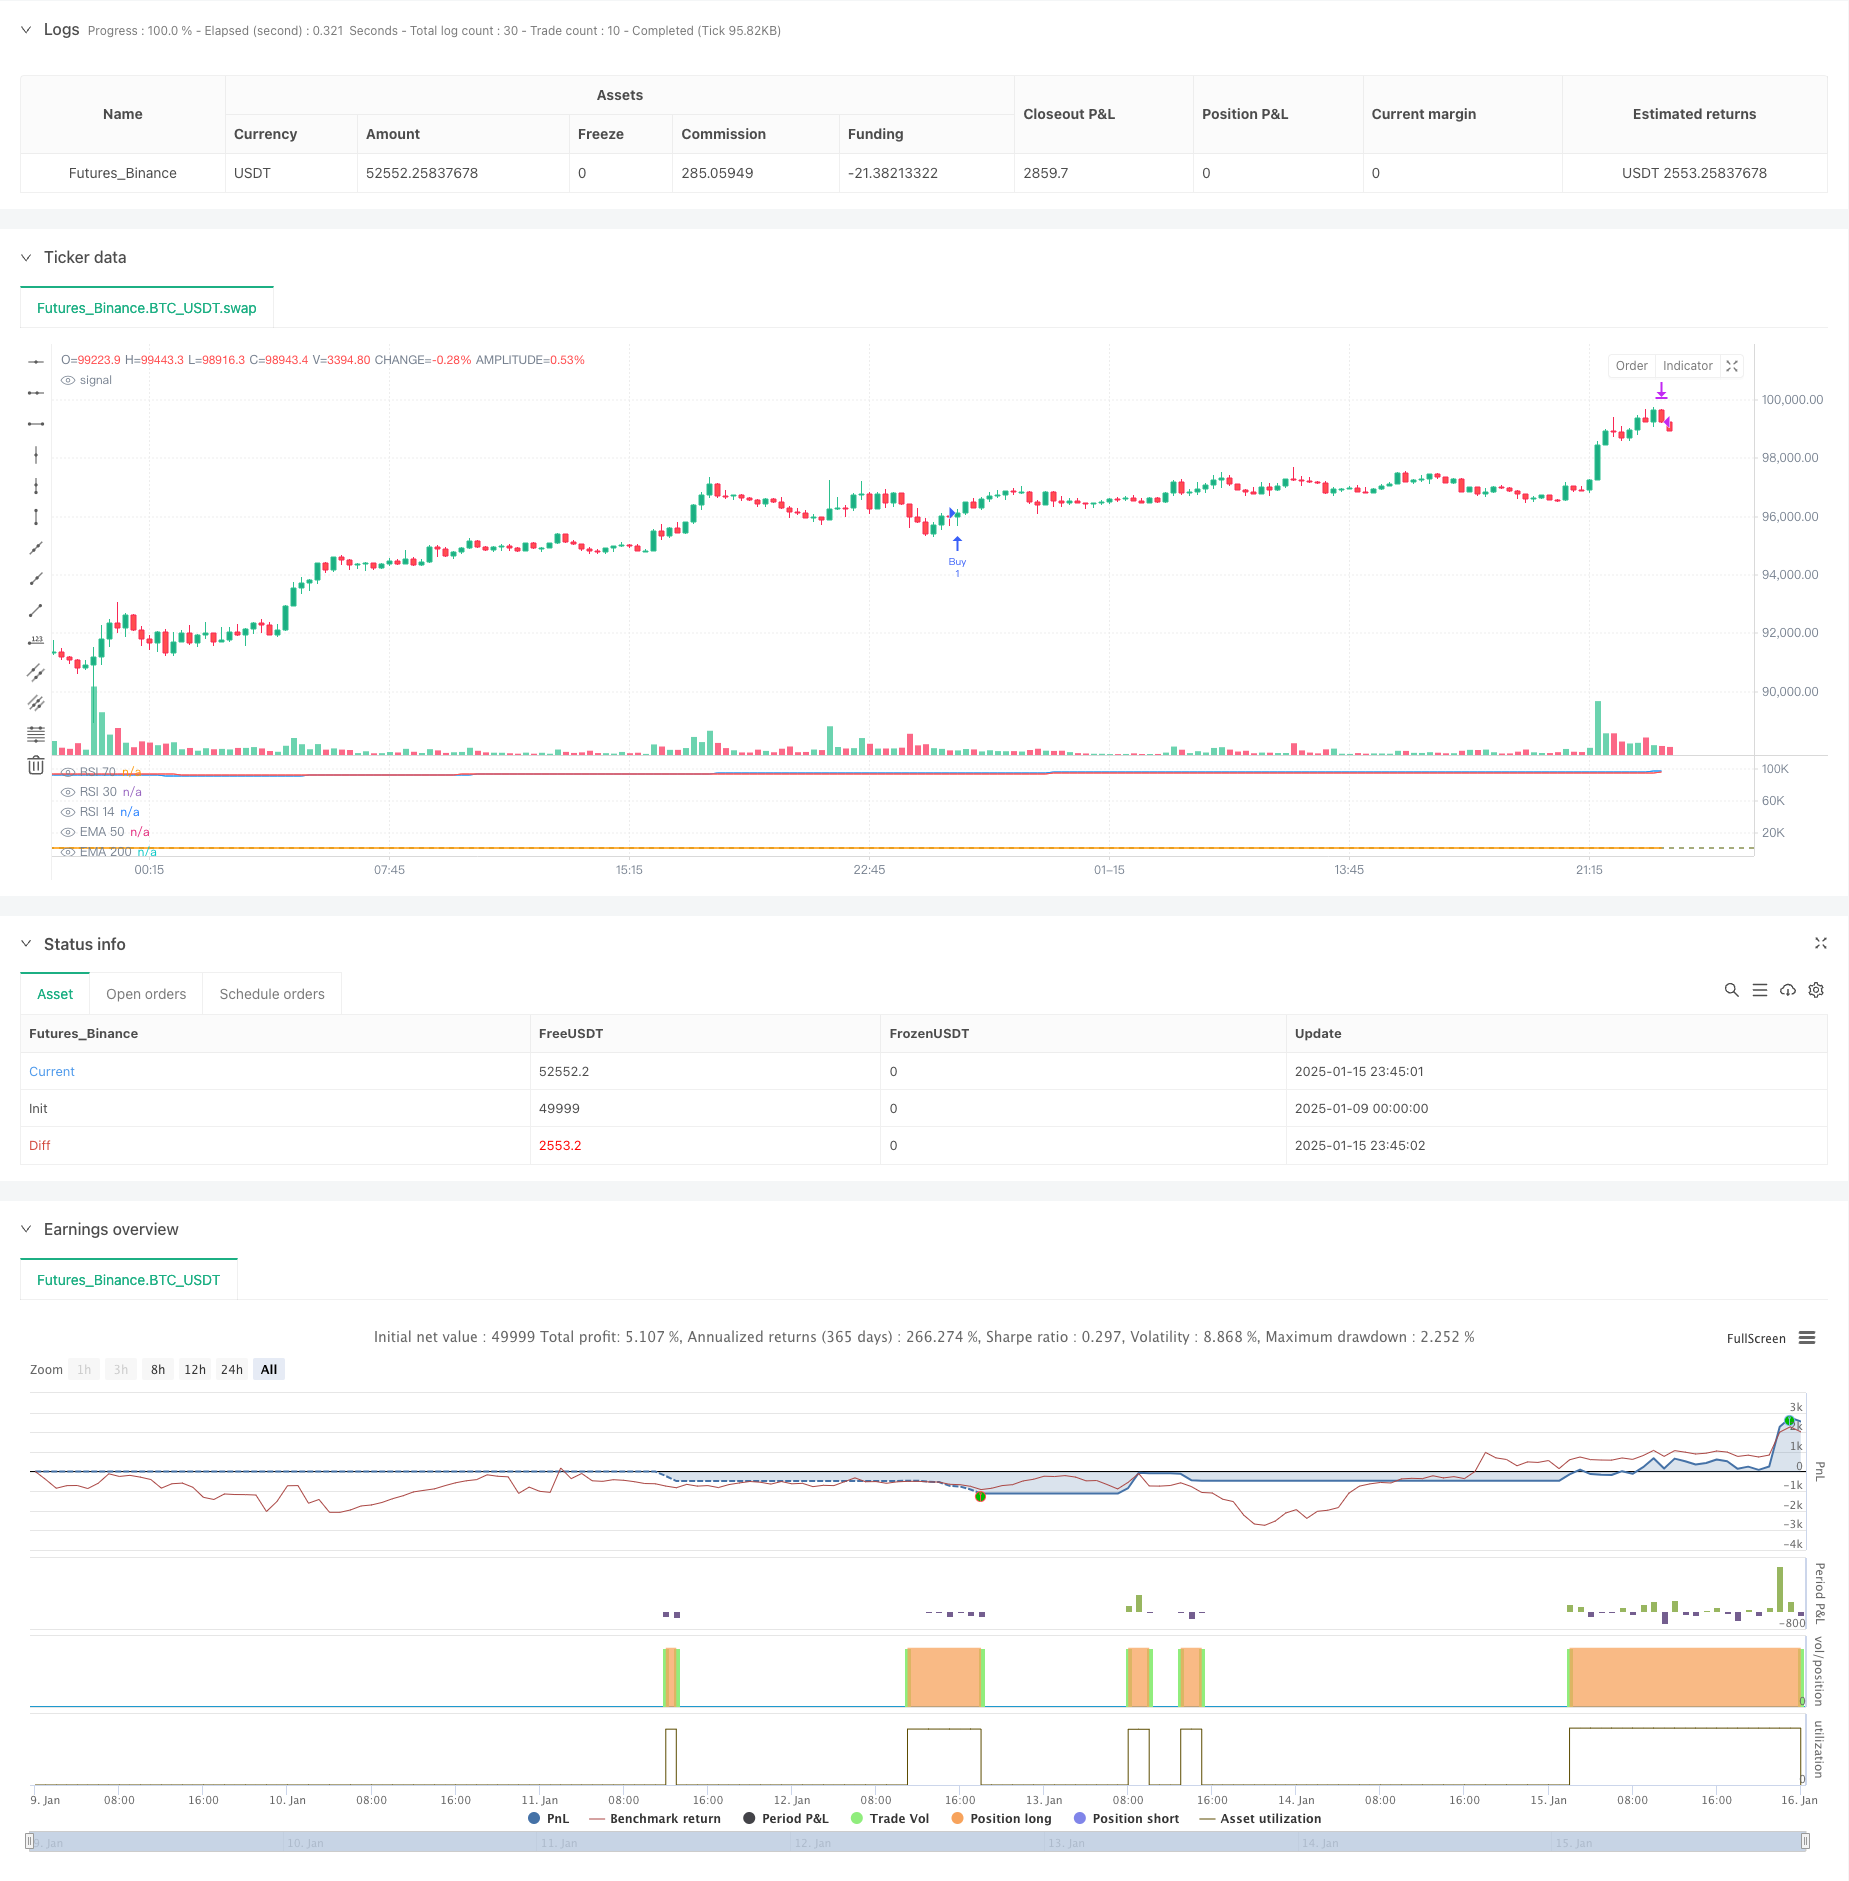
start: 2025-01-09 00:00:00
end: 2025-01-16 00:00:00
period: 15m
basePeriod: 15m
exchanges: [{"eid":"Futures_Binance","currency":"BTC_USDT","balance":49999}]
*/
//@version=5
strategy("RSI ve EMA Tabanlı Alım-Satım Stratejisi", overlay=false)
// EMA Hesaplamaları
ema_short = ta.ema(close, 50) // EMA 50
ema_long = ta.ema(close, 200) // EMA 200
// MACD Hesaplamaları
[macd, signal, _] = ta.macd(close, 12, 26, 9)
// RSI Hesaplamaları
rsi = ta.rsi(close, 14)
// Alım Sinyali Koşulları
macd_condition = (macd < 0) and (macd > nz(macd[1])) and (nz(macd[1]) < nz(macd[2]))
buy_signal = (ema_short > ema_long) and macd_condition
// Satım Sinyali Koşulları
sell_signal = (rsi[1] > 70) and (rsi <= 70) // RSI 70'i yukarıdan aşağıya kırdı
// Stop Loss Koşulu
stop_loss = ema_short < ema_long
// İşlem ve Etiketler
if buy_signal
strategy.entry("Buy", strategy.long)
label.new(bar_index, high, "AL", style=label.style_label_up, color=color.green, textcolor=color.white)
if sell_signal
strategy.close("Buy", comment="SAT")
label.new(bar_index, high, "SAT", style=label.style_label_down, color=color.red, textcolor=color.white)
if stop_loss
strategy.close("Buy", comment="STOP LOSS")
label.new(bar_index, low, "STOP LOSS", style=label.style_label_down, color=color.orange, textcolor=color.white)
// Grafik Üzerine Çizgiler ve Göstergeler
plot(ema_short, color=color.blue, title="EMA 50")
plot(ema_long, color=color.red, title="EMA 200")
plot(rsi, color=color.orange, title="RSI 14")
hline(70, "RSI 70", color=color.red)
hline(30, "RSI 30", color=color.green)