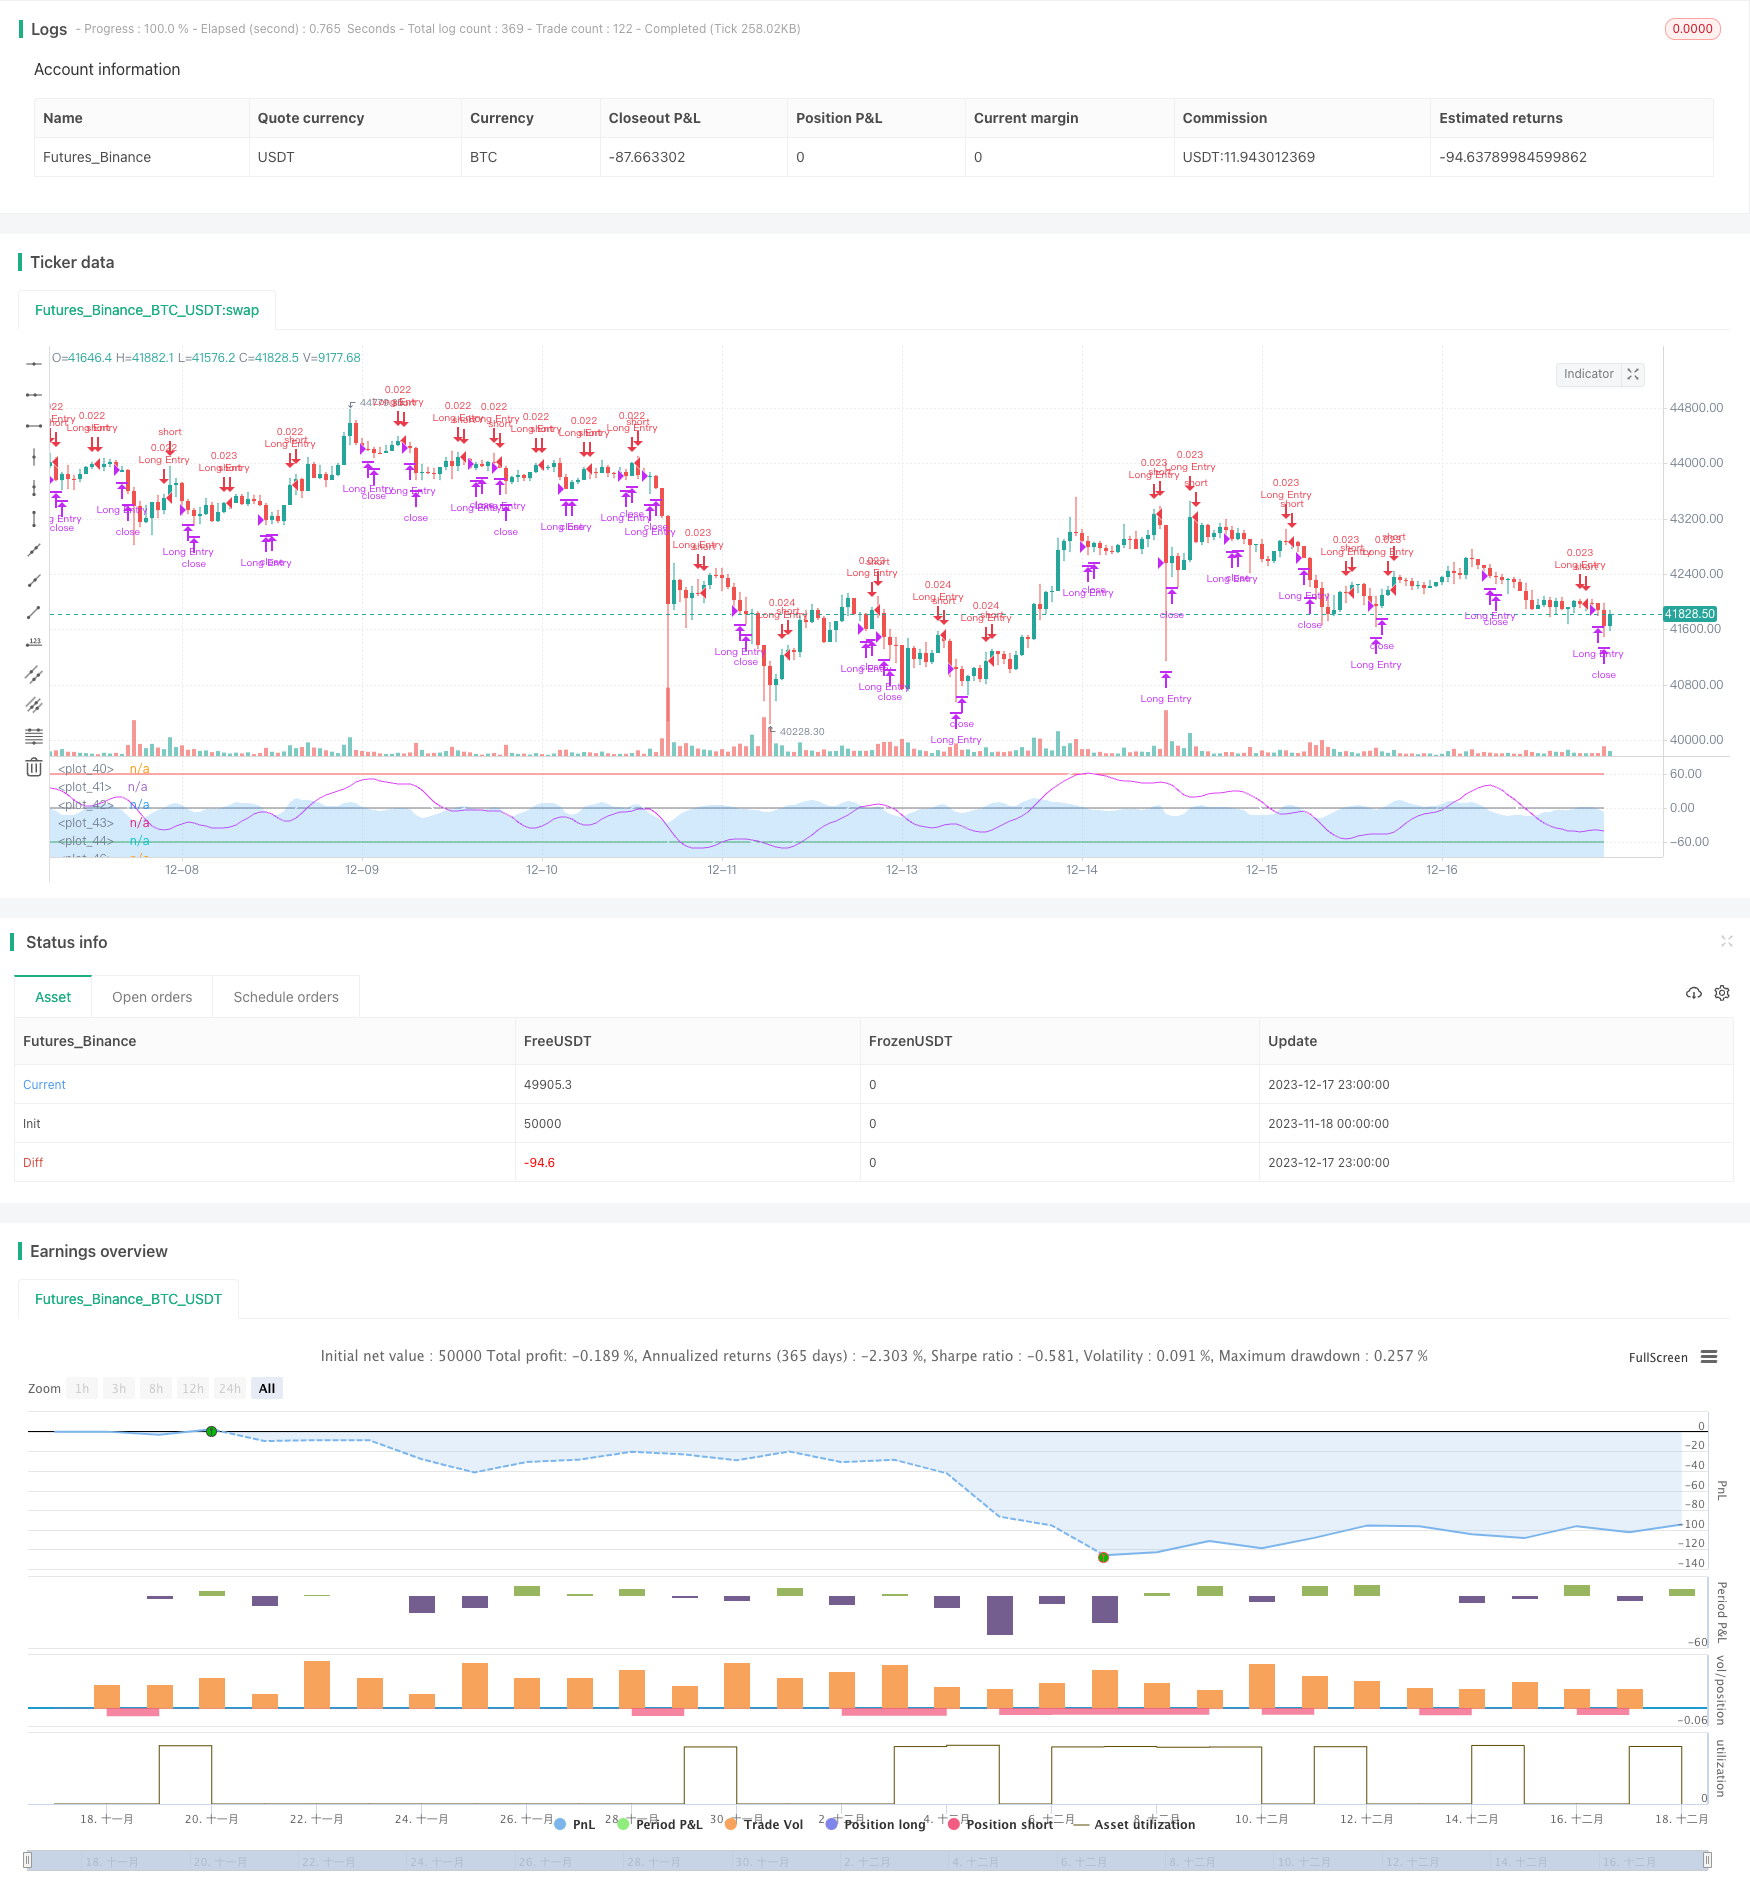
Estrategias comerciales basadas en tendencias de ondas

Descripción general
Esta es una estrategia de negociación basada en el indicador de tendencias de ondas de LazyBear. La estrategia determina la situación de sobrecompra y sobreventa en el mercado mediante el cálculo de tendencias de ondas de fluctuación de precios, y realiza longings y shortings.
Principio de estrategia
La estrategia se basa principalmente en el indicador de tendencia de ondas de LazyBear. Primero se calcula el precio promedio de los precios (AP), luego se calcula el promedio móvil indexado de los precios (AP) y el promedio móvil indexado de los cambios absolutos en los precios (D). Sobre esta base se calcula el índice de oscilación (CI), luego se calcula el promedio móvil indexado de CI, obteniendo la línea de tendencia de las ondas (WT).
Análisis de las ventajas
Es una estrategia de seguimiento de tendencias muy simple pero muy práctica. Tiene las siguientes ventajas:
- Indicadores de tendencia de ondas para identificar claramente las tendencias de precios y el sentimiento del mercado
- El cruce de oro y el cruce de la muerte de WT para determinar el punto de ventaja y de desventaja, el funcionamiento es simple
- Parámetros personalizados para ajustar la sensibilidad de los cables WT para adaptarse a diferentes períodos
- Se pueden agregar más señales de filtración condicional, como ventanas de tiempo de negociación limitadas
Análisis de riesgos
La estrategia también tiene sus riesgos:
- Como estrategia de seguimiento de tendencias, es fácil generar una gran cantidad de señales erróneas en el mercado de liquidación.
- La línea WT en sí misma es muy retrasada y puede haber perdido el punto de inflexión rápido de los precios.
- Los parámetros por defecto pueden no ser adecuados para todas las variedades y ciclos, y necesitan ser optimizados
- No hay un mecanismo de detención de pérdidas, por lo que el tiempo de tenencia de una sola dirección puede ser demasiado largo.
Las principales soluciones son:
- Optimización de parámetros para ajustar la sensibilidad de las líneas WT
- Añadir otros indicadores para verificar y evitar señales falsas
- Configuración de la parada de pérdidas y paradas
- Limitar el número de operaciones o posiciones por día
Dirección de optimización
La estrategia tiene espacio para ser optimizada aún más:
- Optimizar los parámetros de WT para que sea más sensible o más estable
- Combinaciones de parámetros diferentes basadas en diferentes períodos
- Añadir indicadores de precio de volumen, indicadores de fluctuación, etc. como señales de confirmación
- Añadir la lógica de stop loss y stop stop
- Enriquecimiento de la posición, como por ejemplo, la pirámide de la adición de depósitos, la red de transacciones, etc.
- Combinando métodos como el aprendizaje automático para extraer mejores características y reglas de negociación
Resumir
Esta estrategia es una estrategia de seguimiento de tendencias de ondas muy sencilla y práctica. Emite una señal de negociación mediante el cálculo de la tendencia de fluctuación de los precios, la identificación del estado de sobrecompra y sobreventa en el mercado, y el uso de la cruz de oro y la cruz de muerte en la línea WT. La estrategia es simple de operar y fácil de implementar.
/*backtest
start: 2023-11-18 00:00:00
end: 2023-12-18 00:00:00
period: 1h
basePeriod: 15m
exchanges: [{"eid":"Futures_Binance","currency":"BTC_USDT"}]
*/

//
// @author LazyBear
//
// If you use this code in its original/modified form, do drop me a note.
//
//@version=4

// === INPUT BACKTEST RANGE ===
fromMonth = input(defval = 1,    title = "From Month",      type = input.integer, minval = 1, maxval = 12)
fromDay   = input(defval = 1,    title = "From Day",        type = input.integer, minval = 1, maxval = 31)
fromYear  = input(defval = 2021, title = "From Year",       type = input.integer, minval = 1970)
thruMonth = input(defval = 1,    title = "Thru Month",      type = input.integer, minval = 1, maxval = 12)
thruDay   = input(defval = 1,    title = "Thru Day",        type = input.integer, minval = 1, maxval = 31)
thruYear  = input(defval = 2112, title = "Thru Year",       type = input.integer, minval = 1970)

// === INPUT SHOW PLOT ===
showDate  = input(defval = true, title = "Show Date Range", type = input.bool)

// === FUNCTION EXAMPLE ===
start     = timestamp(fromYear, fromMonth, fromDay, 00, 00)        // backtest start window
finish    = timestamp(thruYear, thruMonth, thruDay, 23, 59)        // backtest finish window
window()  => true       // create function "within window of time"

n1 = input(10, "Channel Length")
n2 = input(21, "Average Length")
obLevel1 = input(60, "Over Bought Level 1")
obLevel2 = input(53, "Over Bought Level 2")
osLevel1 = input(-60, "Over Sold Level 1")
osLevel2 = input(-53, "Over Sold Level 2")

ap = hlc3
esa = ema(ap, n1)
d = ema(abs(ap - esa), n1)
ci = (ap - esa) / (0.015 * d)
tci = ema(ci, n2)

wt1 = tci
wt2 = sma(wt1,4)

plot(0, color=color.gray)
plot(obLevel1, color=color.red)
plot(osLevel1, color=color.green)
plot(obLevel2, color=color.red, style=3)
plot(osLevel2, color=color.green, style=3)

plot(wt1, color=color.white)
plot(wt2, color=color.fuchsia)
plot(wt1-wt2, color=color.new(color.blue, 80), style=plot.style_area)

//Strategy
strategy(title="T!M - Wave Trend Strategy", overlay = false, precision = 8, max_bars_back = 200, pyramiding = 0, initial_capital = 1000, currency = currency.NONE, default_qty_type = strategy.cash, default_qty_value = 1000, commission_type = "percent", commission_value = 0.1, calc_on_every_tick=false, process_orders_on_close=true)

longCondition  = crossover(wt1, wt2)
shortCondition = crossunder(wt1, wt2)

strategy.entry(id="Long Entry", comment="buy", long=true, when=longCondition and window())
strategy.close("Long Entry", comment="sell", when=shortCondition and window())

//strategy.entry(id="Short Entry", long=false, when=shortCondition)