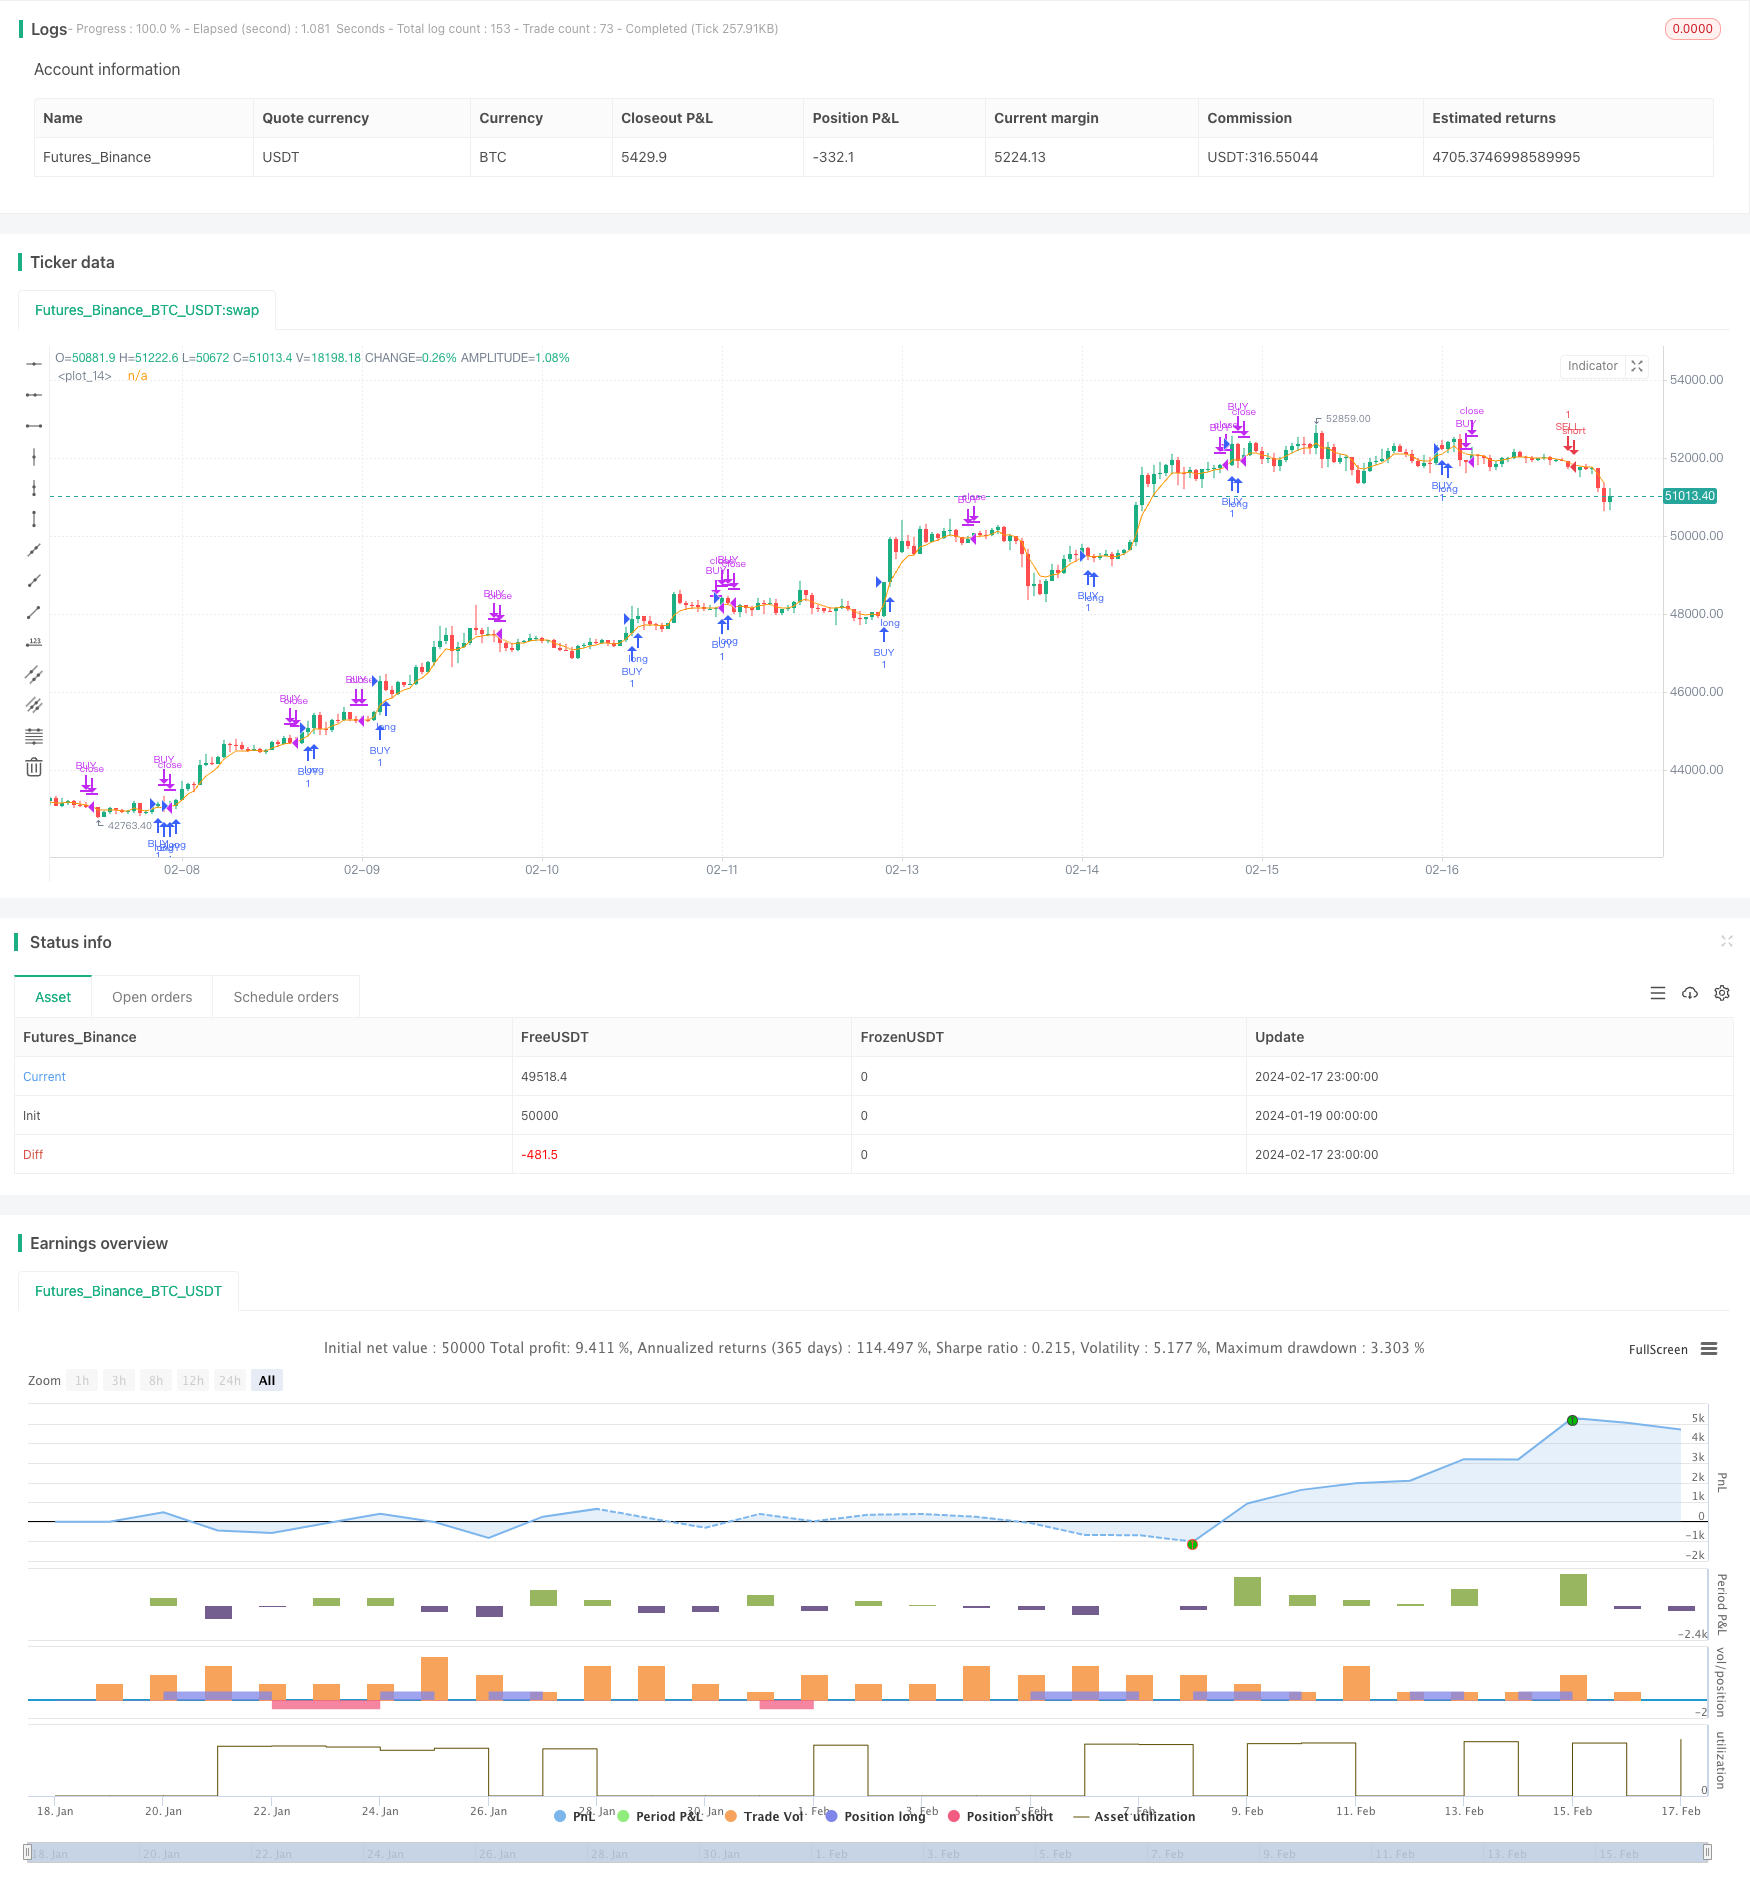
Estrategia de negociación cruzada de promedio móvil de impulso
El autor:¿ Qué pasa?, Fecha: 2024-02-19 14:53:50Las etiquetas:

Resumen general
Esta estrategia genera señales comerciales basadas en el indicador MACD. El indicador MACD consta de tres líneas: la línea MACD, la línea SIGNAL y la línea del histograma (HISTO). Cuando la línea MACD cruza por encima de la línea SIGNAL y se vuelve positiva, genera una señal de compra. Cuando la línea MACD cruza por debajo de la línea SIGNAL y se vuelve negativa, genera una señal de venta.
Estrategia lógica
- Calcule la línea MACD, la línea SIGNAL y la línea HISTO.
- Identificar los puntos de cruce entre la línea MACD y la línea SIGNAL para determinar las señales de compra y venta.
- Utilice una EMA de 34 períodos como zona de soporte/resistencia, vaya largo solo por encima de la EMA y vaya corto solo por debajo de la EMA.
- Establezca el stop loss y tome ganancias para bloquear las ganancias.
Específicamente, cuando el precio de cierre cruza por encima de la EMA de 34 períodos y la línea MACD cruza por encima de la línea SIGNAL en territorio positivo, indica un fuerte impulso al alza, por lo que compramos.
Ventajas
- El indicador MACD identifica con precisión los cambios en la acción del precio con señales claras.
- La combinación con el filtro EMA evita señales falsas de compra/venta.
- Detener pérdidas y tomar controles de ganancias por pérdida comercial.
Riesgos y soluciones
- Las señales MACD se retrasan en la acción del precio y pueden perder los mejores puntos de entrada / salida.
- Indicador único propenso a generar señales falsas, puede añadir otros indicadores como KDJ para filtración.
- No hay límite en el número de operaciones, puede llevar a un exceso de operaciones.
Oportunidades de mejora
- Optimizar los parámetros MACD para encontrar la mejor combinación de parámetros.
- Añadir otros juicios de indicadores para evitar señales falsas, por ejemplo, combinaciones MACD+KDJ, MACD+BOLL.
- Implementar límites de frecuencia de las operaciones para evitar el exceso de operaciones.
- Optimizar la estrategia stop loss/take profit para mejorar la relación riesgo/beneficio.
Conclusión
Esta estrategia identifica las oportunidades de negociación utilizando el indicador MACD y filtra las señales utilizando una EMA de 34 períodos. Permite entradas oportunas cuando comienzan nuevas tendencias de precios mientras controla el riesgo a través de stop loss / take profit. La estrategia se puede refinar aún más a través de la optimización de parámetros, la adición de otros indicadores, etc. para mejorar la rentabilidad.
/*backtest
start: 2024-01-19 00:00:00
end: 2024-02-18 00:00:00
period: 1h
basePeriod: 15m
exchanges: [{"eid":"Futures_Binance","currency":"BTC_USDT"}]
*/

// This source code is subject to the terms of the Mozilla Public License 2.0 at https://mozilla.org/MPL/2.0/
// © melihtuna

//@version=2
strategy("Jim's MACD", overlay=true)

Tendies = input(true, title="Check here for tendies")

// === MACD Setup ===
[macdLine, signalLine, histLine] = macd(close, 12, 26, 9)

//EMA
ma = ema(close, 5)
plot(ema(close,5))


//Entry
if (close > ma and cross(macdLine,signalLine) and histLine> 0.4 and signalLine > 0 or histLine > 0 and signalLine > 0 )
    strategy.entry("BUY", strategy.long)
if(close < ma and cross(macdLine,signalLine) and histLine < -0.4 and signalLine < 0 or close < ma and histLine < 0 and signalLine < 0 )
    strategy.entry("SELL", strategy.short)

//Exit
strategy.close("BUY", when = histLine < 0  )
strategy.close("SELL", when = histLine > 0  )
- Estrategia de negociación del oscilador de la nube Ichimoku
- Estrategia de red DCA de inversión media de doble fondo
- Assassin's Grid B
Una estrategia de negociación dinámica de la red - Estrategia de cruce de promedio móvil de varios marcos de tiempo
- Estrategia de negociación cuantitativa de media móvil exponencial con retraso cero adaptativa
- Estrategia de los ladrillos de impulso
- Estrategia de negociación de inversión de ruptura de volatilidad
- Estrategia de negociación de patrones de velas
- Estrategia de negociación en pivote de supertendencia filtrada por ADX
- Estrategia de inversión de la media móvil de impulso
- Estrategia de sinergia de la tendencia de impulso
- Robot de negociación racional impulsado por la estrategia RSI
- La estrategia de detención del oscilador de momento dinámico
- Estrategia de negociación de Bugra basada en una media móvil cinética dual
- Estrategia de negociación cuantitativa basada en fractales y patrones
- Estrategia CAT de fluctuación de reversión
- Estrategia de negociación de VWAP en el canal de precios
- Estrategia de cruce de la media móvil entrelazada
- La estrategia de ruptura de la media móvil y la estrategia de ruptura de la banda de Bollinger
- Estrategia del indicador de impulso absoluto