Descripción general
La idea principal de la estrategia es buscar una línea de K de opinión que no tenga un guión superior como señal de compra y cerrar la posición cuando el precio cae por debajo de la línea de K anterior. La estrategia aprovecha la característica de que la línea de K de opinión es pequeña, lo que indica que las fuerzas multilaterales son fuertes y la probabilidad de que el precio de las acciones continúe subiendo es alta.
Principio de estrategia
- Determine si la línea K actual es la línea K de la bolsa (el precio de cierre es más alto que el precio de apertura)
- Calcula la proporción de la longitud del guión en la línea K actual a la longitud de la entidad de la línea K
- Si la proporción de referencia superior es inferior al 5%, se considera que es válida la línea K sin referencia superior y se emite una señal de compra
- Registra el precio mínimo de la línea K anterior a la compra como punto de parada
- Cuando el precio cae por debajo de los límites de pérdidas, se retira de la posición.
Ventajas estratégicas
- La línea de entrada K de los pronósticos sin guía superior es más fuerte y tiene una mayor tasa de éxito
- El riesgo es controlado utilizando el punto bajo anterior de la línea K como punto de parada.
- La lógica es simple, fácil de implementar y optimizar
- Adecuado para uso en situaciones de tendencia
Riesgo estratégico
- Es posible que se produzca una retirada inmediata de la señal de compra que desencadene el stop loss
- Para variedades con alta volatilidad, el stop loss puede estar demasiado cerca del precio de compra, lo que lleva a un stop loss prematuro.
- La falta de objetivos de ganancias hace que sea difícil saber cuándo es el mejor momento para cerrar una posición.
Dirección de optimización de la estrategia
- Se puede combinar con otros indicadores como MA, MACD, etc., para confirmar la fuerza de la tendencia y mejorar la eficacia de la señal de entrada
- Para variedades de alta volatilidad, el punto de parada se puede establecer en una posición más lejana, como el punto más bajo de la línea K de la raíz N anterior, para reducir la frecuencia de parada
- Introducir objetivos de ganancias, como N-ATR o porcentaje de ganancias, para bloquear las ganancias a tiempo
- Considere agregar administración de posiciones, como ajustar el tamaño de la posición según la intensidad de la señal, etc.
Resumir
La estrategia puede capturar ganancias de manera efectiva en el caso de una tendencia mediante la entrada en la línea K de los puntos de vista sin guía superior y el uso de la línea K anterior. Sin embargo, la estrategia también tiene ciertas limitaciones, como la posición de parada no es lo suficientemente flexible, la falta de objetivos de ganancias, etc. La estrategia puede ser mejorada mediante la introducción de señales de filtración de otros indicadores, la optimización de la posición de parada y la configuración de objetivos de ganancias, etc.
Overview
The main idea of this strategy is to find bullish candles without upper wicks as buy signals and close positions when the price breaks below the low of the previous candle. The strategy utilizes the characteristic of bullish candles with very small upper wicks, indicating strong bullish momentum and a higher probability of continued price increases. At the same time, using the low of the previous candle as a stop-loss level can effectively control risk.
Strategy Principles
- Determine if the current candle is a bullish candle (close price higher than open price)
- Calculate the ratio of the current candle’s upper wick length to its body length
- If the upper wick ratio is less than 5%, consider it a valid bullish candle without an upper wick and generate a buy signal
- Record the lowest price of the previous candle after buying as the stop-loss level
- When the price breaks below the stop-loss level, close the position and exit
Strategy Advantages
- Selecting bullish candles without upper wicks for entry, the trend strength is greater and the success rate is higher
- Using the low of the previous candle as the stop-loss level, risks are controllable
- Simple logic, easy to implement and optimize
- Suitable for use in trending markets
Strategy Risks
- There may be cases where a buy signal is followed by an immediate pullback triggering the stop-loss
- For highly volatile instruments, the stop-loss level may be set too close to the buy price, leading to premature stop-outs
- Lack of profit targets, making it difficult to grasp the optimal exit timing
Strategy Optimization Directions
- Combine with other indicators such as MA, MACD, etc., to confirm trend strength and improve the effectiveness of entry signals
- For highly volatile instruments, set the stop-loss level at a further position, such as the lowest point of the previous N candles, to reduce the stop-loss frequency
- Introduce profit targets, such as N times ATR or percentage gains, to lock in profits in a timely manner
- Consider adding position management, such as adjusting position size based on signal strength
Summary
This strategy captures profits effectively in trending markets by selecting bullish candles without upper wicks for entry and using the low of the previous candle for stop-loss. However, the strategy also has certain limitations, such as inflexible stop-loss placement and lack of profit targets. Improvements can be made by introducing other indicators to filter signals, optimizing stop-loss positions, and setting profit targets to make the strategy more robust and effective.
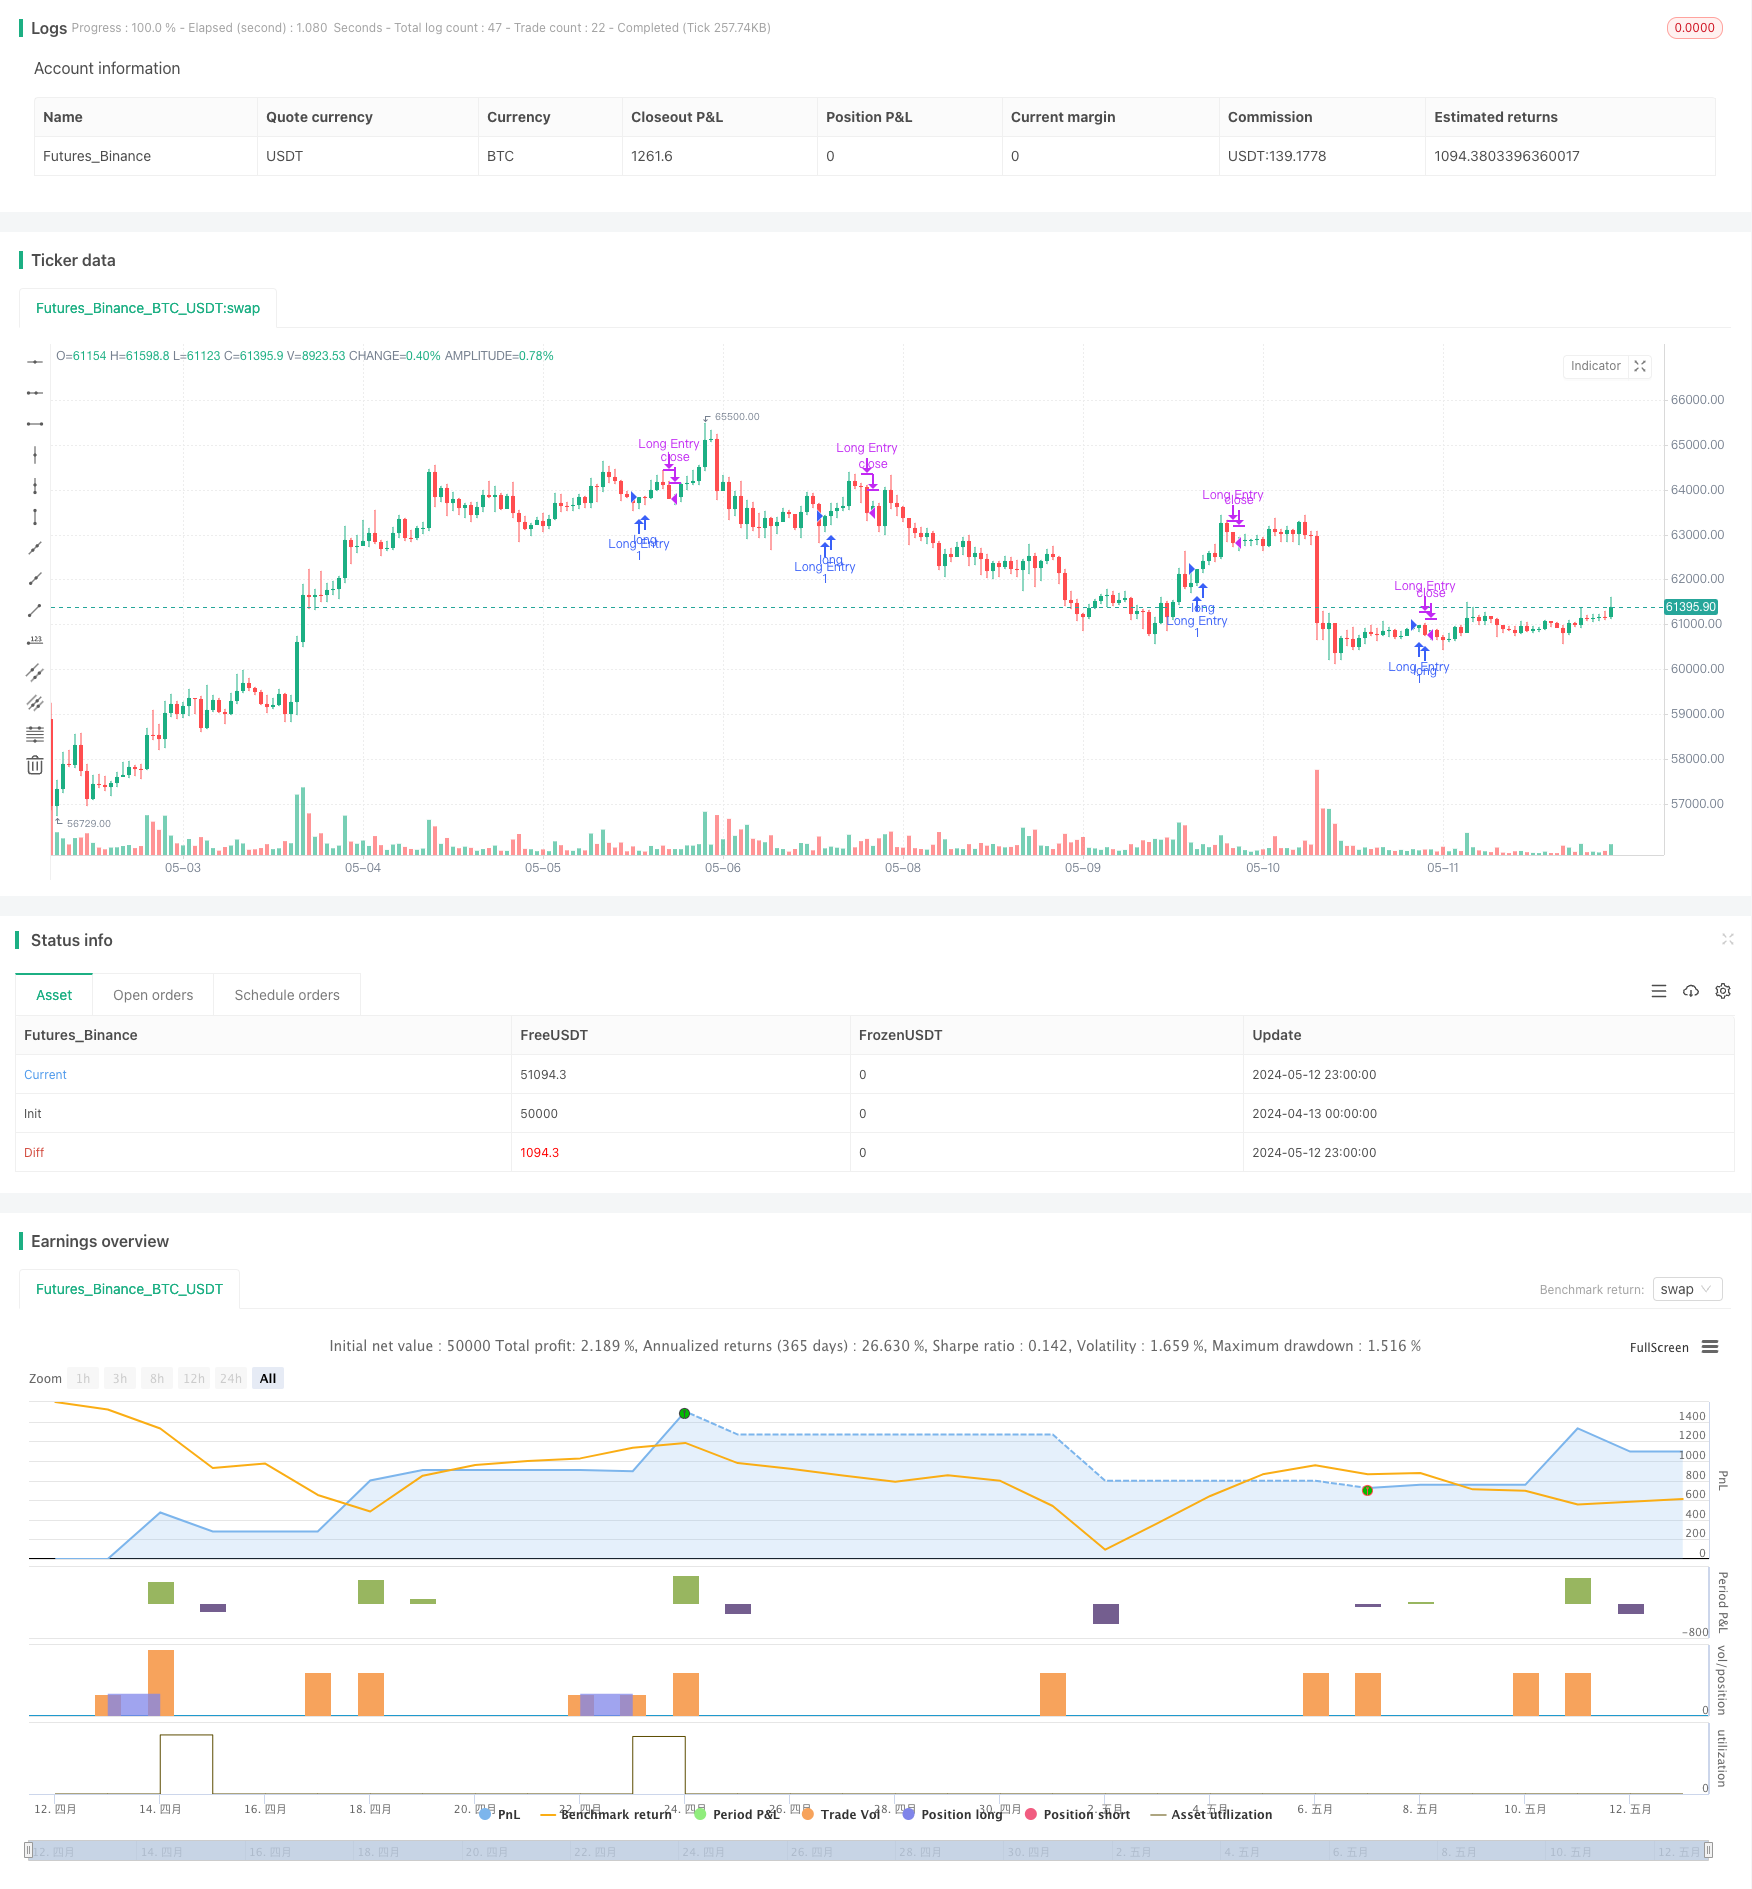
/*backtest
start: 2024-04-13 00:00:00
end: 2024-05-13 00:00:00
period: 1h
basePeriod: 15m
exchanges: [{"eid":"Futures_Binance","currency":"BTC_USDT"}]
*/

// This Pine Script™ code is subject to the terms of the Mozilla Public License 2.0 at https://mozilla.org/MPL/2.0/
// © nagpha

//@version=5
strategy("My strategy", overlay=true, margin_long=100, margin_short=100)

candleBodySize = math.abs(open - close)

// Calculate candle wick size
candleWickSize = high - close

// Calculate percentage of wick to candle body
wickPercentage = (candleWickSize / candleBodySize) * 100

// Check if candle is bullish and wick is less than 1% of the body
isBullish = close > open
isWickLessThan5Percent = wickPercentage < 5


longCondition = isBullish and isWickLessThan5Percent

if (longCondition)
    // log.info("long position taken")
    strategy.entry("Long Entry", strategy.long)

float prevLow = 0.0
prevLow := request.security(syminfo.tickerid, timeframe.period, low[1], lookahead=barmerge.lookahead_on)

float closingPrice = close
//plot(closingPrice, "Close Price", color.purple, 3)
//plot(prevLow, "Previous Low", color.red, 3)
//log.info("Outside: {0,number,#}",closingPrice)
//log.info("Outside: {0,number,#}",prevLow)

if closingPrice < prevLow and strategy.position_size > 0
    //log.info("inside close: {0,number} : {0,number}",closingPrice,prevLow)
    // log.info("position exited")
    strategy.close("Long Entry")
    longCondition := false
    prevLow := 0
    isBullish := false

//plot(series=strategy.position_size > 0 ? prevLow : na, color = color.new(#40ccfb,0), style=plot.style_cross,linewidth = 5)