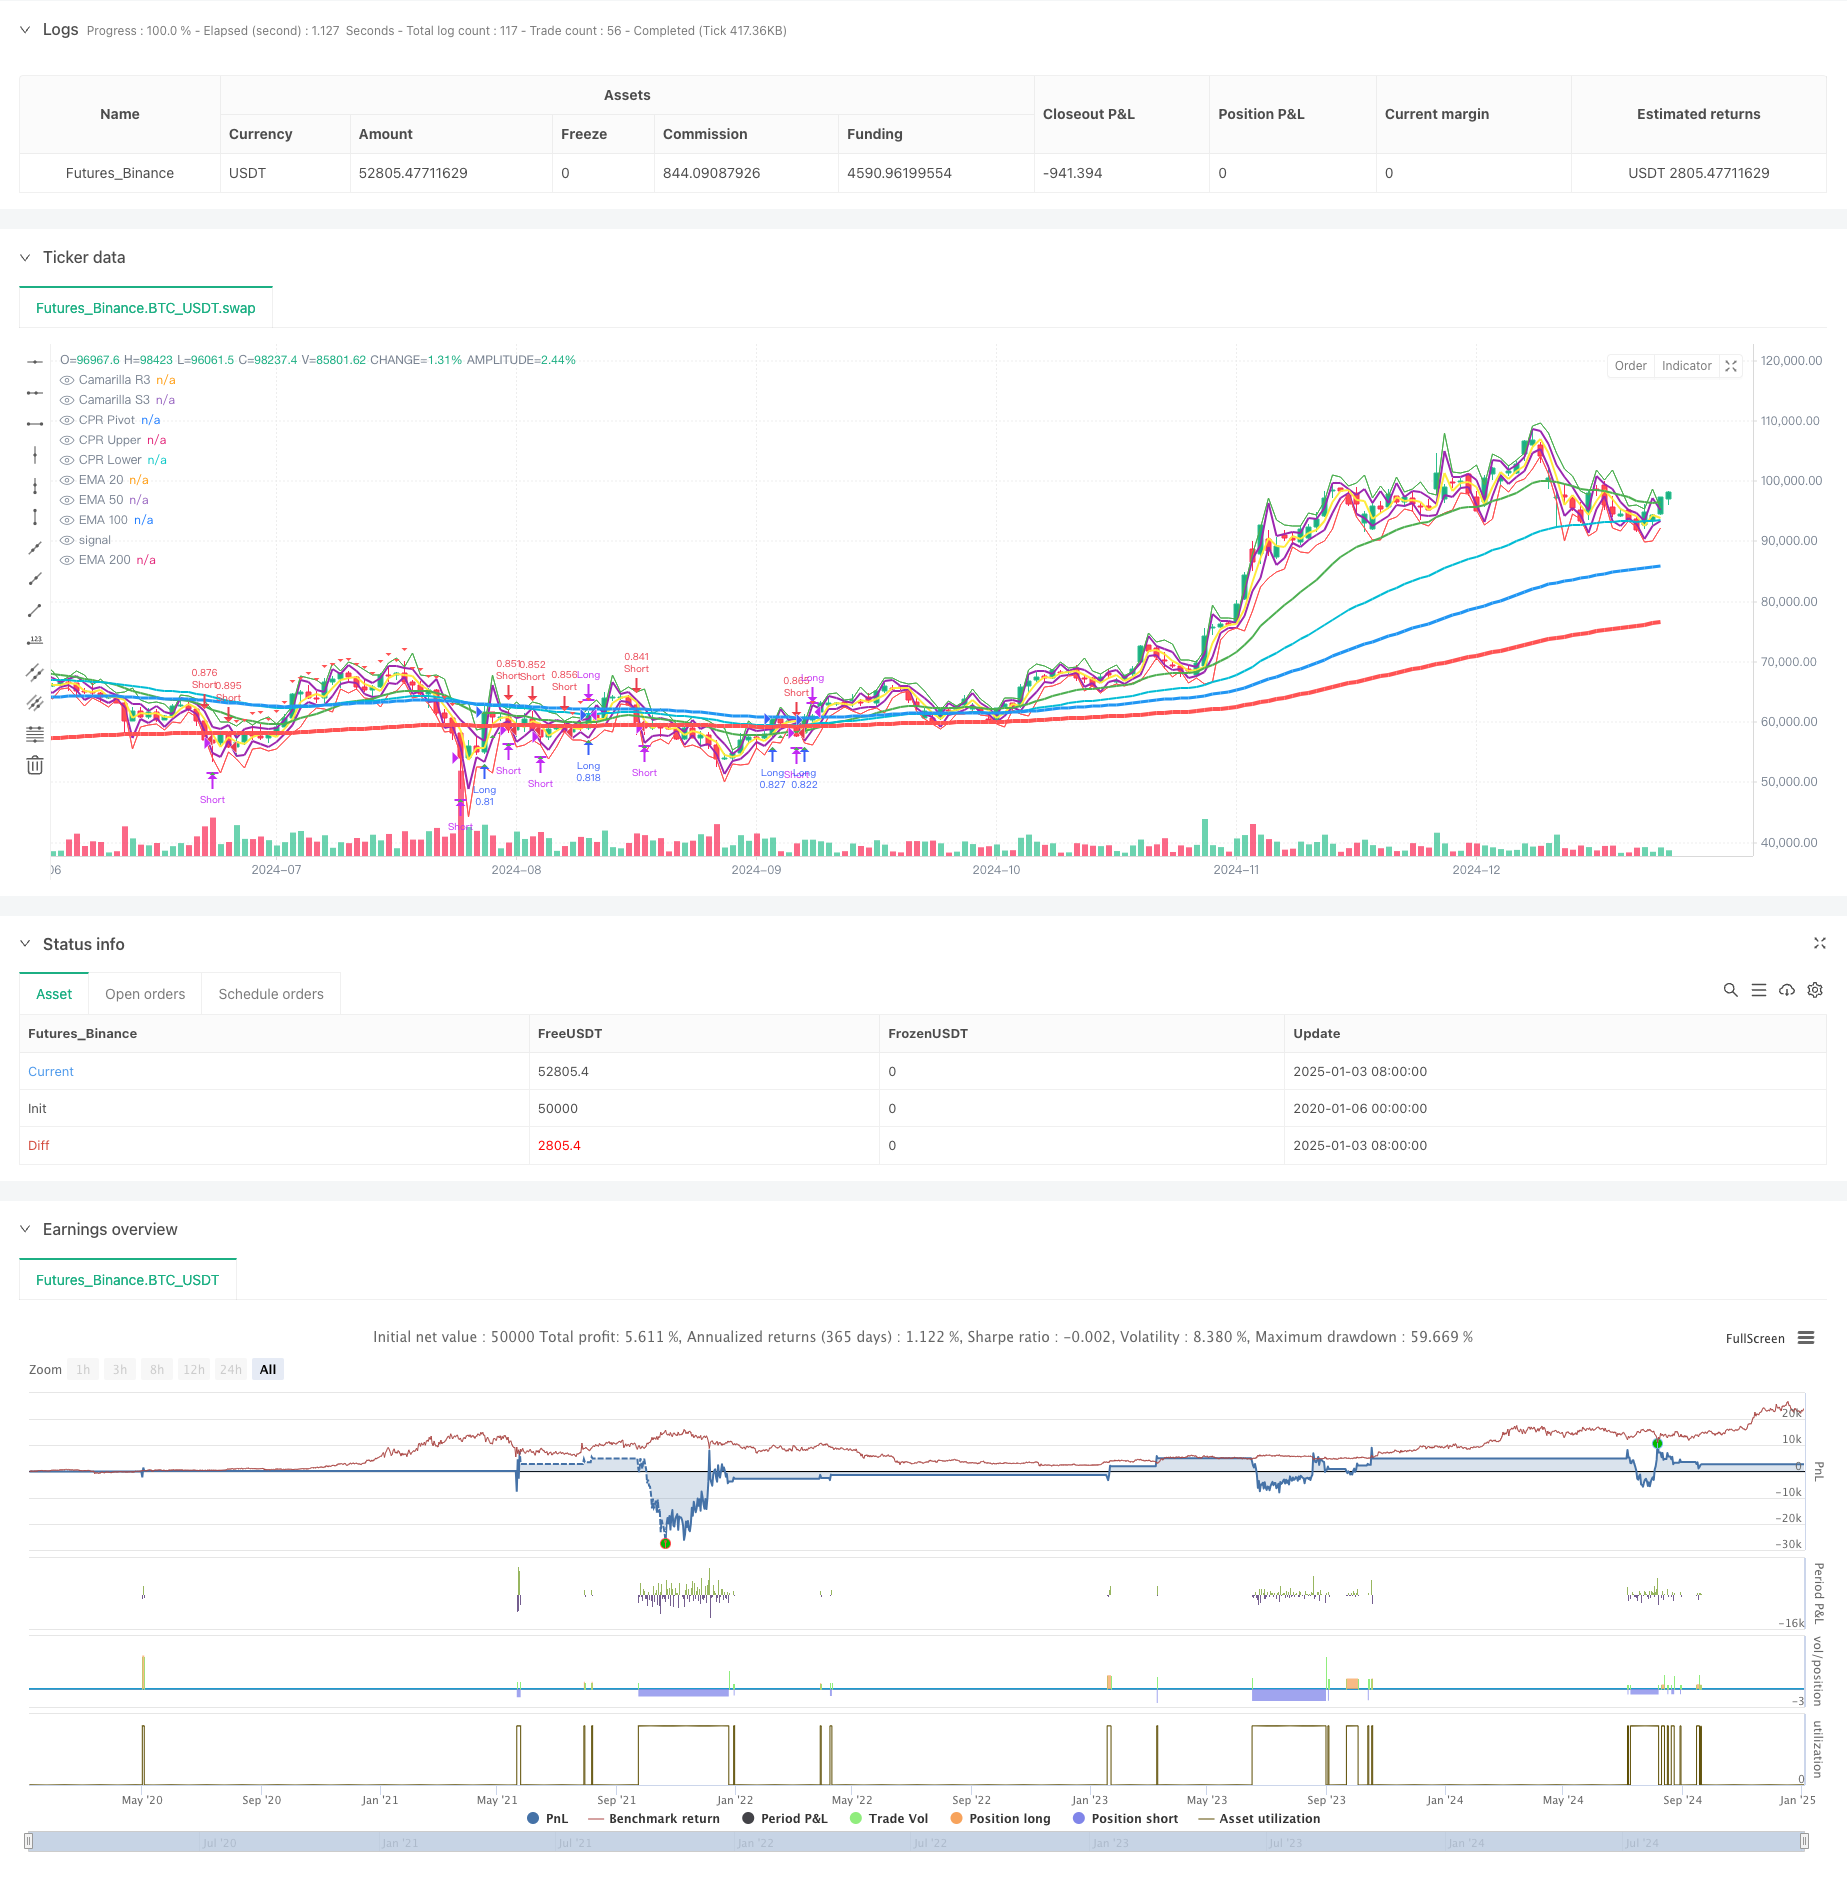
Descripción general
Esta estrategia es un sistema de trading de seguimiento de tendencias que combina múltiples medias móviles exponenciales (EMA), niveles de soporte y resistencia de Camarilla y el rango pivotal central (CPR). La estrategia identifica tendencias del mercado y oportunidades comerciales potenciales mediante el análisis del precio en relación con múltiples promedios móviles y rangos de precios importantes. El sistema adopta estrictas medidas de gestión de fondos y control de riesgos, incluido el tamaño porcentual de las posiciones y mecanismos de salida diversificados.
Principio de estrategia
La estrategia se basa en los siguientes componentes centrales:
- Se utiliza un sistema de promedios móviles múltiples (EMA20/50/100/200) para confirmar la dirección y la fuerza de la tendencia.
- Los niveles de soporte y resistencia de Camarilla (R3/S3) se utilizan para identificar niveles de precios clave
- El rango de precios central (CPR) se utiliza para determinar el rango de negociación intradía.
- Las señales de entrada se basan en el cruce del precio con EMA200 y la confirmación por EMA20
- Las estrategias de salida incluyen puntos fijos y modos de movimiento porcentual.
- El sistema de gestión de fondos ajusta dinámicamente el tamaño de la posición según el tamaño de la cuenta.
Ventajas estratégicas
- La combinación de indicadores técnicos multidimensionales proporciona señales comerciales más confiables.
- Mecanismo de salida flexible para adaptarse a diferentes entornos de mercado
- Un sistema de gestión de fondos perfecto controla eficazmente los riesgos
- Las funciones de seguimiento de tendencias ayudan a capturar grandes movimientos
- Los componentes de visualización facilitan a los comerciantes comprender la estructura del mercado
Riesgo estratégico
- Pueden producirse señales falsas en mercados volátiles
- Múltiples indicadores pueden causar señales comerciales retrasadas
- Los puntos de salida fijos pueden no funcionar bien en mercados volátiles
- Se necesita un tamaño de fondo mayor para soportar las reducciones
- Los costos de transacción pueden afectar el rendimiento general de la estrategia
Dirección de optimización de la estrategia
- Introducir indicadores de volatilidad para ajustar dinámicamente los parámetros de entrada y salida
- Añadir módulo de reconocimiento del estado del mercado para adaptarse a diferentes entornos de mercado
- Optimizar el sistema de gestión de fondos y añadir una gestión dinámica de posiciones
- Se agregó un filtro de tiempo de negociación para mejorar la calidad de la señal.
- Considere agregar análisis de volumen para mejorar la confiabilidad de la señal
Resumir
Esta estrategia construye un sistema de trading completo integrando múltiples herramientas clásicas de análisis técnico. Las ventajas del sistema radican en el análisis de mercado multidimensional y la gestión estricta de riesgos, pero también es necesario prestar atención a su adaptabilidad a diferentes entornos de mercado. A través de la optimización y mejora continuas, se espera que la estrategia mejore la rentabilidad manteniendo la estabilidad.
/*backtest
start: 2020-01-06 00:00:00
end: 2025-01-04 08:00:00
period: 1d
basePeriod: 1d
exchanges: [{"eid":"Futures_Binance","currency":"BTC_USDT"}]
*/

//@version=5
strategy("Pradeep Crude oil Entry and Exit", overlay=true)

// Input settings for EMAs
ema20_period = input.int(20, title="EMA 20 Period")
ema50_period = input.int(50, title="EMA 50 Period")
ema100_period = input.int(100, title="EMA 100 Period")
ema200_period = input.int(200, title="EMA 200 Period")

// Fixed line width settings for EMAs
ema20_width = 2  // EMA 20 Line Width
ema50_width = 2  // EMA 50 Line Width
ema100_width = 3 // EMA 100 Line Width
ema200_width = 4 // EMA 200 Line Width

// Backtesting inputs
initial_capital = input.float(50000, title="Initial Capital", minval=100)
position_size_percent = input.float(100, title="Position Size (% of Capital)", minval=0.1, maxval=100)
exit_mode = input.string("Price Movement", title="Exit Mode", options=["Price Movement", "Percentage Movement"])
exit_points = input.int(20, title="Exit After X Points", minval=1)
exit_percentage = input.float(1.0, title="Exit After X% Movement", minval=0.1, step=0.1)

// Calculate EMAs
ema20 = ta.ema(close, ema20_period)
ema50 = ta.ema(close, ema50_period)
ema100 = ta.ema(close, ema100_period)
ema200 = ta.ema(close, ema200_period)

// Signal conditions
long_entry_condition = close > ema200 and close > ema20 and close[1] <= ema200
long_exit_condition = (exit_mode == "Price Movement" and close - strategy.position_avg_price >= exit_points * syminfo.mintick) or
                      (exit_mode == "Percentage Movement" and (close - strategy.position_avg_price) / strategy.position_avg_price * 100 >= exit_percentage)
short_entry_condition = close < ema200 and close < ema20 and close[1] >= ema200
short_exit_condition = (exit_mode == "Price Movement" and strategy.position_avg_price - close >= exit_points * syminfo.mintick) or
                       (exit_mode == "Percentage Movement" and (strategy.position_avg_price - close) / strategy.position_avg_price * 100 >= exit_percentage)

// Plot EMAs with specified line widths
plot(ema20, color=color.green, title="EMA 20", linewidth=ema20_width)
plot(ema50, color=color.aqua, title="EMA 50", linewidth=ema50_width)
plot(ema100, color=color.blue, title="EMA 100", linewidth=ema100_width)
plot(ema200, color=color.red, title="EMA 200", linewidth=ema200_width)

// Camarilla Pivot Calculation
prev_high = request.security(syminfo.tickerid, "D", high[1])
prev_low = request.security(syminfo.tickerid, "D", low[1])
prev_close = request.security(syminfo.tickerid, "D", close[1])

R3 = prev_close + (prev_high - prev_low) * 1.1 / 2
S3 = prev_close - (prev_high - prev_low) * 1.1 / 2

// Central Pivot Range (CPR) Calculation
pivot = (prev_high + prev_low + prev_close) / 3
upper_cpr = pivot + (prev_high - prev_low)
lower_cpr = pivot - (prev_high - prev_low)

// Plot Camarilla R3, S3 and CPR levels
plot(R3, color=color.purple, title="Camarilla R3", linewidth=2)
plot(S3, color=color.purple, title="Camarilla S3", linewidth=2)
plot(pivot, color=color.yellow, title="CPR Pivot", linewidth=2)
plot(upper_cpr, color=color.green, title="CPR Upper", linewidth=1)
plot(lower_cpr, color=color.red, title="CPR Lower", linewidth=1)

// Backtesting: Capital and position size
capital = initial_capital
risk_per_trade = (position_size_percent / 100) * capital

// Long positions
if long_entry_condition
    strategy.entry("Long", strategy.long, qty=risk_per_trade / close)
    // Display entry price label
    label.new(bar_index, close, text="Entry: " + str.tostring(close), color=color.green, style=label.style_label_up, yloc=yloc.belowbar)

if long_exit_condition
    strategy.close("Long")
    // Display exit price label
    label.new(bar_index, close, text="Exit: " + str.tostring(close), color=color.red, style=label.style_label_down, yloc=yloc.abovebar)

// Short positions
if short_entry_condition
    strategy.entry("Short", strategy.short, qty=risk_per_trade / close)
    // Display entry price label
    label.new(bar_index, close, text="Entry: " + str.tostring(close), color=color.red, style=label.style_label_down, yloc=yloc.abovebar)

if short_exit_condition
    strategy.close("Short")
    // Display exit price label
    label.new(bar_index, close, text="Exit: " + str.tostring(close), color=color.green, style=label.style_label_up, yloc=yloc.belowbar)

// Plot signals
plotshape(long_entry_condition, style=shape.triangleup, location=location.belowbar, color=color.new(color.green, 0), size=size.small, title="Long Entry")
plotshape(long_exit_condition, style=shape.triangledown, location=location.abovebar, color=color.new(color.red, 0), size=size.small, title="Long Exit")
plotshape(short_entry_condition, style=shape.triangledown, location=location.abovebar, color=color.new(color.red, 0), size=size.small, title="Short Entry")
plotshape(short_exit_condition, style=shape.triangleup, location=location.belowbar, color=color.new(color.green, 0), size=size.small, title="Short Exit")