Pour les débutants, jetez un coup d'œil Je vous emmène à la négociation quantitative de crypto-monnaie (7)
Auteur:Je suis désolée., Créé: 2022-04-22 11:59:32, Mis à jour: 2022-04-22 12:01:11Pour les débutants, jetez un coup d'œil Je vous emmène à la négociation quantitative de crypto-monnaie (7)
Dans l'article précédent, nous avons pensé et conçu ensemble une stratégie de grille simple à plusieurs symboles. Ensuite, nous continuerons à apprendre et à avancer sur la voie du trading quantitatif. Dans cet article, nous discuterons d'une stratégie plus compliquée - la conception de la stratégie de couverture. L'article prévoit de concevoir une stratégie de couverture à plusieurs symboles.
Couverture transversale
En règle générale, la couverture interpériodique comporte un contrat de long et un contrat de short et attend trois situations (longue et courte) pour fermer les positions en même temps:
- Lorsque faire long est rentable, faire court a une perte, et le profit est plus que la perte, fermez des positions; il y aura un retour après que le profit couvre la perte.
- Lorsque le shorting est rentable, le longing a une perte, et le profit est supérieur à la perte, fermez les positions; il y aura un rendement après que le profit couvre la perte. (similaire)
- Lorsque faire long est rentable, et faire court est également rentable, n'hésitez pas à fermer des positions!
Pour d'autres situations où il y a des pertes flottantes, vous pouvez maintenir ou continuer à ajouter plus de positions. (parce que la fluctuation du spread est plus faible que la fluctuation unilatérale, le risque sera plus faible, mais notez que c'est seulement comparatif!)
Set A1 as the price of contract A at the time 1, and set B1 as the price of contract B at the time 1. At the time, do short in contract A, at A1; do long in contract B, at B1.
Set A2 as the price of contract A at the time 2, and set B2 as the price of contract B at the time 2. At the time, close positions (close short) of contract A, at A2; close positions (close long) of contract B, at B2.

Spread at time 1: A1 - B1 = X
Spread at time 2: A2 - B2 = Y
X - Y = A1 - B1 - (A2 - B2)
X - Y = A1 - B1 - A2 + B2
X - Y = A1 - A2 + B2 - B1

As you can see, "A1 - A2 " is the profit spread of closing position in contract A.
"B2 - B1" is the profit spread of closing position in contract B. It is profitable, as long as the closing postion spread of the two contracts is a positive number, namely A1 - A2 + B2 - B1 > 0. That is to say as long as X - Y > 0,
for: X - Y = A1 - A2 + B2 - B1

It is concluded that as long as the spread X when opening a position is greater than the spread Y when closing a position, it is profitable (note that it is making short in contract A and making long in contract B to open a position; if the situation is reversed, the result will be opposite). Of course, this is just theoretical, and factors such as the handling fee and slippoint should also be considered in practice.
Parce que les plateformes de crypto-monnaie ont à la fois des contrats de livraison et des contrats perpétuels. Et le prix des contrats perpétuels est toujours proche du prix au comptant en raison du taux de financement. Ensuite, nous choisissons d'utiliser des contrats de livraison et des contrats perpétuels pour faire de la couverture et de l'arbitrage. Pour le contrat de livraison, nous pouvons en choisir un avec une période relativement longue, de sorte que le contrat de couverture n'a pas besoin d'être fixé fréquemment.
Réchauffer par certaines statistiques de propagation multi-symbole
Après avoir appris le principe de base, vous n'avez pas besoin de vous précipiter pour écrire la stratégie. Tout d'abord, faites des statistiques sur les spreads, des graphiques de graphiques et observez les spreads. Nous le concevons en fonction deContrat OKEX. Il est très facile de tracer sur FMZ, et vous avez seulement besoin d'utiliser la fonction encapsulée, avec la bibliothèque de graphiquesTableaux de bordLa description de la fonction de traçage dans la documentation de l'API:https://www.fmz.com/api#chart..Je suis désolée. Puisqu'il s'agit d'une stratégie multi-symbole, tout d'abord, il est nécessaire de déterminer l'écart de prix de ces symboles avant de tracer.
var arrSwapContractType = ["BTC-USDT-SWAP", "LTC-USDT-SWAP", "ETH-USDT-SWAP", "ETC-USDT-SWAP"]   // perpetual contract
var arrDeliveryContractType = ["BTC-USDT-210924", "LTC-USDT-210924", "ETH-USDT-210924", "ETC-USDT-210924"]  // delivery contract
La configuration du graphique ne peut pas être écrite dans une boucle infinie, car vous ne savez pas quel symbole faire, et combien de symboles faire (qui sont déterminés selon les valeurs de arrDeliveryContractType et arrSwapContractType), donc la configuration du graphique est renvoyée par une fonction.
function createCfg(symbol) {
    var cfg = {
        extension: {
            // it is not part of the group, and is individually displayed; the default is 'group'
            layout: 'single',
            // the specified height, which can be set as string; "300px", which means it will be replaced by "300px" automatically through setting a value of 300
            height: 300,
            // the occupied unit value of the specified width, with a total value of 12
            col: 6
        },
        title: {
            text: symbol
        },
        xAxis: {
            type: 'datetime'
        },
        series: [{
            name: 'plus',
            data: []
        }]
    }

    return cfg
}

function main() {
    // declare arrCfg
    var arrCfg = []                                    // declare an array to store the chart configuration information
    _.each(arrSwapContractType, function(ct) {         // iteratively record the array of perpetual contract codes, pass the "XXX-USDT" part of the contract name as a parameter to the "createCfg" function, construct the chart configuration information, and return
        arrCfg.push(createCfg(formatSymbol(ct)[0]))    // the chart configuration information "push" returned by "createCfg" is in the "arrCfg" array
    })
    var objCharts = Chart(arrCfg)                      // call the function Chart on FMZ platform, and create a chart controlled object called objCharts
    objCharts.reset()                                  // initialize the chart content

    // the rest is omitted...
}
Nous allons préparer les données; nous utilisons l'interface de marché agrégée du contrat OKEX:
Contrat perpétuel en USDT:
https://www.okex.com/api/v5/market/tickers?instType=SWAP
Contrat de livraison en USDT:
https://www.okex.com/api/v5/market/tickers?instType=FUTURES
Ici, nous écrivons une fonction pour traiter l'invocation des deux interfaces, et traiter les données dans un format:
function getTickers(url) {
    var ret = []
    try {
        var arr = JSON.parse(HttpQuery(url)).data
        _.each(arr, function(ele) {
            ret.push({
                bid1: parseFloat(ele.bidPx),             // buy one price
                bid1Vol: parseFloat(ele.bidSz),          // volume of buy one price
                ask1: parseFloat(ele.askPx),             // ell one price
                ask1Vol: parseFloat(ele.askSz),          // volume of sell one price
                symbol: formatSymbol(ele.instId)[0],     // in the format of trading pair
                type: "Futures",                         // type
                originalSymbol: ele.instId               // original contract code
            })
        })
    } catch (e) {
        return null
    }
    return ret
}
Écrivez une autre fonction pour traiter le code du contrat.
function formatSymbol(originalSymbol) {
    var arr = originalSymbol.split("-")
    return [arr[0] + "_" + arr[1], arr[0], arr[1]]
}
Ensuite, il suffit d'itérer et de faire correspondre les données obtenues, de calculer les spreads et de tracer des graphiques à exporter, etc.
Ici, nous avons testé l'écart entre le contrat du prochain trimestre 210924 et le contrat perpétuel.
Le code complet:
// temporary parameters
var arrSwapContractType = ["BTC-USDT-SWAP", "LTC-USDT-SWAP", "ETH-USDT-SWAP", "ETC-USDT-SWAP"]
var arrDeliveryContractType = ["BTC-USDT-210924", "LTC-USDT-210924", "ETH-USDT-210924", "ETC-USDT-210924"]
var interval = 2000

function createCfg(symbol) {
    var cfg = {
        extension: {
            // it is not part of the group, and is individually displayed; the default is 'group'
            layout: 'single',
            // the specified height, which can be set as string; "300px", which means it will be replaced by "300px" automatically through setting a value of 300
            height: 300,
            // the occupied unit value of the specified width, with a total value of 12
            col: 6
        },
        title: {
            text: symbol
        },
        xAxis: {
            type: 'datetime'
        },
        series: [{
            name: 'plus',
            data: []
        }]
    }

    return cfg
}

function formatSymbol(originalSymbol) {
    var arr = originalSymbol.split("-")
    return [arr[0] + "_" + arr[1], arr[0], arr[1]]
}

function getTickers(url) {
    var ret = []
    try {
        var arr = JSON.parse(HttpQuery(url)).data
        _.each(arr, function(ele) {
            ret.push({
                bid1: parseFloat(ele.bidPx),
                bid1Vol: parseFloat(ele.bidSz),
                ask1: parseFloat(ele.askPx),
                ask1Vol: parseFloat(ele.askSz),
                symbol: formatSymbol(ele.instId)[0],
                type: "Futures",
                originalSymbol: ele.instId
            })
        })
    } catch (e) {
        return null
    }
    return ret
}

function main() {
    // declare arrCfg
    var arrCfg = []
    _.each(arrSwapContractType, function(ct) {
        arrCfg.push(createCfg(formatSymbol(ct)[0]))
    })
    var objCharts = Chart(arrCfg)
    objCharts.reset()

    while (true) {
        // obtain the market quote data
        var deliveryTickers = getTickers("https://www.okex.com/api/v5/market/tickers?instType=FUTURES")
        var swapTickers = getTickers("https://www.okex.com/api/v5/market/tickers?instType=SWAP")
        if (!deliveryTickers || !swapTickers) {
            Sleep(2000)
            continue
        }

        var tbl = {
            type : "table",
            title : "delivery-perpetual spread",
            cols : ["trading pair", "delivery", "perpetual", "positive hedge", "negative hedge"],
            rows : []
        }

        var subscribeDeliveryTickers = []
        var subscribeSwapTickers = []
        _.each(deliveryTickers, function(deliveryTicker) {
            _.each(arrDeliveryContractType, function(symbol) {
                if (deliveryTicker.originalSymbol == symbol) {
                    subscribeDeliveryTickers.push(deliveryTicker)
                }
            })
        })
        _.each(swapTickers, function(swapTicker) {
            _.each(arrSwapContractType, function(symbol) {
                if (swapTicker.originalSymbol == symbol) {
                    subscribeSwapTickers.push(swapTicker)
                }
            })
        })

        var pairs = []
        var ts = new Date().getTime()
        _.each(subscribeDeliveryTickers, function(deliveryTicker) {
            _.each(subscribeSwapTickers, function(swapTicker) {
                if (deliveryTicker.symbol == swapTicker.symbol) {
                    var pair = {symbol: swapTicker.symbol, swapTicker: swapTicker, deliveryTicker: deliveryTicker, plusDiff: deliveryTicker.bid1 - swapTicker.ask1, minusDiff: deliveryTicker.ask1 - swapTicker.bid1}
                    pairs.push(pair)
                    tbl.rows.push([pair.symbol, deliveryTicker.originalSymbol, swapTicker.originalSymbol, pair.plusDiff, pair.minusDiff])
                    for (var i = 0 ; i < arrCfg.length ; i++) {
                        if (arrCfg[i].title.text == pair.symbol) {
                            objCharts.add([i, [ts, pair.plusDiff]])
                        }
                    }
                }
            })
        })

        LogStatus(_D(), "\n`" + JSON.stringify(tbl) + "`")
        Sleep(interval)
    }
}
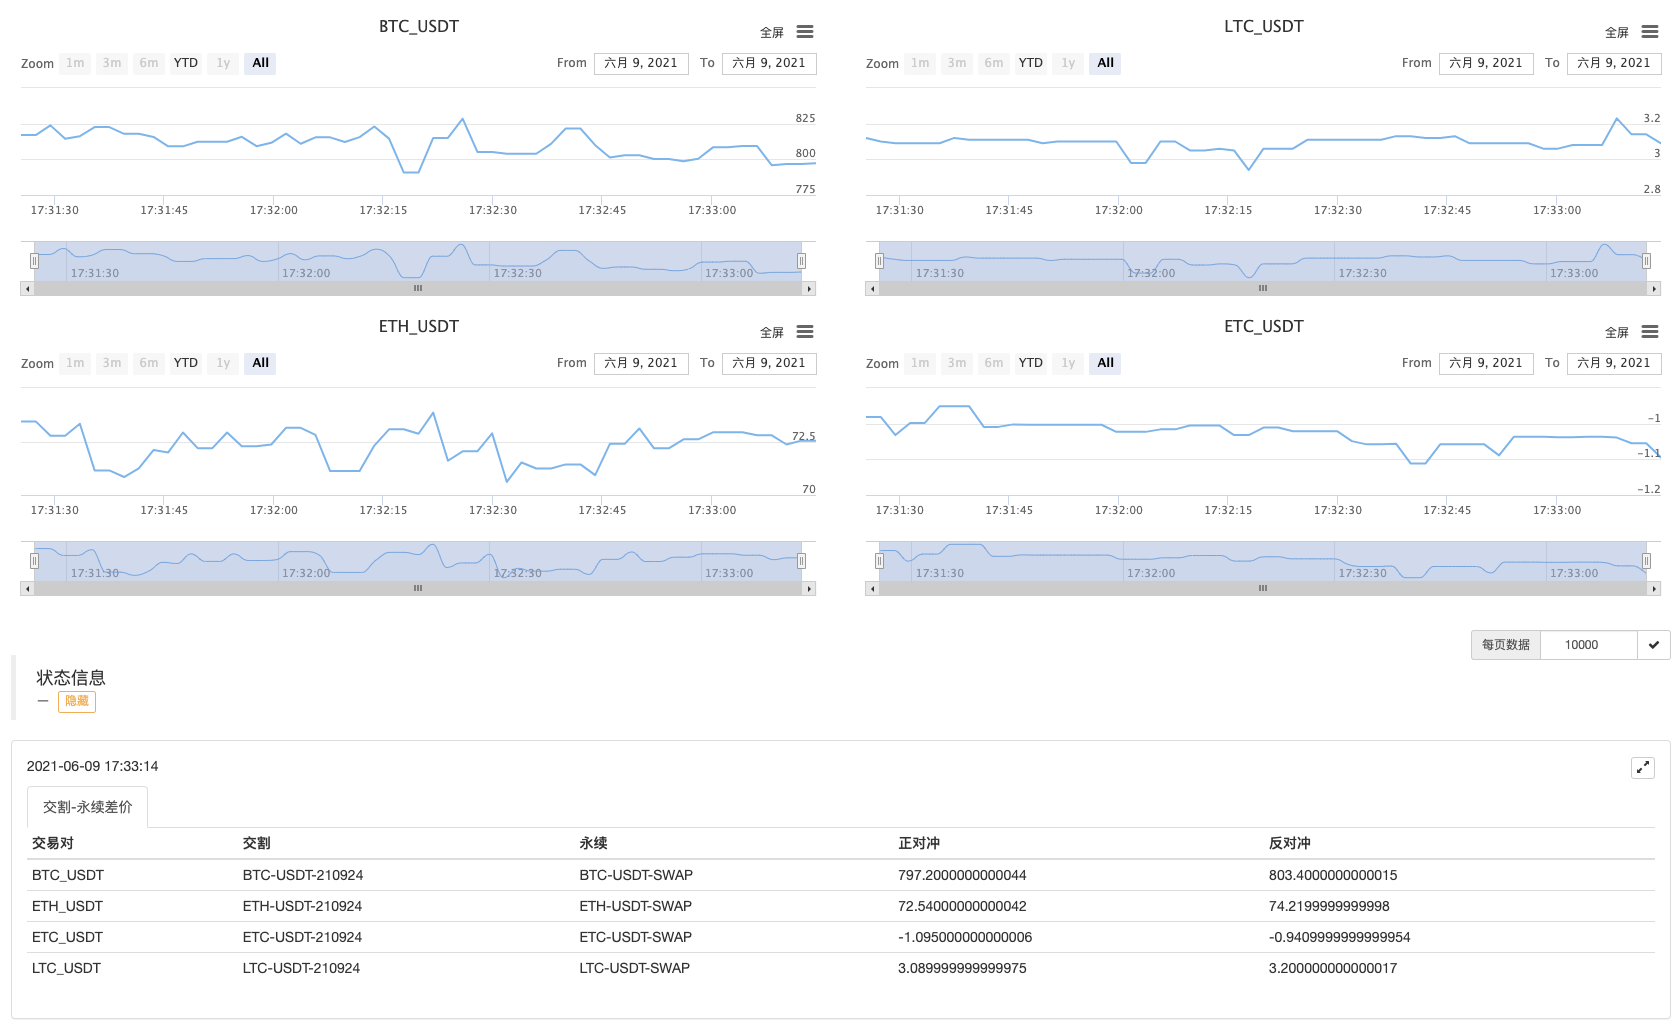
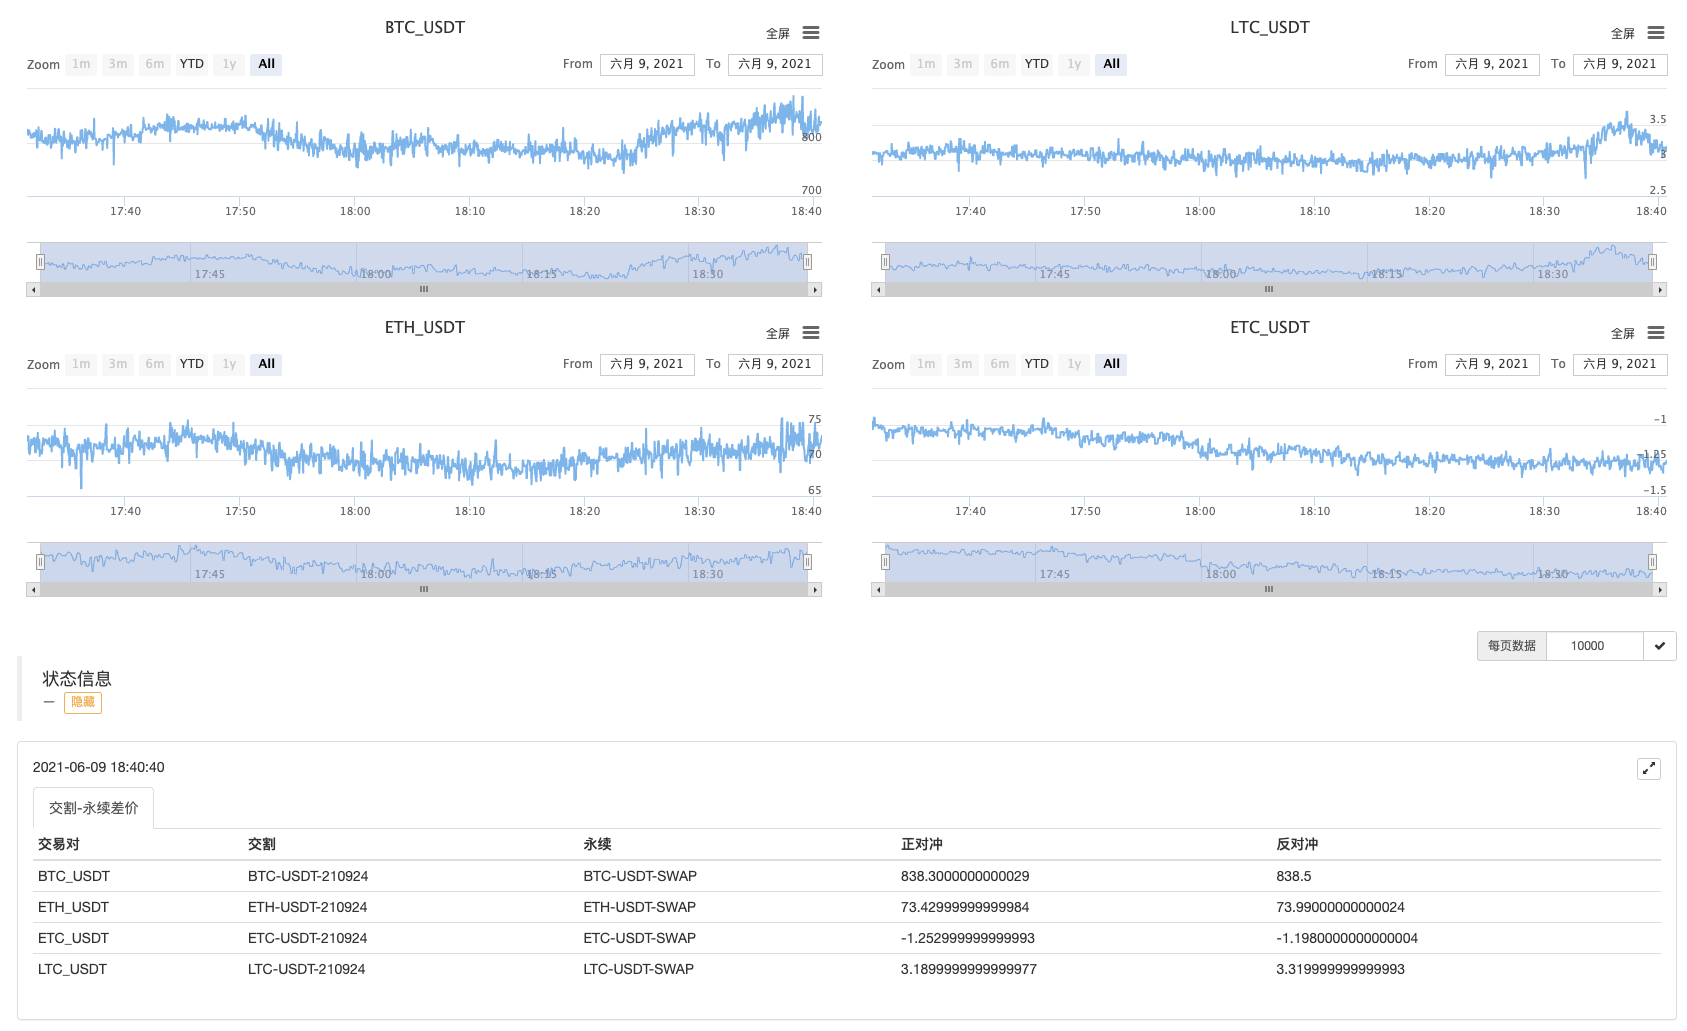
Opération du robot

Tu peux t'enfuir un peu.

Observez d'abord les écarts!
- Analyse de la stratégie de l'exploitant de la récolte des profits (1)
- Les transactions permanentes usdt en python sont converties en transactions permanentes busd qui fonction a besoin d'être modifiée et qui fonction a un impact sur cela, s'il vous plaît enseignez-moi
- Ajouter Stoploss au contrôle des risques
Quel est le prix? - Discussion sur la conception de la stratégie de haute fréquence
Magically Modified Profit Harvester - Arbitrage du taux de financement perpétuel de Binance (100% du taux annualisé sur le marché haussier)
- Utiliser l'interface de marché agrégée de la plateforme de crypto-monnaie pour construire une stratégie multi-symbole
- mon langage, comment écrire ici pour avoir un signal, imprimer une fois et sortir une fois
- La couverture dynamique par delta des options sur dérivés
- Utiliser SQLite pour construire une base de données quantique FMZ
- Pour les débutants, jetez un coup d'œil
Je vous emmène à la négociation quantitative de crypto-monnaie (8) - Pour les débutants, vérifiez
Je vous emmène à la négociation quantitative de crypto-monnaie (6) - Pour les débutants, jetez un coup d'œil
Je vous emmène à la négociation quantitative de crypto-monnaie (3) - Pour les débutants, vérifiez-le
Je vous emmène à la négociation quantitative de crypto-monnaie (2) - Mon inventeur a raté son temps.
- Comment trouver des idées pour une stratégie de rédaction?
- Pour les débutants, vérifiez
Je vous emmène à la négociation quantitative de crypto-monnaie (5) - Pour les débutants, vérifiez
Je vous emmène à la négociation quantitative de crypto-monnaie (4) - Temps de création et de fin de commande
- La stratégie du filet à l'épreuve du temps pour acheter Martin
- Pour ceux qui comprennent mon langage, aidez-moi à comprendre ce que signifie ce code: _TR:=MAX ((MAX (((HIGH-LOW),ABS ((REF ((CLOSE,1) -HIGH)),ABS ((REF ((CLOSE,1) -LOW));