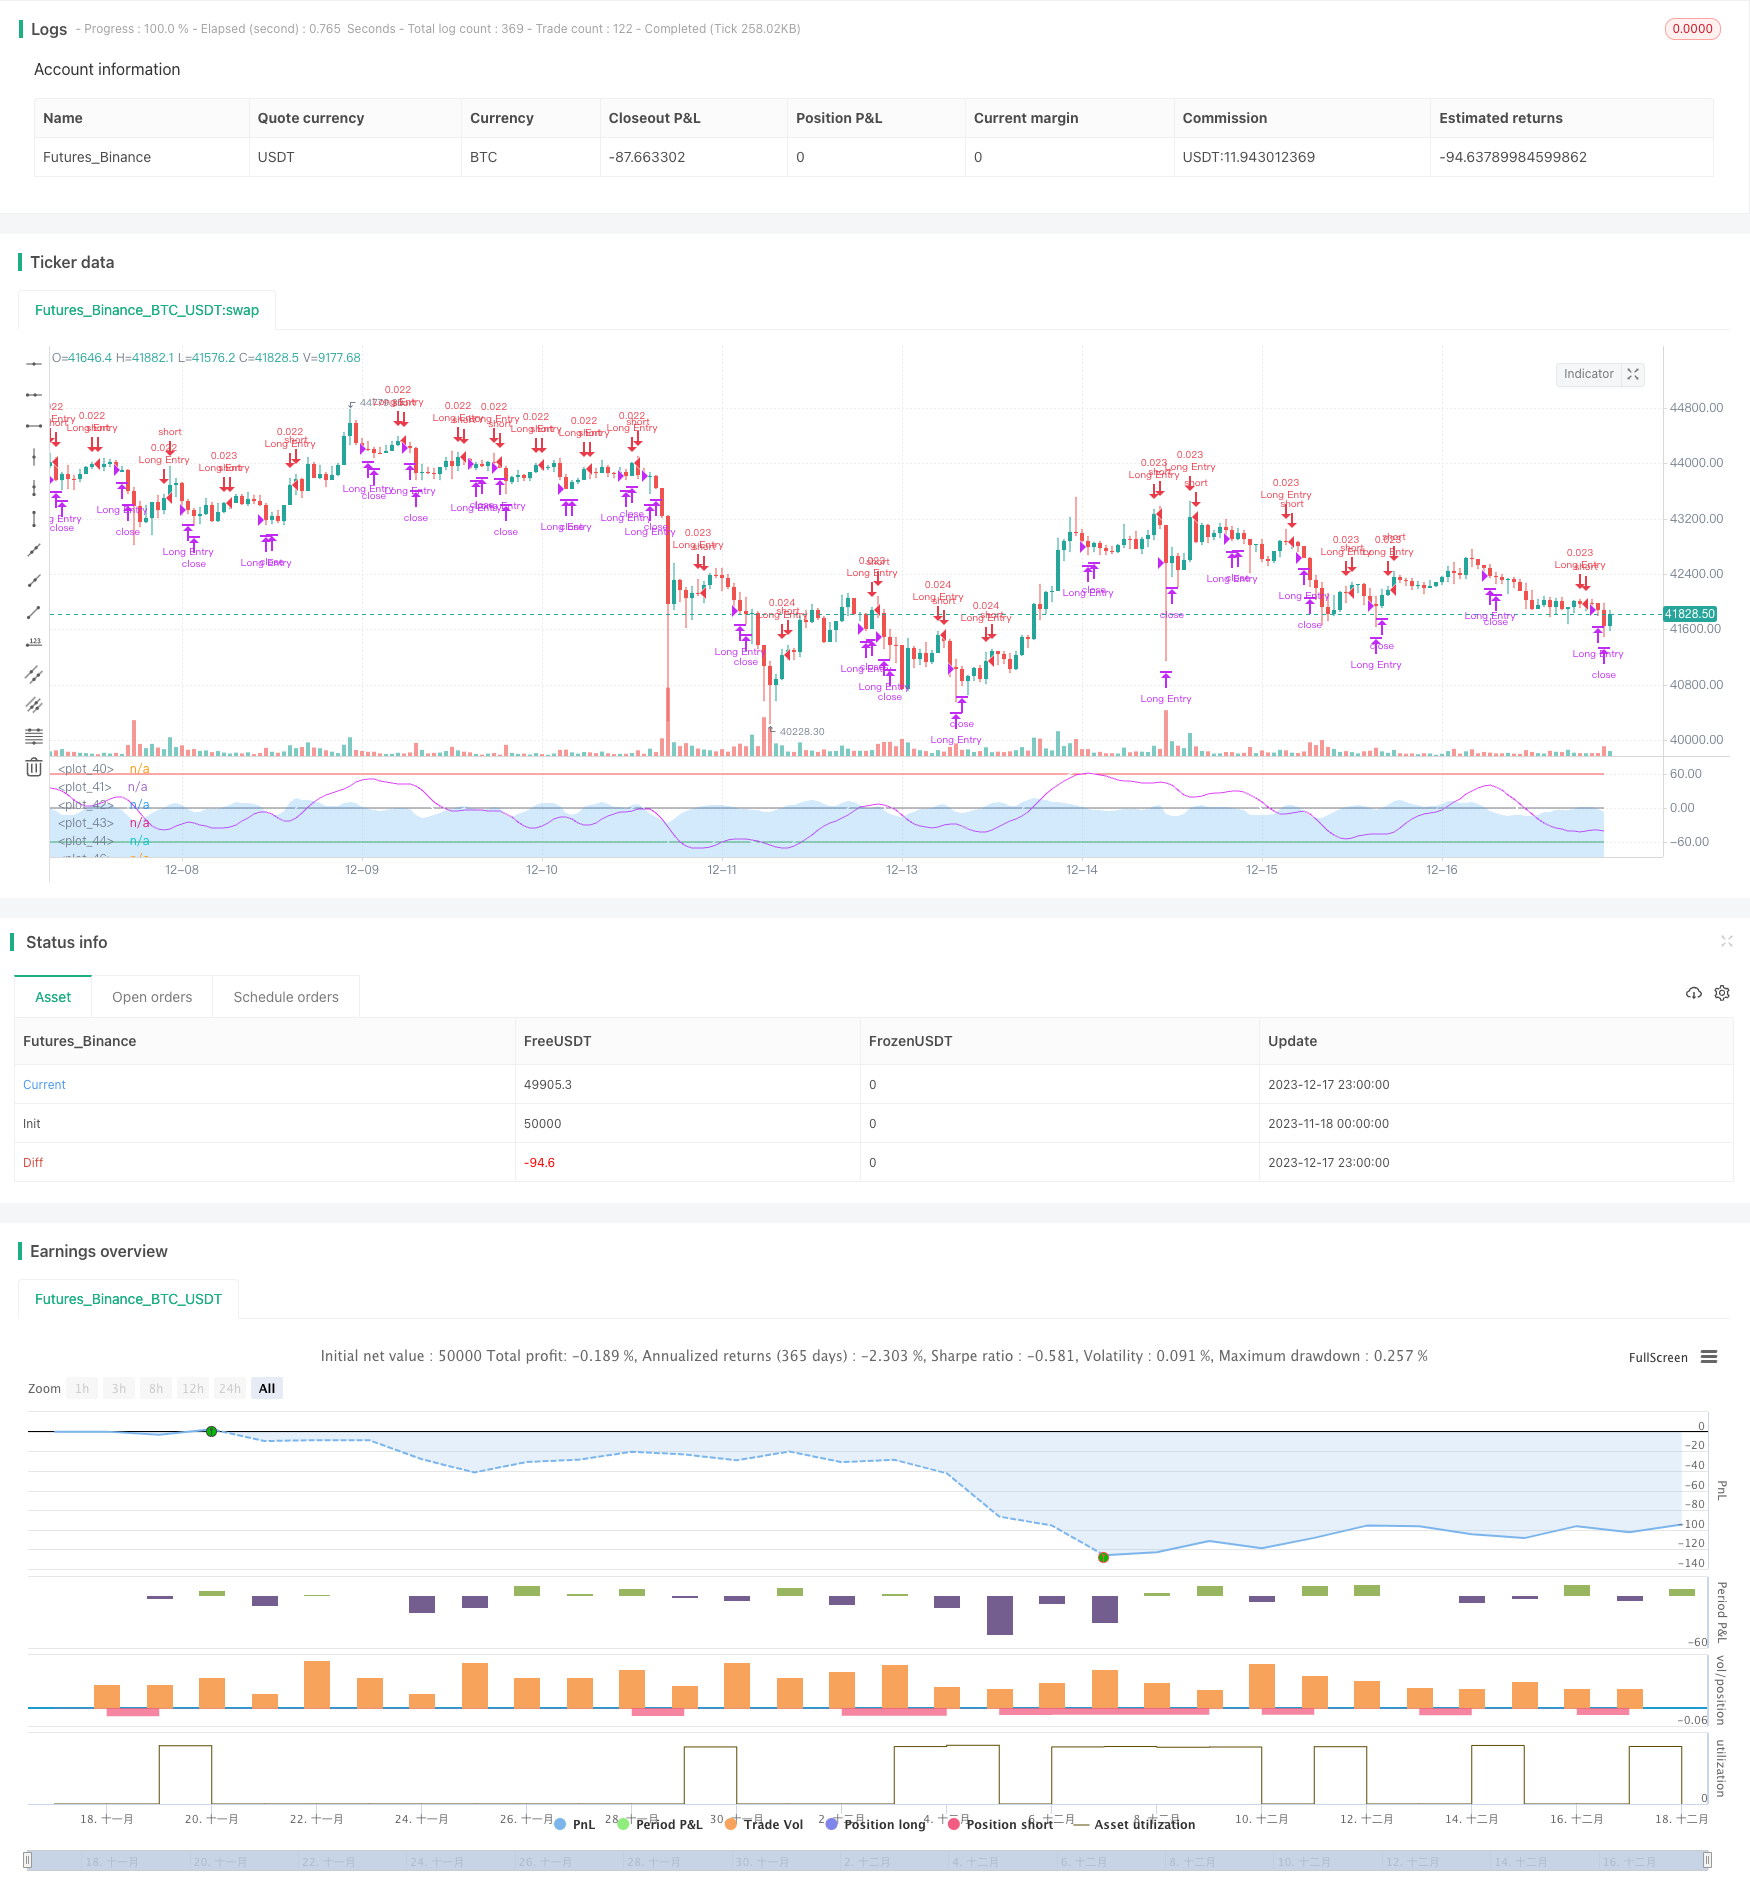
Stratégies de trading basées sur les tendances des vagues

Aperçu
Il s’agit d’une stratégie de trading basée sur l’indicateur de tendance des vagues de LazyBear. Cette stratégie permet de longer et de courtiser en calculant les tendances des vagues de la fluctuation des prix, de juger si le marché est en sur-achat ou en sur-vente.
Principe de stratégie
La stratégie est basée principalement sur l’indicateur de tendance à la vague de LazyBear. On calcule d’abord la moyenne des prix ((AP), puis l’ESA de l’AP et l’ESA de la variation absolue des prix (D). Sur cette base, on calcule l’indice de la vague (CI), puis l’ESA de la variation absolue des prix (CI), obtenant la ligne de tendance à la vague (WT).
Analyse des avantages
Il s’agit d’une stratégie de suivi de tendances très simple mais très pratique. Elle présente principalement les avantages suivants:
- L’indicateur de tendance des vagues permet d’identifier clairement les tendances des prix et l’humeur du marché
- Les points d’avance et de reprise sont jugés par la croix d’or et la croix de mort de WT, et les opérations sont simples
- Des paramètres personnalisables permettent d’ajuster la sensibilité des fils WT pour les différentes périodes
- Des signaux de filtrage conditionnels supplémentaires peuvent être ajoutés, tels que des fenêtres de limite de temps de transaction
Analyse des risques
Cette stratégie comporte aussi des risques:
- La stratégie de suivi des tendances est susceptible de générer un grand nombre de signaux erronés lors de la consolidation des marchés.
- La WT est elle-même très retardée et risque de manquer un point de basculement rapide des prix.
- Les paramètres par défaut peuvent ne pas être adaptés à toutes les variétés et à tous les cycles et doivent être optimisés
- Il n’y a pas de mécanisme de stop-loss, le temps de détention unilatérale pourrait être trop long
Les principales solutions sont les suivantes:
- Optimiser les paramètres et ajuster la sensibilité des fils WT
- Ajouter d’autres indicateurs pour vérifier et éviter les faux signaux
- Réglage de l’arrêt et de l’arrêt
- Limiter le nombre de transactions ou de positions par jour
Direction d’optimisation
Il y a encore de la place pour optimiser cette stratégie:
- Optimiser les paramètres du WT pour le rendre plus sensible ou plus stable
- Différentes combinaisons de paramètres basées sur différentes périodes
- Ajout d’indicateurs de quantité, d’indicateurs de volatilité, etc. comme signal de confirmation
- Ajout d’une logique d’arrêt et de stop
- Les méthodes de détention enrichies, telles que la pyramide, la grille de négociation
- Des méthodes telles que l’apprentissage automatique pour exploiter de meilleures fonctionnalités et règles de trading
Résumer
Cette stratégie est une stratégie de suivi de tendance des vagues très simple et pratique. Elle émet un signal de transaction en calculant la tendance de fluctuation des prix, en identifiant les surachats et les surventeurs sur le marché, en utilisant la croix d’or et la croix de mort du fil WT. La stratégie est simple à utiliser et facile à mettre en œuvre.
/*backtest
start: 2023-11-18 00:00:00
end: 2023-12-18 00:00:00
period: 1h
basePeriod: 15m
exchanges: [{"eid":"Futures_Binance","currency":"BTC_USDT"}]
*/

//
// @author LazyBear
//
// If you use this code in its original/modified form, do drop me a note.
//
//@version=4

// === INPUT BACKTEST RANGE ===
fromMonth = input(defval = 1,    title = "From Month",      type = input.integer, minval = 1, maxval = 12)
fromDay   = input(defval = 1,    title = "From Day",        type = input.integer, minval = 1, maxval = 31)
fromYear  = input(defval = 2021, title = "From Year",       type = input.integer, minval = 1970)
thruMonth = input(defval = 1,    title = "Thru Month",      type = input.integer, minval = 1, maxval = 12)
thruDay   = input(defval = 1,    title = "Thru Day",        type = input.integer, minval = 1, maxval = 31)
thruYear  = input(defval = 2112, title = "Thru Year",       type = input.integer, minval = 1970)

// === INPUT SHOW PLOT ===
showDate  = input(defval = true, title = "Show Date Range", type = input.bool)

// === FUNCTION EXAMPLE ===
start     = timestamp(fromYear, fromMonth, fromDay, 00, 00)        // backtest start window
finish    = timestamp(thruYear, thruMonth, thruDay, 23, 59)        // backtest finish window
window()  => true       // create function "within window of time"

n1 = input(10, "Channel Length")
n2 = input(21, "Average Length")
obLevel1 = input(60, "Over Bought Level 1")
obLevel2 = input(53, "Over Bought Level 2")
osLevel1 = input(-60, "Over Sold Level 1")
osLevel2 = input(-53, "Over Sold Level 2")

ap = hlc3
esa = ema(ap, n1)
d = ema(abs(ap - esa), n1)
ci = (ap - esa) / (0.015 * d)
tci = ema(ci, n2)

wt1 = tci
wt2 = sma(wt1,4)

plot(0, color=color.gray)
plot(obLevel1, color=color.red)
plot(osLevel1, color=color.green)
plot(obLevel2, color=color.red, style=3)
plot(osLevel2, color=color.green, style=3)

plot(wt1, color=color.white)
plot(wt2, color=color.fuchsia)
plot(wt1-wt2, color=color.new(color.blue, 80), style=plot.style_area)

//Strategy
strategy(title="T!M - Wave Trend Strategy", overlay = false, precision = 8, max_bars_back = 200, pyramiding = 0, initial_capital = 1000, currency = currency.NONE, default_qty_type = strategy.cash, default_qty_value = 1000, commission_type = "percent", commission_value = 0.1, calc_on_every_tick=false, process_orders_on_close=true)

longCondition  = crossover(wt1, wt2)
shortCondition = crossunder(wt1, wt2)

strategy.entry(id="Long Entry", comment="buy", long=true, when=longCondition and window())
strategy.close("Long Entry", comment="sell", when=shortCondition and window())

//strategy.entry(id="Short Entry", long=false, when=shortCondition)