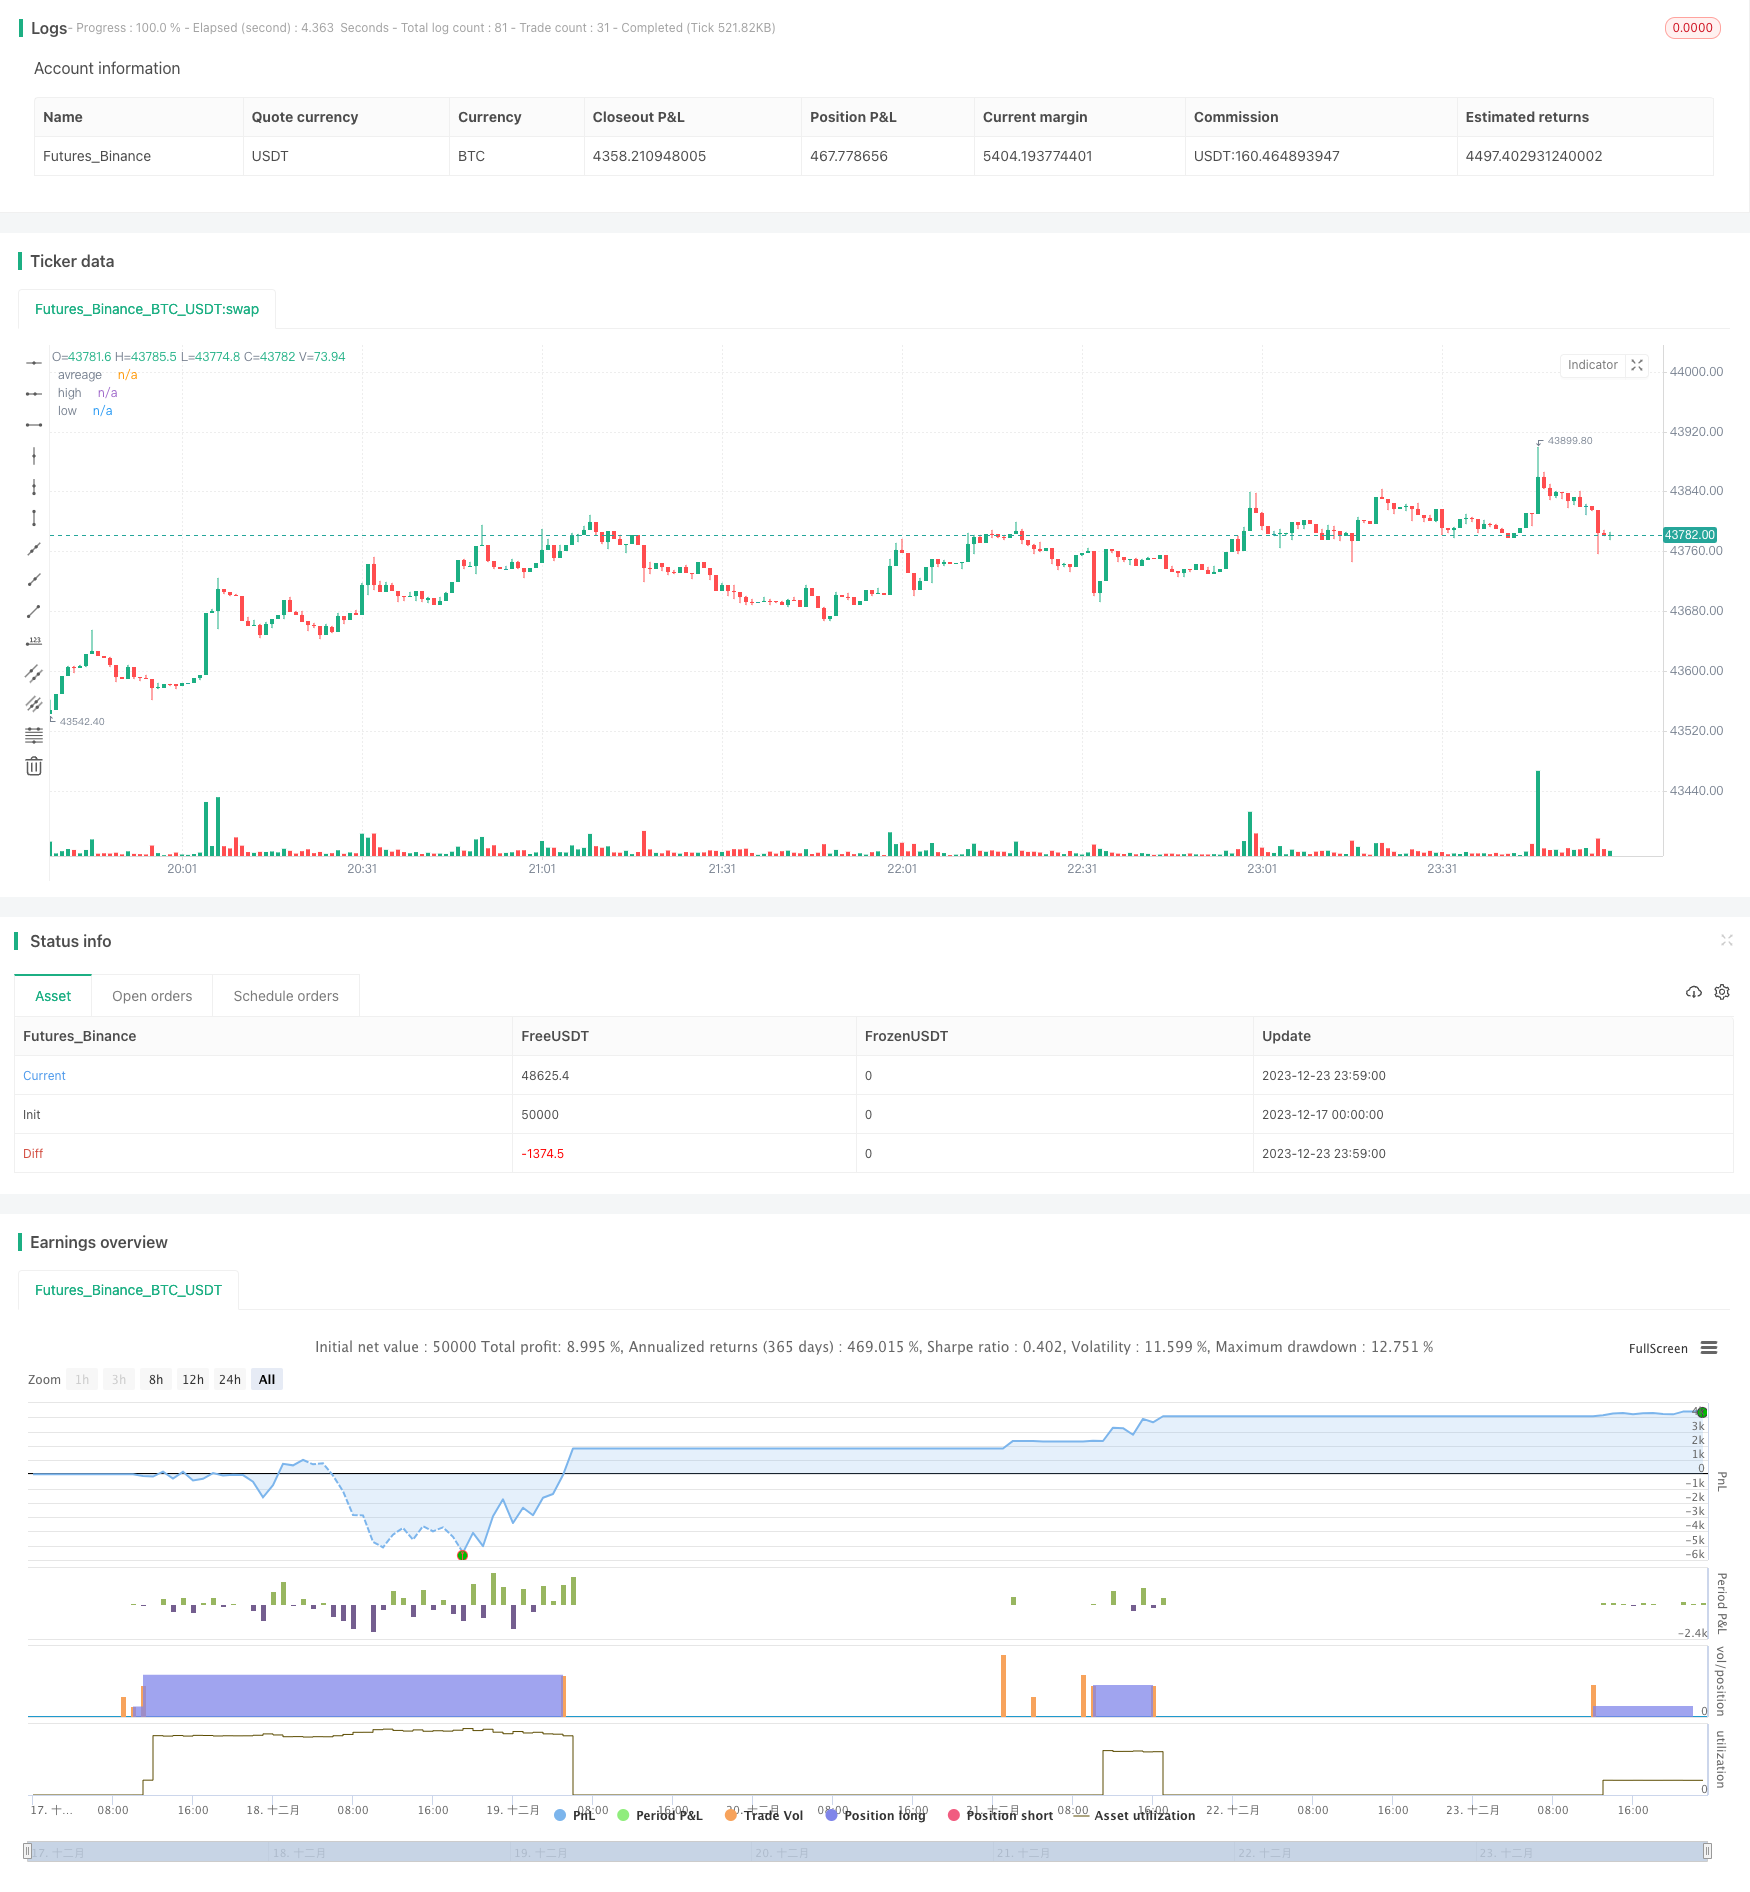
Stratégie de suivi de tendance à long terme basée sur l'indicateur RSI

Aperçu
La stratégie est basée sur la conception de l’indicateur RSI, un indicateur relativement fort, qui suit la tendance à plusieurs niveaux pour les points bas de RSI. La stratégie génère un signal d’achat lorsque l’indicateur RSI est inférieur à la ligne de survente et un signal de vente lorsque l’indicateur RSI est supérieur à la ligne de survente. La stratégie optimise la performance de la tendance à suivre et permet de contrôler efficacement le risque de négociation.
Principe de stratégie
La stratégie utilise le RSI pour déterminer si le prix d’une action est surévalué ou sousévalué. Le RSI, combiné à une ligne de survente et de survente, forme un signal d’achat et de vente. Plus précisément, si le RSI traverse la ligne de survente de 20 points, il génère un signal d’achat; si le RSI traverse la ligne de survente de 80 points, il génère un signal de vente.
Après avoir entré dans une position à plusieurs têtes, la stratégie consiste à définir une ligne d’arrêt initiale pour contrôler le risque de baisse. En même temps, deux lignes d’arrêt de différentes proportions sont mises en place, en bloquant les arrêts pour bloquer les bénéfices.
La stratégie utilise de manière concise et efficace les indicateurs RSI pour déterminer le moment de la mise en marché. Le paramètre de stop-loss est raisonnable et permet de contrôler efficacement le risque.
Avantages stratégiques
- L’indicateur RSI est utilisé pour juger de l’excédent et éviter de faire trop à l’aveugle.
- Les paramètres de l’indicateur RSI ont été optimisés pour un meilleur rendement
- La conception de l’arrêt double est raisonnable, permettant de bloquer l’arrêt par lots et de verrouiller plus de bénéfices.
- Les arrêts initiaux et les arrêts consécutifs empêchent les pertes massives
Analyse des risques
- Les stratégies à plusieurs niveaux ne fonctionnent pas dans un marché haussier qui ne peut pas être rentable
- Il y a une probabilité que l’indicateur RSI émet un faux signal, et un mauvais jugement du signal peut augmenter les pertes.
- Un point d’arrêt trop profond entraîne des risques irréversibles
- L’absence de restrictions sur le nombre et le pourcentage de prises de position pourrait accroître les pertes
Direction d’optimisation
- En combinaison avec d’autres indicateurs, le filtrage des signaux RSI améliore la précision du signal
- Ajout de restrictions sur le nombre et le pourcentage de mises en réserve
- Tester l’efficacité de différents paramètres du RSI
- Optimiser les points d’arrêt de perte et réduire les risques
Résumer
Cette stratégie utilise les indicateurs RSI pour juger de la tendance, les paramètres d’arrêt et de perte sont raisonnables. Elle permet de juger efficacement de la tendance, de contrôler le risque de transaction et convient à une stratégie de suivi à plusieurs têtes. La stabilité de la stratégie peut être encore améliorée par le filtrage des signaux, les tests paramétriques et l’optimisation des arrêts.
/*backtest
start: 2023-12-17 00:00:00
end: 2023-12-24 00:00:00
period: 1m
basePeriod: 1m
exchanges: [{"eid":"Futures_Binance","currency":"BTC_USDT"}]
*/

// This source code is subject to the terms of the Mozilla Public License 2.0 at https://mozilla.org/MPL/2.0/

//@version=5

strategy(title='RSI Long Strategy', overlay=true, pyramiding=5, initial_capital=10000, default_qty_type=strategy.percent_of_equity, default_qty_value=100, calc_on_order_fills=false, slippage=0, commission_type=strategy.commission.percent, commission_value=0.075)
strat_dir_input = input.string(title='Strategy Direction', defval='long', options=['long', 'short', 'all'])
strat_dir_value = strat_dir_input == 'long' ? strategy.direction.long : strat_dir_input == 'short' ? strategy.direction.short : strategy.direction.all
strategy.risk.allow_entry_in(strat_dir_value)
//INPUTS


length = input(21)
overSold = input(20)
overBought = input(80)
p = close

vrsi = ta.rsi(p, length)
price = close
var bool long = na
var bool short = na

long := ta.crossover(vrsi, overSold)
short := ta.crossunder(vrsi, overBought)

var float last_open_long = na
var float last_open_short = na

last_open_long := long ? close : nz(last_open_long[1])
last_open_short := short ? close : nz(last_open_short[1])
mpoint=(last_open_long+last_open_short)/2

entry_value = last_open_long
entry_value1 = last_open_short

// Rounding levels to min tick
nround(x) =>
    n = math.round(x / syminfo.mintick) * syminfo.mintick
    n
//
disp_panels = input(true, title='Display info panels?')
fibs_label_off = input(40, title='fibs label offset')
fibs_label_size = input.string(size.normal, options=[size.tiny, size.small, size.normal, size.large, size.huge], title='fibs label size')
r1_x = timenow + math.round(ta.change(time) * fibs_label_off)
r1_y = last_open_short
text1 = 'High : ' + str.tostring(nround(last_open_short))
s1_y = last_open_long
text3 = 'low : ' + str.tostring(nround(last_open_long))

R1_label = disp_panels ? label.new(x=r1_x, y=r1_y, text=text1, xloc=xloc.bar_time, yloc=yloc.price, color=color.orange, style=label.style_label_down, textcolor=color.black, size=fibs_label_size) : na
S1_label = disp_panels ? label.new(x=r1_x, y=s1_y, text=text3, xloc=xloc.bar_time, yloc=yloc.price, color=color.lime, style=label.style_label_up, textcolor=color.black, size=fibs_label_size) : na

label.delete(R1_label[1])
label.delete(S1_label[1])
//
plot(mpoint, title='avreage', color=color.new(color.red, 40), style=plot.style_linebr, linewidth=3, trackprice=true, offset=-9999)
plot(last_open_short, title='high', color=color.new(color.red, 40), style=plot.style_linebr, linewidth=3, trackprice=true, offset=-9999)
plot(last_open_long, title='low', color=color.new(color.blue, 40), style=plot.style_linebr, linewidth=3, trackprice=true, offset=-9999)
//
trend = input(false)
if barstate.islast and trend == true
    line z = line.new(bar_index[1], last_open_short[1], bar_index, last_open_short, extend=extend.both, color=color.red, style=line.style_dashed, width=1)
    line f = line.new(bar_index[1], mpoint[1], bar_index, mpoint, extend=extend.both, color=color.blue, style=line.style_dashed, width=1)
    line w = line.new(bar_index[1], last_open_long[1], bar_index, last_open_long, extend=extend.both, color=color.green, style=line.style_dashed, width=1)
    line.delete(z[1])
    line.delete(f[1])
    line.delete(w[1])

//bu = ta.crossover(close, mpoint)
//sz = ta.crossunder(close, mpoint)
//bu1 = ta.crossover(close, last_open_short)
sz1 = ta.crossunder(close, last_open_short)
bu2 = ta.crossover(close, last_open_long)
//sz2 = ta.crossunder(close, last_open_long)
//plotshape(sz, style=shape.triangledown, location=location.abovebar, color=color.new(color.orange, 0), size=size.tiny)
//plotshape(bu, style=shape.triangleup, location=location.belowbar, color=color.new(color.blue, 0), size=size.tiny)
//plotshape(sz1, style=shape.triangledown, location=location.abovebar, color=color.new(color.red, 0), size=size.tiny)
//plotshape(bu1, style=shape.triangleup, location=location.belowbar, color=color.new(color.green, 0), size=size.tiny)
//plotshape(sz2, style=shape.triangledown, location=location.abovebar, color=color.new(color.red, 0), size=size.tiny)
//plotshape(bu2, style=shape.triangleup, location=location.belowbar, color=color.new(color.green, 0), size=size.tiny)

l = bu2
s = sz1
if l
    strategy.entry('buy', strategy.long)
if s
    strategy.entry('sell', strategy.short)
per(pcnt) =>
    strategy.position_size != 0 ? math.round(pcnt / 100 * strategy.position_avg_price / syminfo.mintick) : float(na)
stoploss = input.float(title=' stop loss', defval=5, minval=0.01)
los = per(stoploss)
q1 = input.int(title=' qty_percent1', defval=50, minval=1)
q2 = input.int(title=' qty_percent2', defval=50, minval=1)
tp1 = input.float(title=' Take profit1', defval=3, minval=0.01)
tp2 = input.float(title=' Take profit2', defval=5, minval=0.01)
//tp4 = input.float(title=' Take profit4', defval=5, minval=0.01)
strategy.exit('x1', qty_percent=q1, profit=per(tp1), loss=los)
strategy.exit('x2', qty_percent=q2, profit=per(tp2), loss=los)