Stratégie de moyenne mobile adaptative du canal gaussien
Aperçu
La stratégie est basée sur la théorie de l’oscillateur de Gauss, proposée par John Ehlers, qui permet de générer un signal de négociation lisse et adaptable en calculant plusieurs moyennes mobiles sur les données de prix. Le cœur de la stratégie est de construire un canal de prix dynamiquement ajusté, obtenu par la hausse et la baisse du prix après l’oscillation de Gauss. Les prix sont achetés à la hausse et vendus à la baisse.
Principe de stratégie
Les principes de la stratégie d’adaptation de Gauss sont les suivants:
- Calcul des valeurs de Gauss pour les prix. Les paramètres bêta et alpha sont calculés en fonction de la période d’échantillonnage et du nombre de points polaires définis par l’utilisateur, puis les données de prix sont progressivement gonflées pour obtenir une séquence de prix lisse.
- Calculer les valeurs de Gauss pour les fluctuations réelles. Traiter les fluctuations réelles des prix de la même manière pour obtenir une séquence de fluctuations lisse.
- Construction d’un canal de Gauss. Le canal de Gauss est un canal dynamique formé par le moyen-train, le haut-train, le produit de l’amplitude d’oscillation réelle multipliée par le nombre de multiplicateurs définis par l’utilisateur, et le bas-train, le milieu-train.
- Génération de signaux de transaction: génération de signaux d’achat lorsque le prix monte au-dessus du canal; génération de signaux de vente lorsque le prix descend au-dessous du canal.
- Introduction d’un paramètre d’intervalle de temps. L’utilisateur peut définir l’heure de début et de fin de l’exécution d’une stratégie.
Analyse des avantages
Les avantages de la stratégie d’adaptation à la ligne égale de Gauss sont les suivants:
- La stratégie utilise des paramètres qui s’adaptent dynamiquement aux différentes conditions du marché et aux différentes variétés de transactions, sans avoir besoin de démarrage manuel fréquent.
- Le suivi de la tendance est bon. En construisant des canaux de prix, la stratégie est capable de mieux capturer et suivre les tendances du marché, évitant ainsi les faux signaux dans les marchés instables.
- Une bonne fluidité. Utilisation de la technique des ondes de Gauss pour traiter les données de prix de manière fluide à plusieurs reprises, éliminant la plupart du bruit du marché et rendant les signaux de négociation plus fiables.
- La flexibilité est élevée. L’utilisateur peut ajuster les paramètres de la stratégie, tels que le cycle d’échantillonnage, le nombre de pôles, le multiplicateur d’oscillation, etc., selon les besoins, afin d’optimiser la performance de la stratégie.
- La mise en place d’un paramètre de période permet aux stratégies de fonctionner sur une période donnée, ce qui facilite l’application et la recherche de la rétroaction.
Analyse des risques
Malgré les avantages de la stratégie d’adaptation à l’uniformité du canal de Gauss, certains risques subsistent:
- Risques de paramétrage: les paramètres mal définis peuvent entraîner l’échec ou la mauvaise performance de la stratégie, ce qui nécessite des tests et des optimisations répétés dans les applications réelles.
- Risque d’incident majeur. Face à certains événements majeurs, la stratégie peut ne pas être en mesure de réagir correctement et en temps opportun, ce qui entraîne des pertes.
- Risque de suradaptation. Si les paramètres sont définis de manière trop adaptée aux données historiques, cela peut entraîner une mauvaise performance de la stratégie à l’avenir, ce qui nécessite de prendre en compte les performances à l’intérieur et à l’extérieur de l’échantillon.
- Risque d’arbitrage. La stratégie s’applique principalement aux marchés tendanciels, et les transactions fréquentes dans les marchés en crise peuvent entraîner un risque d’arbitrage plus élevé.
Direction d’optimisation
Les orientations d’optimisation de la stratégie d’adaptation à la ligne égale de Gauss incluent:
- Optimisation dynamique des paramètres. Optimisation automatique et adaptation dynamique des paramètres stratégiques, amélioration de l’adaptabilité grâce à l’introduction de technologies telles que l’apprentissage automatique.
- La fusion multifactorielle consiste à combiner d’autres indicateurs ou facteurs techniques efficaces avec le canal Gauss pour former un signal de transaction plus robuste.
- Optimisation de la gestion des positions. Ajout de règles raisonnables de gestion des positions et de gestion des fonds sur la base de la stratégie, contrôle des retraits et des risques.
- La synergie multivariée consiste à étendre la stratégie à plusieurs variétés de transactions différentes, afin de diversifier les risques par la disposition des actifs et l’analyse de la corrélation.
Résumer
La stratégie de Gauss auto-adaptative est une stratégie de négociation quantitative basée sur les ondes Gauss et les paramètres auto-adaptatifs, qui génère des signaux de négociation fluides et fiables en construisant dynamiquement des canaux de prix. La stratégie présente des avantages tels que la capacité d’adaptation, le suivi des tendances, la fluidité, la flexibilité et la pratique, mais elle est également exposée à des risques tels que la configuration des paramètres, les événements inattendus, la suradaptation et le arbitrage.
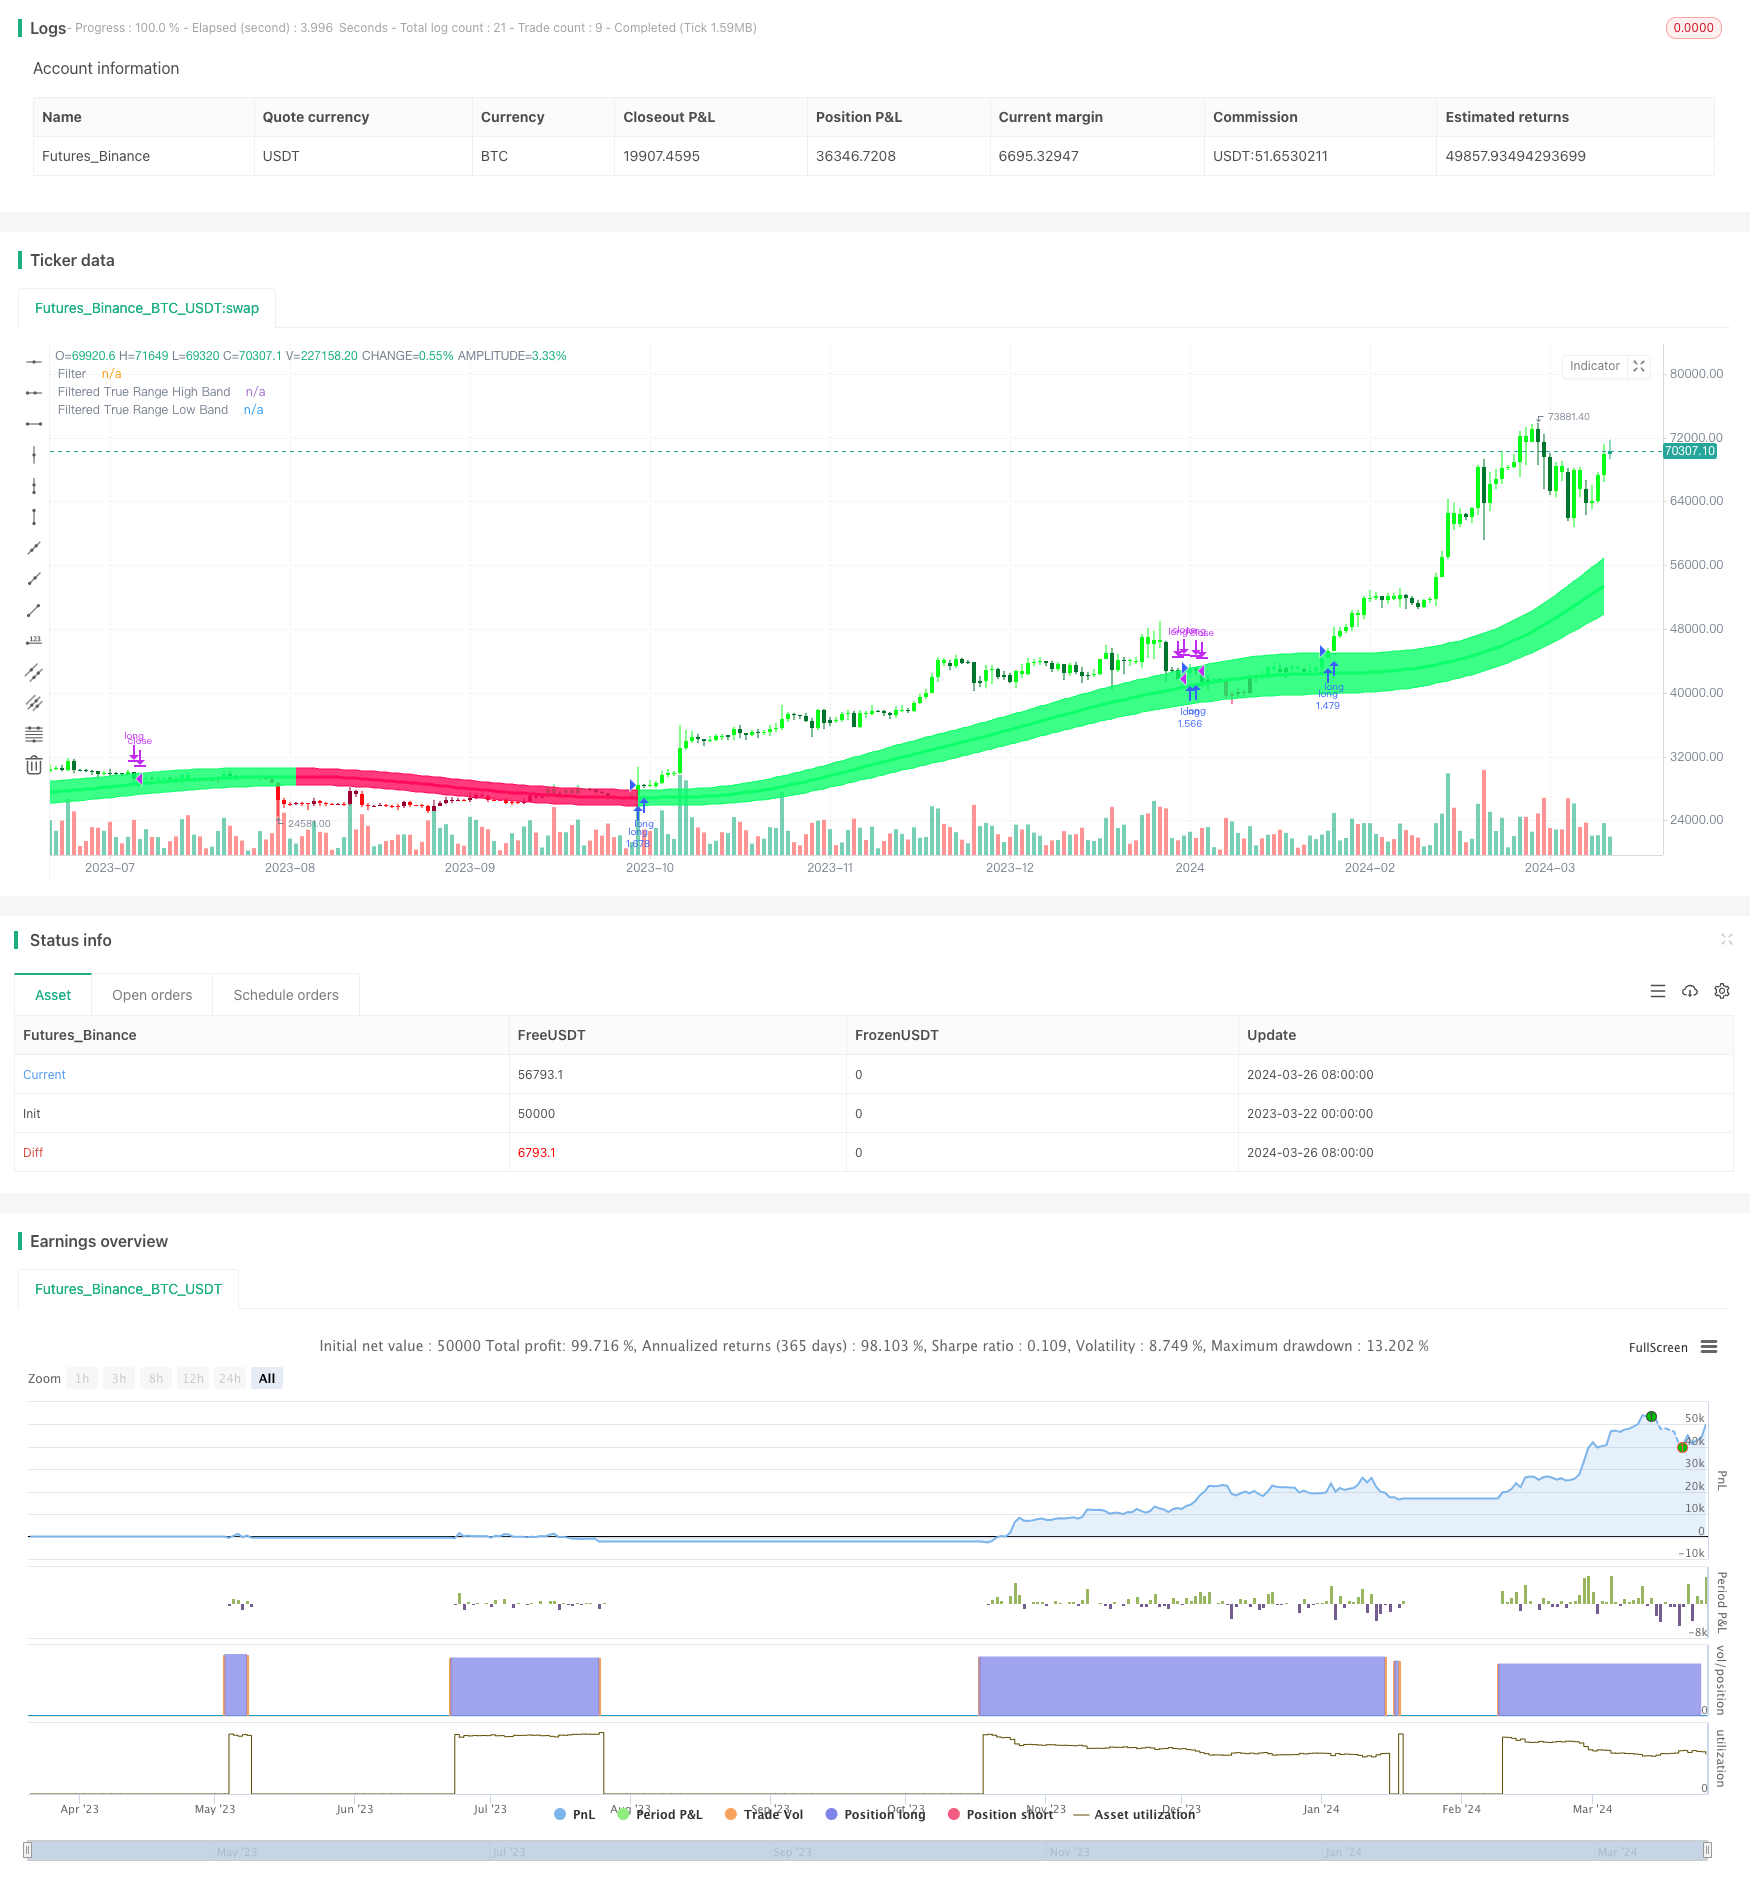
/*backtest
start: 2023-03-22 00:00:00
end: 2024-03-27 00:00:00
period: 1d
basePeriod: 1h
exchanges: [{"eid":"Futures_Binance","currency":"BTC_USDT"}]
*/

//@version=4
strategy(title="Gaussian Channel Strategy v1.0", overlay=true, calc_on_every_tick=false, initial_capital=10000, default_qty_type=strategy.percent_of_equity, default_qty_value=100, commission_type=strategy.commission.percent, commission_value=0.1)

// Date condition inputs
startDate = input(title="Date Start", type=input.time, defval=timestamp("1 Jan 2018 00:00 +0000"), group="Dates")
endDate = input(title="Date End", type=input.time, defval=timestamp("31 Dec 2060 23:59 +0000"), group="Dates")
timeCondition = true

// This study is an experiment utilizing the Ehlers Gaussian Filter technique combined with lag reduction techniques and true range to analyze trend activity.
// Gaussian filters, as Ehlers explains it, are simply exponential moving averages applied multiple times.
// First, beta and alpha are calculated based on the sampling period and number of poles specified. The maximum number of poles available in this script is 9.
// Next, the data being analyzed is given a truncation option for reduced lag, which can be enabled with "Reduced Lag Mode".
// Then the alpha and source values are used to calculate the filter and filtered true range of the dataset.
// Filtered true range with a specified multiplier is then added to and subtracted from the filter, generating a channel.
// Lastly, a one pole filter with a N pole alpha is averaged with the filter to generate a faster filter, which can be enabled with "Fast Response Mode".

//Custom bar colors are included.

//Note: Both the sampling period and number of poles directly affect how much lag the indicator has, and how smooth the output is.
//      Larger inputs will result in smoother outputs with increased lag, and smaller inputs will have noisier outputs with reduced lag.
//      For the best results, I recommend not setting the sampling period any lower than the number of poles + 1. Going lower truncates the equation.

//-----------------------------------------------------------------------------------------------------------------------------------------------------------------
//Updates:
// Huge shoutout to @e2e4mfck for taking the time to improve the calculation method!
// -> migrated to v4
// -> pi is now calculated using trig identities rather than being explicitly defined.
// -> The filter calculations are now organized into functions rather than being individually defined.
// -> Revamped color scheme.

//-----------------------------------------------------------------------------------------------------------------------------------------------------------------
//Functions - courtesy of @e2e4mfck
//-----------------------------------------------------------------------------------------------------------------------------------------------------------------

//Filter function
f_filt9x (_a, _s, _i) =>
    int _m2 = 0, int _m3 = 0, int _m4 = 0, int _m5 = 0, int _m6 = 0,
    int _m7 = 0, int _m8 = 0, int _m9 = 0, float _f = .0, _x = (1 - _a)
    // Weights.
    // Initial weight _m1 is a pole number and equal to _i
    _m2 := _i == 9 ? 36  : _i == 8 ? 28 : _i == 7 ? 21 : _i == 6 ? 15 : _i == 5 ? 10 : _i == 4 ? 6 : _i == 3 ? 3 : _i == 2 ? 1 : 0
    _m3 := _i == 9 ? 84  : _i == 8 ? 56 : _i == 7 ? 35 : _i == 6 ? 20 : _i == 5 ? 10 : _i == 4 ? 4 : _i == 3 ? 1 : 0
    _m4 := _i == 9 ? 126 : _i == 8 ? 70 : _i == 7 ? 35 : _i == 6 ? 15 : _i == 5 ? 5  : _i == 4 ? 1 : 0
    _m5 := _i == 9 ? 126 : _i == 8 ? 56 : _i == 7 ? 21 : _i == 6 ? 6  : _i == 5 ? 1  : 0
    _m6 := _i == 9 ? 84  : _i == 8 ? 28 : _i == 7 ? 7  : _i == 6 ? 1  : 0
    _m7 := _i == 9 ? 36  : _i == 8 ? 8  : _i == 7 ? 1  : 0
    _m8 := _i == 9 ? 9   : _i == 8 ? 1  : 0
    _m9 := _i == 9 ? 1   : 0
    // filter
    _f :=   pow(_a, _i) * nz(_s) +
      _i  *     _x      * nz(_f[1])      - (_i >= 2 ?
      _m2 * pow(_x, 2)  * nz(_f[2]) : 0) + (_i >= 3 ?
      _m3 * pow(_x, 3)  * nz(_f[3]) : 0) - (_i >= 4 ?
      _m4 * pow(_x, 4)  * nz(_f[4]) : 0) + (_i >= 5 ?
      _m5 * pow(_x, 5)  * nz(_f[5]) : 0) - (_i >= 6 ?
      _m6 * pow(_x, 6)  * nz(_f[6]) : 0) + (_i >= 7 ?
      _m7 * pow(_x, 7)  * nz(_f[7]) : 0) - (_i >= 8 ?
      _m8 * pow(_x, 8)  * nz(_f[8]) : 0) + (_i == 9 ?
      _m9 * pow(_x, 9)  * nz(_f[9]) : 0)

//9 var declaration fun
f_pole (_a, _s, _i) =>
    _f1 =            f_filt9x(_a, _s, 1),      _f2 = (_i >= 2 ? f_filt9x(_a, _s, 2) : 0), _f3 = (_i >= 3 ? f_filt9x(_a, _s, 3) : 0)
    _f4 = (_i >= 4 ? f_filt9x(_a, _s, 4) : 0), _f5 = (_i >= 5 ? f_filt9x(_a, _s, 5) : 0), _f6 = (_i >= 6 ? f_filt9x(_a, _s, 6) : 0)
    _f7 = (_i >= 2 ? f_filt9x(_a, _s, 7) : 0), _f8 = (_i >= 8 ? f_filt9x(_a, _s, 8) : 0), _f9 = (_i == 9 ? f_filt9x(_a, _s, 9) : 0)
    _fn = _i == 1 ? _f1 : _i == 2 ? _f2 : _i == 3 ? _f3 :
      _i == 4     ? _f4 : _i == 5 ? _f5 : _i == 6 ? _f6 :
      _i == 7     ? _f7 : _i == 8 ? _f8 : _i == 9 ? _f9 : na
    [_fn, _f1]

//-----------------------------------------------------------------------------------------------------------------------------------------------------------------
//Inputs
//-----------------------------------------------------------------------------------------------------------------------------------------------------------------

//Source
src = input(defval=hlc3, title="Source")

//Poles
int N = input(defval=4, title="Poles", minval=1, maxval=9)

//Period
int per = input(defval=144, title="Sampling Period", minval=2)

//True Range Multiplier
float mult = input(defval=1.414, title="Filtered True Range Multiplier", minval=0)

//Lag Reduction
bool modeLag  = input(defval=false, title="Reduced Lag Mode")
bool modeFast = input(defval=false, title="Fast Response Mode")

//-----------------------------------------------------------------------------------------------------------------------------------------------------------------
//Definitions
//-----------------------------------------------------------------------------------------------------------------------------------------------------------------

//Beta and Alpha Components
beta  = (1 - cos(4*asin(1)/per)) / (pow(1.414, 2/N) - 1)
alpha = - beta + sqrt(pow(beta, 2) + 2*beta)

//Lag
lag = (per - 1)/(2*N)

//Data
srcdata = modeLag ? src + (src - src[lag]) : src
trdata  = modeLag ? tr(true) + (tr(true) - tr(true)[lag]) : tr(true)

//Filtered Values
[filtn, filt1]     = f_pole(alpha, srcdata, N)
[filtntr, filt1tr] = f_pole(alpha, trdata,  N)

//Lag Reduction
filt   = modeFast ? (filtn + filt1)/2 : filtn
filttr = modeFast ? (filtntr + filt1tr)/2 : filtntr

//Bands
hband = filt + filttr*mult
lband = filt - filttr*mult

// Colors
color1   = #0aff68
color2   = #00752d
color3   = #ff0a5a
color4   = #990032
fcolor   = filt > filt[1] ? #0aff68 : filt < filt[1] ? #ff0a5a : #cccccc
barcolor = (src > src[1]) and (src > filt) and (src < hband) ? #0aff68 : (src > src[1]) and (src >= hband) ? #0aff1b : (src <= src[1]) and (src > filt) ? #00752d :
           (src < src[1]) and (src < filt) and (src > lband) ? #ff0a5a : (src < src[1]) and (src <= lband) ? #ff0a11 : (src >= src[1]) and (src < filt) ? #990032 : #cccccc

//-----------------------------------------------------------------------------------------------------------------------------------------------------------------
//Outputs
//-----------------------------------------------------------------------------------------------------------------------------------------------------------------

//Filter Plot
filtplot = plot(filt, title="Filter", color=fcolor, linewidth=3)

//Band Plots
hbandplot = plot(hband, title="Filtered True Range High Band", color=fcolor)
lbandplot = plot(lband, title="Filtered True Range Low Band", color=fcolor)

//Channel Fill
fill(hbandplot, lbandplot, title="Channel Fill", color=fcolor, transp=80)

//Bar Color
barcolor(barcolor)


longCondition = crossover(close, hband) and timeCondition
closeAllCondition = crossunder(close, hband) and timeCondition

if longCondition
    strategy.entry("long", strategy.long)

if closeAllCondition
    strategy.close("long")