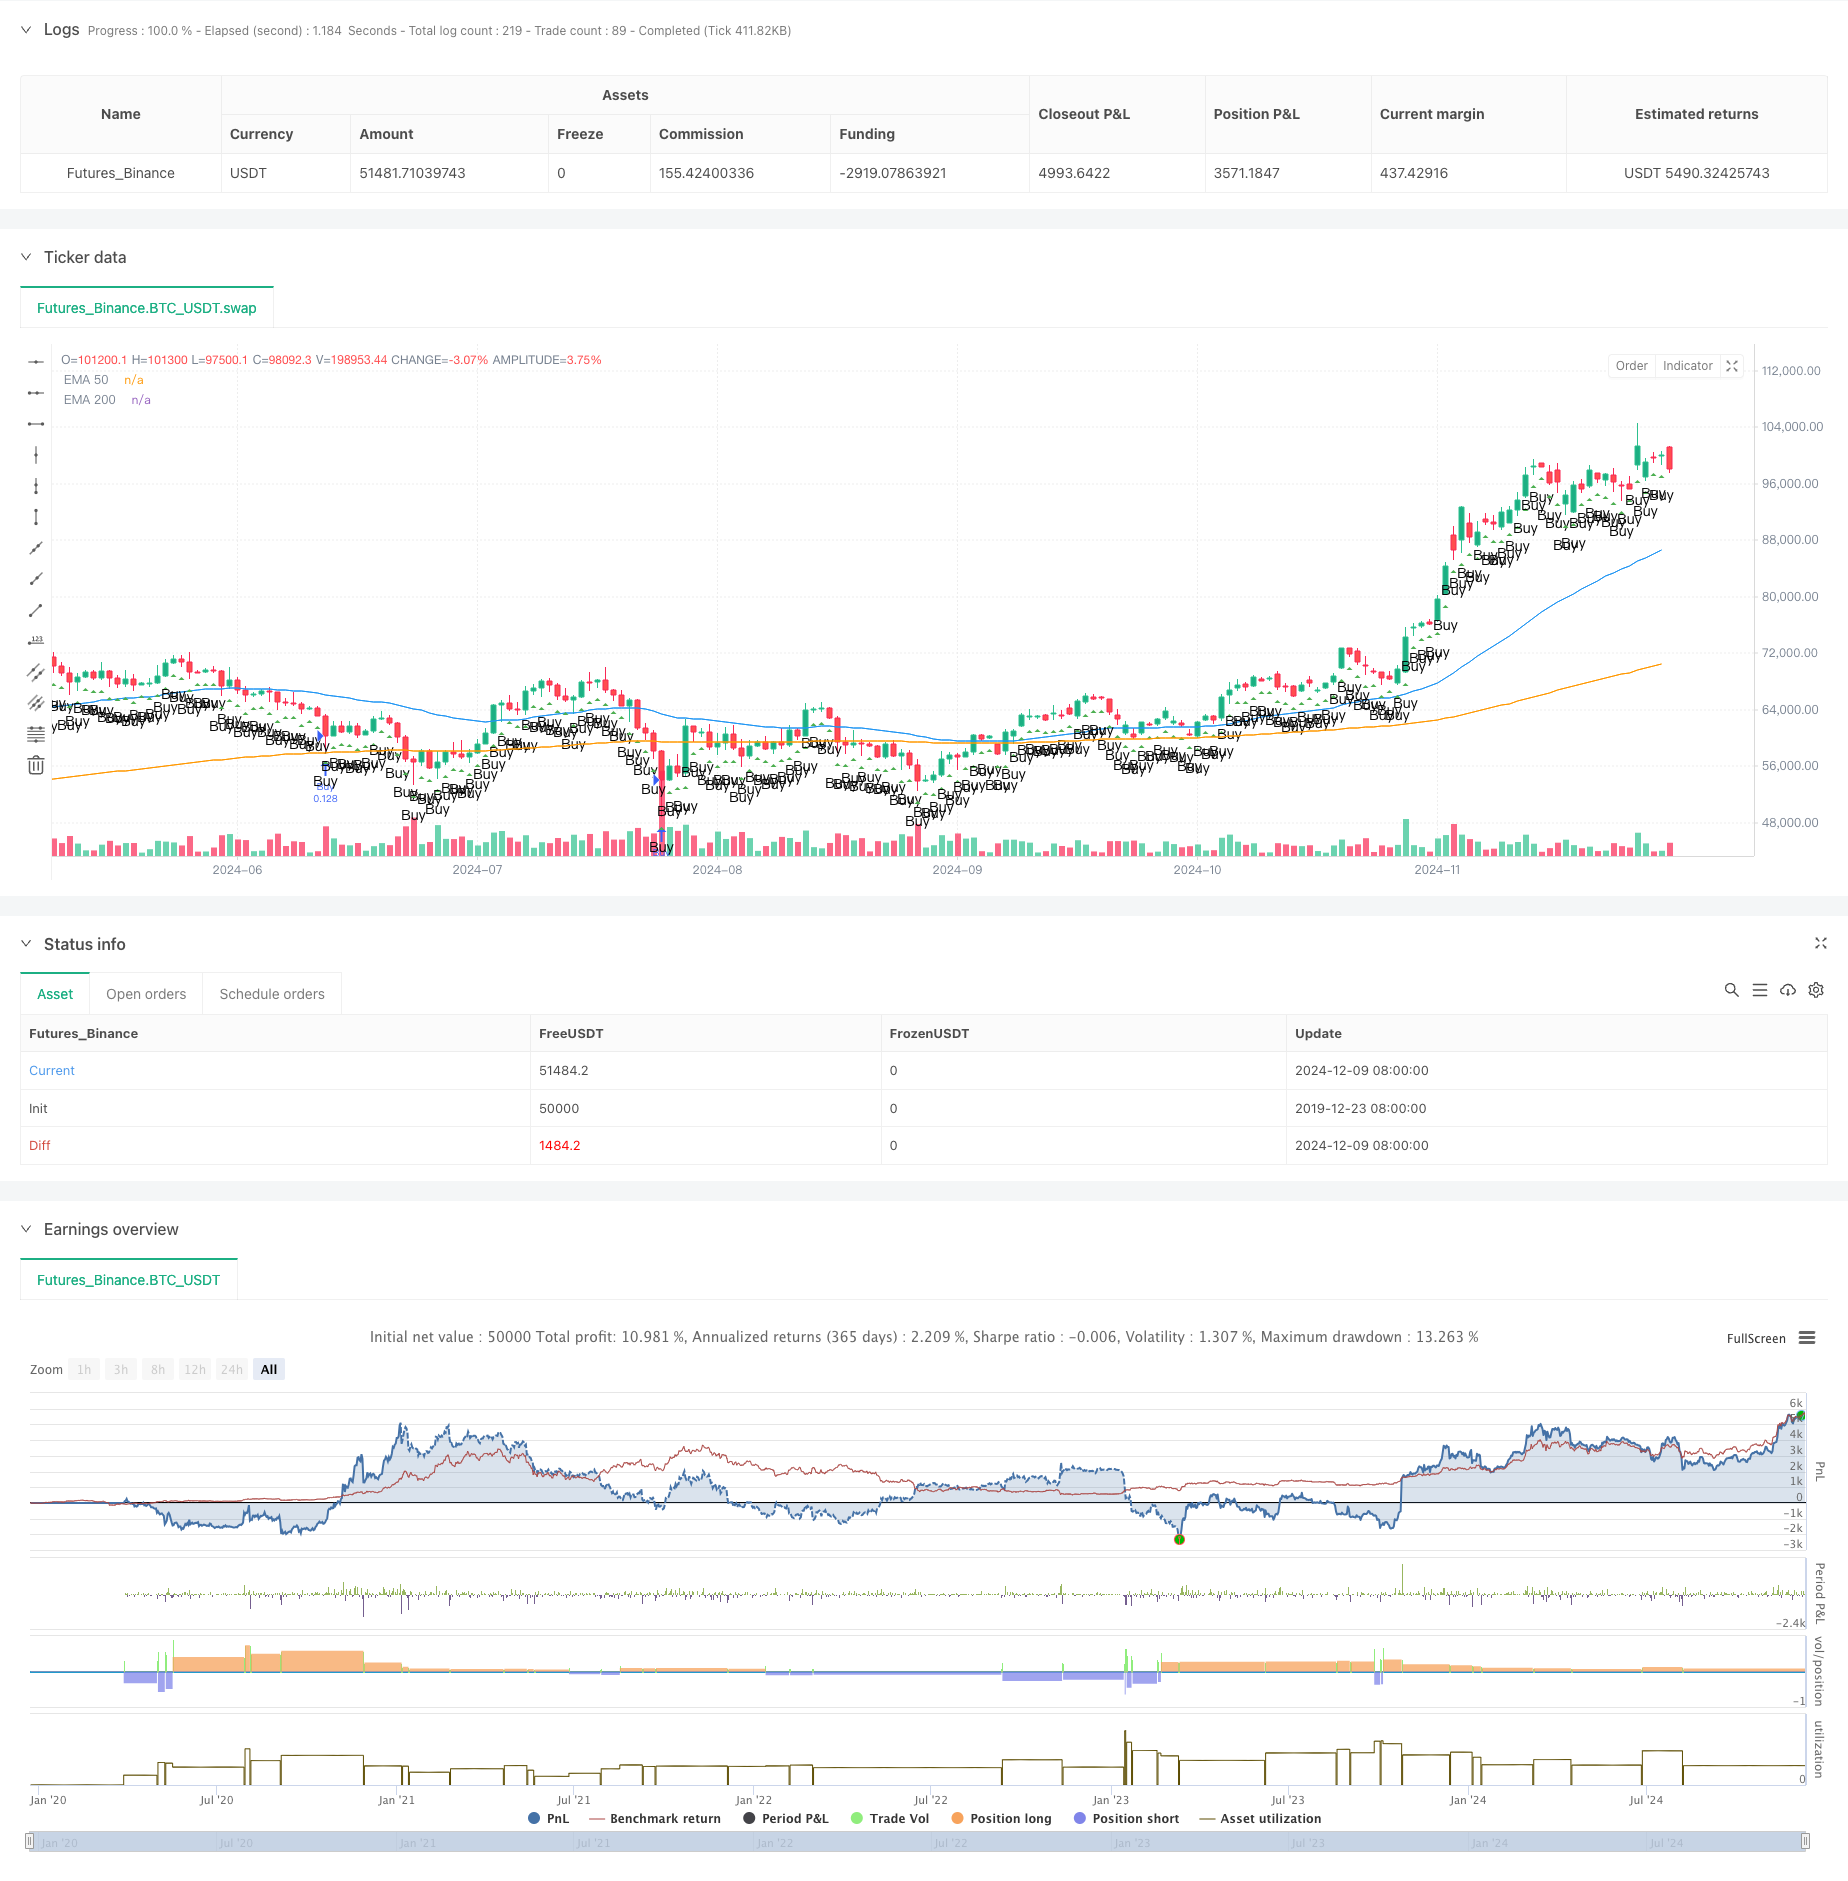
Aperçu
Il s’agit d’une stratégie de suivi dynamique des tendances ATR basée sur la rupture des supports. Cette stratégie utilise le système de courbe moyenne EMA, les indicateurs de volatilité ATR et le concept de fonds intelligents (SMC) pour capturer les tendances du marché. La stratégie permet une bonne gestion des risques en calculant dynamiquement la taille de la position et la position de stop-loss.
Principe de stratégie
La stratégie est basée sur les éléments suivants:
- Utilisation d’un système de ligne moyenne EMA de 50 et 200 cycles pour confirmer la direction de la tendance du marché
- Modification dynamique des objectifs de stop loss et de profit à l’aide de l’indicateur ATR
- Trouver les meilleurs points d’entrée en analysant les blocs d’ordre et les zones d’imbalance
- Calcul automatique du montant de la position sur la base du pourcentage de risque du compte
- Pour déterminer si le marché est en phase de consolidation, on observe une gamme de fluctuations de près de 20 lignes K.
Avantages stratégiques
- Gestion des risques: les risques de chaque transaction sont contrôlables grâce à des calculs dynamiques
- Le système de détection des tendances est fiable et permet d’éviter les opérations de stockage
- Le stop-loss est raisonnable et le rapport risque/bénéfice est de 1:3
- Prendre en compte les fluctuations du marché et s’adapter aux différentes conditions
- La structure du code est claire, facile à entretenir et à optimiser
Risque stratégique
- Les indicateurs EMA sont en retard et peuvent entraîner des retards dans l’entrée en bourse
- Des signaux erronés peuvent être déclenchés dans des marchés très volatils
- La stratégie dépend de la continuité de la tendance et peut être moins performante en cas de choc
- La position de stop-loss est large et peut supporter des pertes plus importantes dans certains cas.
Orientation de l’optimisation de la stratégie
- L’introduction de l’analyse quantitative-prix peut améliorer l’exactitude des tendances
- L’augmentation de l’indicateur de l’humeur du marché et l’optimisation du moment de l’entrée
- Considérer l’ajout d’analyses multi-cycle pour améliorer la stabilité du système
- Critères permettant d’affiner les blocs de commande et les zones de déséquilibre
- Optimiser la réduction des pertes et envisager une réduction mobile des pertes
Résumer
La stratégie est un système de suivi des tendances plus complet, qui améliore la stabilité des transactions grâce à une gestion des risques raisonnable et à la confirmation de plusieurs signaux. Bien qu’il y ait un certain retard, il s’agit d’un système de négociation fiable dans l’ensemble. Il est recommandé de procéder à une vérification complète des retours avant de l’utiliser sur le terrain et d’optimiser les paramètres en fonction de la variété de transactions et de l’environnement du marché.
/*backtest
start: 2019-12-23 08:00:00
end: 2024-12-10 08:00:00
period: 1d
basePeriod: 1d
exchanges: [{"eid":"Futures_Binance","currency":"BTC_USDT"}]
*/

// TradingView Pine Script strategy for Smart Money Concept (SMC)
//@version=5
strategy("Smart Money Concept Strategy", overlay=true, default_qty_type=strategy.fixed, default_qty_value=100)

// === Input Parameters ===
input_risk_percentage = input.float(1, title="Risk Percentage", step=0.1)
input_atr_length = input.int(14, title="ATR Length")
input_ema_short = input.int(50, title="EMA Short")
input_ema_long = input.int(200, title="EMA Long")

// === Calculations ===
atr = ta.atr(input_atr_length)
ema_short = ta.ema(close, input_ema_short)
ema_long = ta.ema(close, input_ema_long)

// === Utility Functions ===
// Identify Order Blocks
is_order_block(price, direction) =>
    ((high[1] > high[2] and low[1] > low[2] and direction == 1) or (high[1] < high[2] and low[1] < low[2] and direction == -1))

// Identify Imbalance Zones
is_imbalance() =>
    range_high = high[1]
    range_low = low[1]
    range_high > close and range_low < close

// Calculate Lot Size Based on Risk
calculate_lot_size(stop_loss_points, account_balance) =>
    risk_amount = account_balance * (input_risk_percentage / 100)
    lot_size = risk_amount / (stop_loss_points * syminfo.pointvalue)
    lot_size

// Determine if Market is Consolidating
is_consolidating() =>
    (ta.highest(high, 20) - ta.lowest(low, 20)) / atr < 2

// === Visual Enhancements ===
// Plot Order Blocks
// if is_order_block(close, 1)
//     line.new(x1=bar_index[1], y1=low[1], x2=bar_index, y2=low[1], color=color.green, width=2, extend=extend.right)
// if is_order_block(close, -1)
//     line.new(x1=bar_index[1], y1=high[1], x2=bar_index, y2=high[1], color=color.red, width=2, extend=extend.right)

// Highlight Imbalance Zones
// if is_imbalance()
//     box.new(left=bar_index[1], top=high[1], right=bar_index, bottom=low[1], bgcolor=color.new(color.orange, 80))

// === Logic for Trend Confirmation ===
is_bullish_trend = ema_short > ema_long
is_bearish_trend = ema_short < ema_long

// === Entry Logic ===
account_balance = strategy.equity
if not is_consolidating()
    if is_bullish_trend
        stop_loss = close - atr * 2
        take_profit = close + (math.abs(close - (close - atr * 2)) * 3)
        stop_loss_points = math.abs(close - stop_loss) / syminfo.pointvalue
        lot_size = calculate_lot_size(stop_loss_points, account_balance)
        strategy.entry("Buy", strategy.long, qty=lot_size)
        strategy.exit("TP/SL", "Buy", stop=stop_loss, limit=take_profit)

    if is_bearish_trend
        stop_loss = close + atr * 2
        take_profit = close - (math.abs(close - (close + atr * 2)) * 3)
        stop_loss_points = math.abs(close - stop_loss) / syminfo.pointvalue
        lot_size = calculate_lot_size(stop_loss_points, account_balance)
        strategy.entry("Sell", strategy.short, qty=lot_size)
        strategy.exit("TP/SL", "Sell", stop=stop_loss, limit=take_profit)

// === Plotting Indicators ===
plot(ema_short, color=color.blue, title="EMA 50")
plot(ema_long, color=color.orange, title="EMA 200")
plotshape(series=is_bullish_trend and not is_consolidating(), style=shape.triangleup, location=location.belowbar, color=color.green, text="Buy")
plotshape(series=is_bearish_trend and not is_consolidating(), style=shape.triangledown, location=location.abovebar, color=color.red, text="Sell")