EMA100 और NUPL सापेक्ष अवास्तविक लाभ मात्रात्मक व्यापार रणनीति
EMA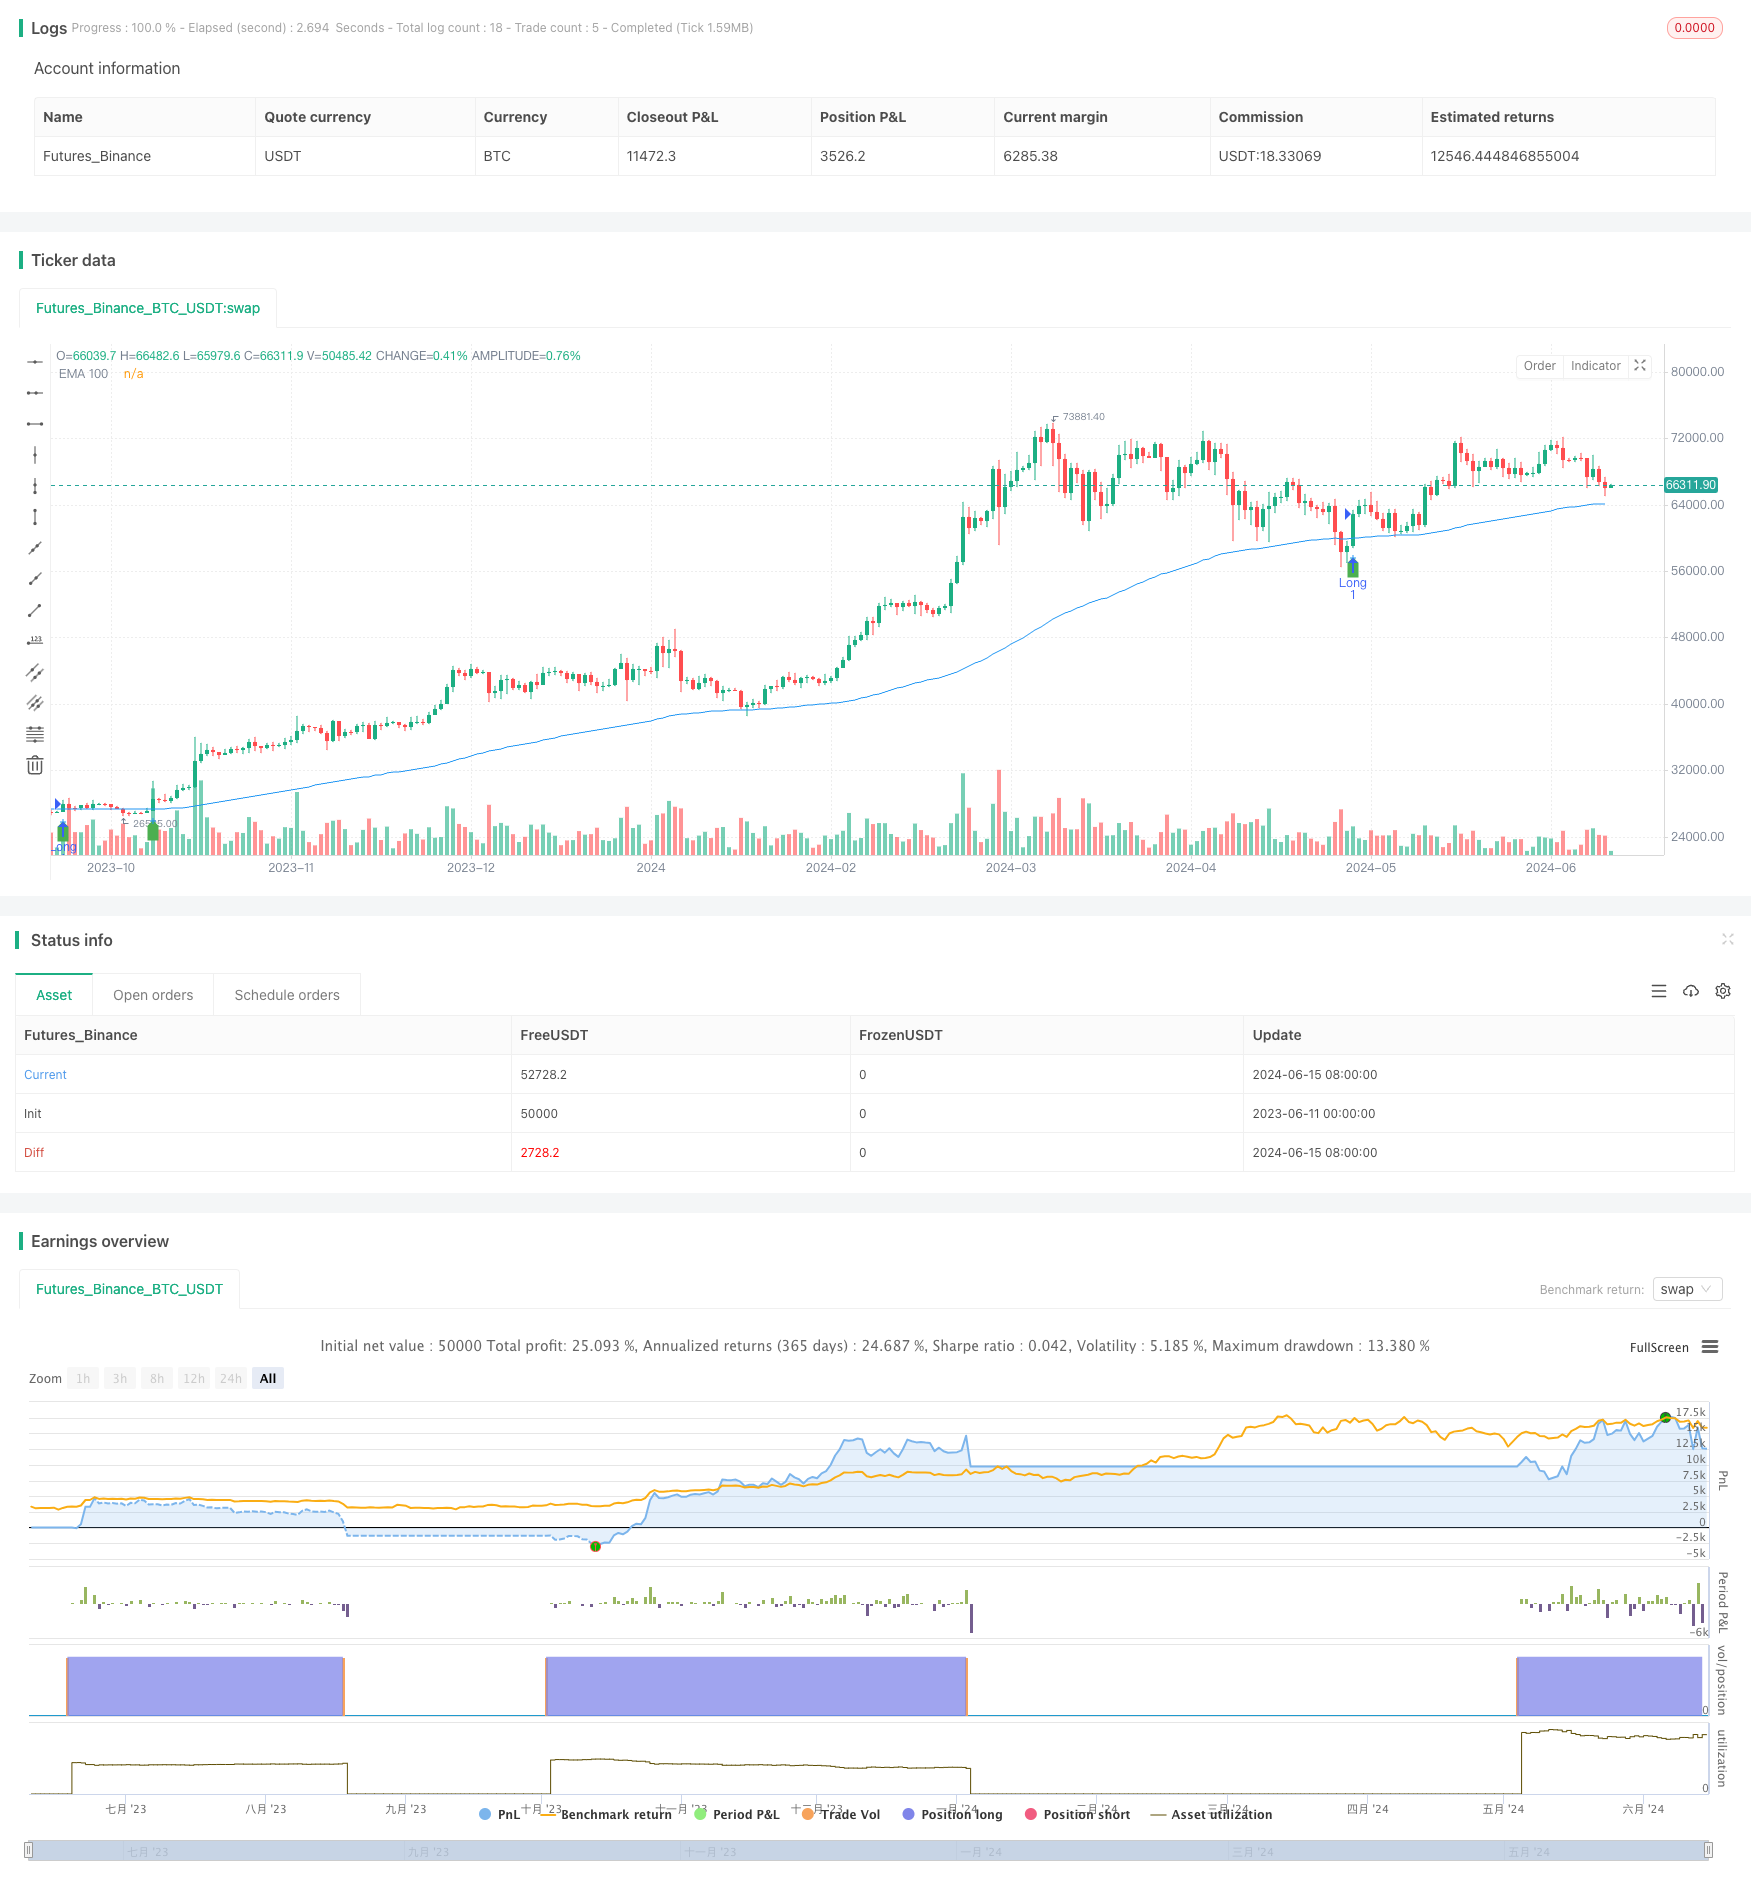
अवलोकन
यह ट्रेडिंग रणनीति 100 चक्र सूचकांक चलती औसत ((EMA100), शुद्ध अप्रयुक्त लाभ/हानि ((NUPL) और अपेक्षाकृत अप्रयुक्त लाभ के तीन संकेतकों पर आधारित है, जो ईएमए 100 के साथ कीमत के क्रॉसिंग और एनयूपीएल और अपेक्षाकृत अप्रयुक्त लाभ के लिए एक सकारात्मक नकारात्मक पर निर्णय करके एक ट्रेडिंग सिग्नल उत्पन्न करता है। जब ईएमए 100 और एनयूपीएल और अपेक्षाकृत अप्रयुक्त लाभ दोनों सही होते हैं तो एक मल्टी सिग्नल ट्रिगर किया जाता है; जब ईएमए 100 और एनयूपीएल और अपेक्षाकृत अप्रयुक्त लाभ दोनों नकारात्मक होते हैं तो एक शून्य सिग्नल ट्रिगर किया जाता है। यह रणनीति 10% की एक निश्चित स्थिति का उपयोग करती है और 10% की एक स्टॉप लॉस सेट करती है।
रणनीति सिद्धांत
- 100 चक्र ईएमए को मुख्य रुझान निर्धारक के रूप में गणना करना
- प्रवृत्ति की ताकत और स्थिरता की पुष्टि करने के लिए सहायक संकेतकों के रूप में एनयूपीएल और सापेक्ष अप्रयुक्त लाभ का उपयोग करना
- कीमतों के ईएमए 100 के ऊपर / नीचे के माध्यम से, एनयूपीएल और सापेक्ष अप्रत्याशित मुनाफे के साथ-साथ पॉजिटिव / नकारात्मक समय के लिए अधिक / कम संकेत उत्पन्न करते हैं
- 10% की स्थिर स्थिति के साथ 10% की रोकथाम, जोखिम नियंत्रण
- जब एक बहुमुखी स्थिति धारण करते हैं, तो यदि कीमत बंद कीमत से अधिक हो जाती है, तो बहुमुखी स्थिति को बंद कर दिया जाता है; जब एक खाली स्थिति रखते हैं, तो यदि कीमत बंद कीमत से अधिक हो जाती है, तो खाली स्थिति को बंद कर दिया जाता है
श्रेष्ठता विश्लेषण
- सरल और समझने में आसानः रणनीति का तर्क स्पष्ट है, सामान्य तकनीकी संकेतकों का उपयोग किया जाता है, इसे समझना और लागू करना आसान है
- ट्रेंड ट्रैकिंगः ईएमए 100 के माध्यम से प्रमुख रुझानों को पकड़ना, ट्रेंडिंग मार्केट में उपयोग के लिए उपयुक्त
- जोखिम नियंत्रणः जोखिम को प्रभावी ढंग से नियंत्रित करने के लिए एक निश्चित स्थिति और स्टॉप सेट करें
- लचीलापनः यह रणनीति विभिन्न बाजारों और ट्रेडिंग मापदंडों पर लागू होती है
जोखिम विश्लेषण
- झूठे संकेतः अस्थिर बाजारों में, ईएमए 100 के साथ कीमतों के लगातार क्रॉसिंग से अधिक झूठे संकेत उत्पन्न हो सकते हैं, जिससे नुकसान हो सकता है
- पिछड़ापनः ईएमए एक पिछड़ा सूचक के रूप में, प्रवृत्ति में बदलाव के दौरान धीमी प्रतिक्रिया, सबसे अच्छा प्रवेश समय से चूक सकता है
- पैरामीटर अनुकूलनः रणनीति पैरामीटर (जैसे ईएमए चक्र, स्थिति आकार, स्टॉप लॉस अनुपात) को विभिन्न बाजारों के लिए अनुकूलित करने की आवश्यकता होती है, अनुचित पैरामीटर से रणनीति खराब हो सकती है
अनुकूलन दिशा
- पैरामीटर अनुकूलनः ईएमए चक्र, स्थिति आकार, स्टॉप-लॉस अनुपात और अन्य पैरामीटर का अनुकूलन करें ताकि रणनीति के प्रदर्शन को बेहतर बनाया जा सके
- फ़िल्टर सिग्नलः अन्य तकनीकी या बाजार भावना के संकेतकों को जोड़ना, झूठे संकेतों को फ़िल्टर करना
- गतिशील पोजीशन प्रबंधनः बाजार में उतार-चढ़ाव, खाता घाटा आदि के आधार पर स्थिति को गतिशील रूप से समायोजित करना, रिटर्न बढ़ाने और जोखिम को नियंत्रित करना
- मल्टी-फ्रेम पोर्टफोलियोः एक साथ बहु और खाली पदों को पकड़ना, बाजार जोखिम को कवर करना, रणनीतिक स्थिरता में सुधार करना
संक्षेप
ट्रेडिंग रणनीति EMA100, NUPL और अपेक्षाकृत अप्रत्याशित लाभ के तीन संकेतकों के माध्यम से ट्रेडिंग सिग्नल उत्पन्न करती है, जिसमें तर्क स्पष्टता, जोखिम नियंत्रण और अनुकूलन क्षमता के फायदे शामिल हैं। इसके अलावा, झूठे संकेत, पिछड़ेपन और पैरामीटर अनुकूलन जैसे जोखिम भी हैं। भविष्य में पैरामीटर अनुकूलन, सिग्नल फ़िल्टरिंग, गतिशील स्थिति प्रबंधन और बहुआयामी संयोजन जैसे तरीकों से रणनीति को अनुकूलित और उन्नत किया जा सकता है।
/*backtest
start: 2023-06-11 00:00:00
end: 2024-06-16 00:00:00
period: 1d
basePeriod: 1h
exchanges: [{"eid":"Futures_Binance","currency":"BTC_USDT"}]
*/

//@version=5
strategy("Scalping Strategy with EMA 100, NUPL, and Relative Unrealized Profit", overlay=true)

// Input for EMA period
emaPeriod = input.int(100, title="EMA Period", minval=1)
ema100 = ta.ema(close, emaPeriod)
plot(ema100, color=color.blue, title="EMA 100")

// Placeholder function for NUPL (Net Unrealized Profit/Loss)
// Replace this with actual NUPL data or calculation
NUPL = close * 0.0001 // Dummy calculation

// Placeholder function for relative unrealized profit
// Replace this with actual relative unrealized profit data or calculation
relativeUnrealizedProfit = close * 0.0001 // Dummy calculation

// Define conditions for long and short entries
longCondition = ta.crossover(close, ema100) and NUPL > 0 and relativeUnrealizedProfit > 0
shortCondition = ta.crossunder(close, ema100) and NUPL < 0 and relativeUnrealizedProfit < 0

// Plot buy and sell signals on the chart
plotshape(series=longCondition, location=location.belowbar, color=color.green, style=shape.labelup, title="Buy Signal")
plotshape(series=shortCondition, location=location.abovebar, color=color.red, style=shape.labeldown, title="Sell Signal")

// Calculate stop loss levels
longStopLoss = close * 0.90
shortStopLoss = close * 1.10

// Strategy entry and exit rules
if (longCondition)
    strategy.entry("Long", strategy.long, stop=longStopLoss)

if (shortCondition)
    strategy.entry("Short", strategy.short, stop=shortStopLoss)

// Set stop loss levels for active positions
if (strategy.position_size > 0)
    strategy.exit("Exit Long", "Long", stop=longStopLoss)
if (strategy.position_size < 0)
    strategy.exit("Exit Short", "Short", stop=shortStopLoss)

// Alerts for long and short entries
alertcondition(longCondition, title="Long Entry Alert", message="Long entry signal based on EMA 100, NUPL, and relative unrealized profit")
alertcondition(shortCondition, title="Short Entry Alert", message="Short entry signal based on EMA 100, NUPL, and relative unrealized profit")

// Visualize the entry conditions
plotshape(series=longCondition, location=location.belowbar, color=color.blue, style=shape.cross, title="Long Condition")
plotshape(series=shortCondition, location=location.abovebar, color=color.red, style=shape.cross, title="Short Condition")