Strategi Hedge Spot Cryptocurrency (2)
Penulis:Ninabadass, Dibuat: 2022-04-14 16:17:46, Diperbarui: 2022-04-15 14:16:23Strategi Hedge Spot Cryptocurrency (2)
Dalam artikel sebelumnya, kita menerapkan strategi lindung nilai sederhana bersama, dan kemudian kita akan belajar bagaimana untuk meningkatkan strategi. Ada sedikit perubahan dalam strategi, tetapi rincian perubahan perlu diperhatikan. Definisi beberapa tempat dalam kode telah dimodifikasi, dibandingkan dengan yang sebelumnya, yang perlu dipahami secara khusus.
Persyaratan untuk Meningkatkan Strategi
- Ganti mode margin objek pertukaran spot Modifikasi ini hanya terkait dengan bot. Beberapa platform spot memiliki antarmuka margin spot, yang juga terkapsul pada FMZ. Untuk objek pertukaran yang langsung terkapsul pada FMZ dan mendukung margin spot, Anda dapat langsung beralih mode.
- Tambahkan lebih banyak tampilan grafik spread
Untuk menambahkan lebih banyak tampilan grafik spread, dan kita hanya memetakan kurva spread dari
A->BdanB->A, serta garis pemicu penyebaran horizontal, kita dapat langsung menggunakanchart plot libraryDari sini, kita juga belajar bagaimana menggunakan fungsi FMZtemplate librarytogether. - Fungsi lindung nilai satu sisi Perubahan ini relatif besar, karena sulit untuk sepenuhnya membalikkan spread harga antara kedua platform selama perdagangan lindung nilai tertentu. Sebagian besar waktu, harga di satu platform secara konsisten lebih tinggi daripada harga di platform lain. Pada saat ini, jika aset kita telah sepenuhnya dilindung nilai (yaitu, semua simbol mata uang berada di platform dengan harga yang lebih rendah, dan aset berada di platform dengan harga yang lebih tinggi). lindung nilai stagnan, dan tidak lagi mungkin bergantung pada volatilitas spread untuk menghasilkan keuntungan. Pada saat ini, Anda perlu membuat strategi untuk lindung nilai dan mengembalikan simbol mata uang kembali hanya dengan kehilangan sedikit aset (biarkan simbol mata uang kembali ke platform dengan harga yang lebih tinggi lagi).
- Mengubah secara interaktif parameter seperti garis penyebaran lindung nilai
Tambahkan fungsi interaktif ke strategi, sehingga memodifikasi garis pemicu spread secara real time. - Mengelola informasi bilah status dan menampilkannya dalam format tabel Mengatur dan mengelola data yang perlu ditampilkan, untuk pengamatan yang nyaman.
Selanjutnya, mari kita mewujudkan ide desain satu per satu.
Ganti mode margin objek pertukaran spot
Ambil Binance spot bot sebagai contoh. Untuk beralih ke mode margin spot, gunakan kodeexchanges[i].IO, mengimpor parametertrade_normaluntuk beralih ke margin terisolasi, dan importrade_super_marginuntuk beralih ke cross margin, yang tidak didukung dalam backtest. yang hanya dapat digunakan dalam bot.
Dalam persiapan pada awalmainfungsi, tambahkan:
    // switch the margin mode
    for (var i = 0 ; i < exchanges.length ; i++) {   // traverse and detect all exchange objects added
        if (exchanges[i].GetName() == "Binance" && marginType != 0) {   // if the exchange object represented by the current index i is Binance Spot, and the parameter marginType on the strategy interface is not selected as the "common spot" option, execute the switch
            if (marginType == 1) {
                Log(exchanges[i].GetName(), "set to isolated margin")
                exchanges[i].IO("trade_normal")
            } else if (marginType == 2) {
                Log(exchanges[i].GetName(), "set to cross margin")
                exchanges[i].IO("trade_super_margin")
            }
        }
    }
Strategi di sini hanya menambahkan kode untuk beralih ke mode margin spot Binance Spot, jadi pengaturan switch dalam parameter strategi hanya bekerja untuk Binance Spot.
Tambahkan lebih banyak tampilan grafik spread
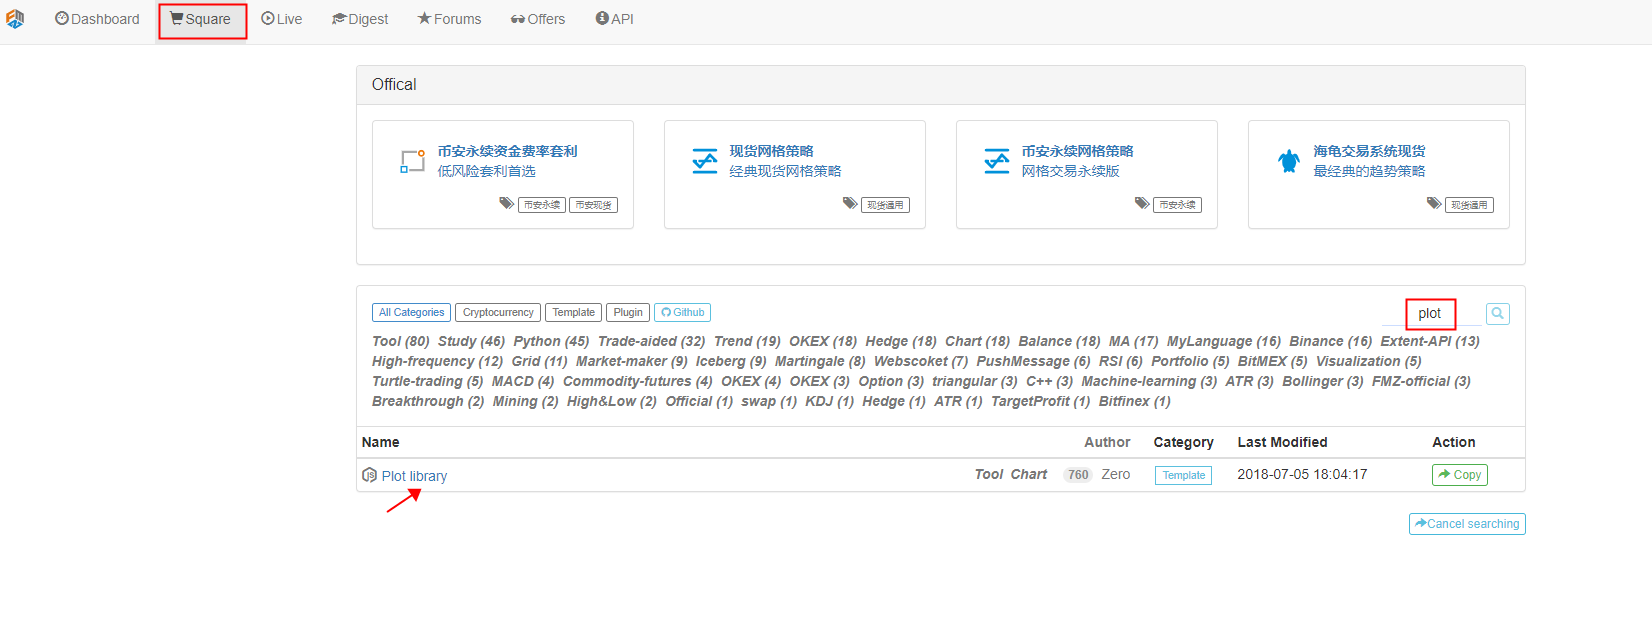
Menggunakan templat plot yang terkapsul sangat sederhana. nama template yang kita gunakan di sini adalahchart plot LibraryAnda bisa langsung mencarinya di platform Square of FMZ.

Atau Anda bisa langsung mengklik link:https://www.fmz.com/strategy/27293untuk melompat ke halaman salinan template.

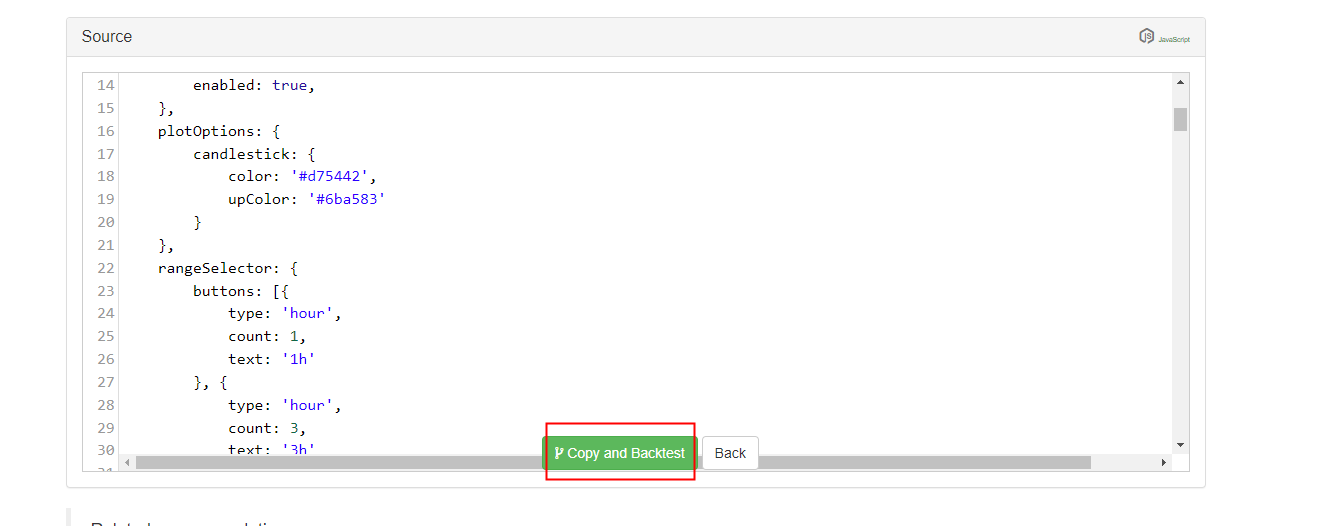
Klik tombol dan Anda dapat dengan mudah menyalin template ke perpustakaan strategi Anda sendiri.

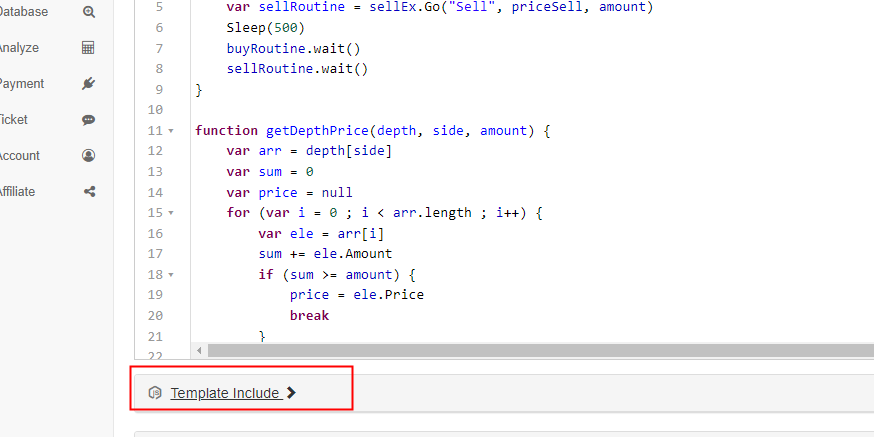
Kemudian, di halaman pengeditan strategi, Anda dapat memeriksa perpustakaan template yang akan digunakan di kolom template. Simpan strategi setelah memeriksa, dan strategi akan menggunakan template ini. Ini hanya deskripsi singkat tentang penggunaan perpustakaan template. Karena strategi telah merujuk template ini, tidak perlu mengulangi operasi. Ketika Anda menyalin kode strategi di Square, Anda dapat melihat bahwachart plot Librarytelah dirujuk di bilah templat dari halaman editing strategi.
Di sini kita terutama belajar bagaimana menggunakan fungsi darichart plot libraryuntuk merencanakan.

Kami berencana untuk merencanakan penyebaranA->BdanB->A, dan garis pemicu spread. kita perlu memetakan dua kurva (saat ini, spread dari A ke B dan B ke A), dan dua garis horizontal (line pemicu spread), seperti yang ditunjukkan pada gambar di atas.
Karena kita ingin merancang pager satu sisi, garis pemicu dariA->BdanB->Aakan berbeda, dan kita tidak bisa menggunakan desain dalam artikel sebelumnya.
Dalam artikel sebelumnya:
      var targetDiffPrice = hedgeDiffPrice
      if (diffAsPercentage) {
          targetDiffPrice = (depthA.Bids[0].Price + depthB.Asks[0].Price + depthB.Bids[0].Price + depthA.Asks[0].Price) / 4 * hedgeDiffPercentage
      }
Hanya ada satu penyebaran yang dipicutargetDiffPriceAku tidak tahu.
Oleh karena itu, di sini kita perlu memodifikasi kode, dan kita perlu memodifikasi parameter pertama.

Kemudian, ubah kode:
        var targetDiffPriceA2B = hedgeDiffPriceA2B
        var targetDiffPriceB2A = hedgeDiffPriceB2A
        if (diffAsPercentage) {
            targetDiffPriceA2B = (depthA.Bids[0].Price + depthB.Asks[0].Price + depthB.Bids[0].Price + depthA.Asks[0].Price) / 4 * hedgeDiffPercentageA2B
            targetDiffPriceB2A = (depthA.Bids[0].Price + depthB.Asks[0].Price + depthB.Bids[0].Price + depthA.Asks[0].Price) / 4 * hedgeDiffPercentageB2A
        }
Dengan demikian, garis pemicu spread telah berubah dari yang sebelumnyatargetDiffPriceke dua, yaitutargetDiffPriceA2BdantargetDiffPriceB2AAku tidak tahu.
Selanjutnya, Anda dapat menggunakan fungsi grafik plot perpustakaan grafik plot untuk menggambar data pada grafik.
        // plot
        $.PlotHLine(targetDiffPriceA2B, "A->B")  // the first parameter of the function is the value of the horizontal line in the Y-axis direction, and the second parameter is the display text
        $.PlotHLine(targetDiffPriceB2A, "B->A")
Ketika strategi dijalankan, grafik akan ditampilkan seperti ini.

Selanjutnya, gambar kurva spread real-time; untuk menghindari overdrawing, menempatkan kode yang memetakan kurva spread real-time dalam deteksi saldo. s
        if (ts - lastKeepBalanceTS > keepBalanceCyc * 1000) {
            nowAccs = _C(updateAccs, exchanges)
            var isBalance = keepBalance(initAccs, nowAccs, [depthA, depthB])
            cancelAll()
            if (isBalance) {
                lastKeepBalanceTS = ts
                if (isTrade) {
                    var nowBalance = _.reduce(nowAccs, function(sumBalance, acc) {return sumBalance + acc.Balance}, 0)
                    var initBalance = _.reduce(initAccs, function(sumBalance, acc) {return sumBalance + acc.Balance}, 0)
                    LogProfit(nowBalance - initBalance, nowBalance, initBalance, nowAccs)
                    isTrade = false
                }
            }

            $.PlotLine("A2B", depthA.Bids[0].Price - depthB.Asks[0].Price)  // plot real-time spread curves
            $.PlotLine("B2A", depthB.Bids[0].Price - depthA.Asks[0].Price)  // the first parameter is the curve name, and the second parameter is the curve value at the current moment, that is, the value in the Y-axis direction at the current moment
        }
Kode plot hanya membutuhkan 4 baris untuk memungkinkan strategi dengan tampilan grafik selama berjalan.
Fungsi Hedge Sisi Satu
Seperti yang disebutkan di atas, nomor garis pemicu spread telah diubah menjadi dua, yang masing-masing mengontrol pemicu lindung nilai dariA->BdanB->ADengan cara ini, algoritma harga pesanan sebelumnya tidak dapat digunakan, dan metode penambahan harga slide ke harga pasar digunakan sebagai gantinya.
        if (depthA.Bids[0].Price - depthB.Asks[0].Price > targetDiffPriceA2B && Math.min(depthA.Bids[0].Amount, depthB.Asks[0].Amount) >= minHedgeAmount) {          // A->B market condition satisfied
            var priceSell = depthA.Bids[0].Price - slidePrice
            var priceBuy = depthB.Asks[0].Price + slidePrice
            var amount = Math.min(depthA.Bids[0].Amount, depthB.Asks[0].Amount)
            if (nowAccs[0].Stocks > minHedgeAmount && nowAccs[1].Balance * 0.8 / priceSell > minHedgeAmount) {
                amount = Math.min(amount, nowAccs[0].Stocks, nowAccs[1].Balance * 0.8 / priceSell, maxHedgeAmount)
                Log("triggerA->B:", depthA.Bids[0].Price - depthB.Asks[0].Price, priceBuy, priceSell, amount, nowAccs[1].Balance * 0.8 / priceSell, nowAccs[0].Stocks)  // prompt message
                hedge(exB, exA, priceBuy, priceSell, amount)
                cancelAll()
                lastKeepBalanceTS = 0
                isTrade = true
            }
        } else if (depthB.Bids[0].Price - depthA.Asks[0].Price > targetDiffPriceB2A && Math.min(depthB.Bids[0].Amount, depthA.Asks[0].Amount) >= minHedgeAmount) {   // B->A market condition satisfied
            var priceBuy = depthA.Asks[0].Price + slidePrice
            var priceSell = depthB.Bids[0].Price - slidePrice
            var amount = Math.min(depthB.Bids[0].Amount, depthA.Asks[0].Amount)
            if (nowAccs[1].Stocks > minHedgeAmount && nowAccs[0].Balance * 0.8 / priceBuy > minHedgeAmount) {
                amount = Math.min(amount, nowAccs[1].Stocks, nowAccs[0].Balance * 0.8 / priceBuy, maxHedgeAmount)
                Log("triggerB->A:", depthB.Bids[0].Price - depthA.Asks[0].Price, priceBuy, priceSell, amount, nowAccs[0].Balance * 0.8 / priceBuy, nowAccs[1].Stocks)  // prompt message
                hedge(exA, exB, priceBuy, priceSell, amount)
                cancelAll()
                lastKeepBalanceTS = 0
                isTrade = true
            }
        }
Karena harga beli dan jual dibagi menjadi dua data,hedgefungsi juga perlu dimodifikasi.
function hedge(buyEx, sellEx, priceBuy, priceSell, amount) {
    var buyRoutine = buyEx.Go("Buy", priceBuy, amount)
    var sellRoutine = sellEx.Go("Sell", priceSell, amount)
    Sleep(500)
    buyRoutine.wait()
    sellRoutine.wait()
}
Ada juga beberapa penyesuaian kecil berdasarkan modifikasi ini, yang tidak akan dijelaskan di sini.
Mengubah secara interaktif parameter seperti garis penyebaran lindung nilai
Tambahkan interaksi ke strategi, sehingga strategi dapat memodifikasi garis pemicu penyebaran secara real time. Desain interaksi strategi juga sangat sederhana. Pertama, tambahkan kontrol interaktif ke strategi di halaman pengeditan strategi.

Ada dua kontrol yang ditambahkan, satu disebut A2B dan yang lainnya disebut B2A. Setelah memasukkan nilai di kotak input kontrol, klik tombol di sebelah kanan kotak input. Perintah akan dikirim ke strategi segera, misalnya: masukkan nilai123di kotak input, klikA2Btombol, dan perintah akan dikirim ke strategi segera.
A2B:123
Desain interaktif deteksi dan pengolahan kode dalam kode strategi.
        // interaction
        var cmd = GetCommand()   // every time when the loop is operated here, it will detect whether an interactive command is sent; if no, return null string
        if (cmd) {               // interactive command detected, such as A2B:123
            Log("received command:", cmd)
            var arr = cmd.split(":")   // split out the interactive control name and the value in the input box; arr[0] means A2B, and arr[1] means 123
            if (arr[0] == "A2B") {     // judge whether the triggered interactive control is A2B
                Log("modify parameterA2B,", diffAsPercentage ? "parameter of spread ratio:" : "parameter of spread:", arr[1])
                if (diffAsPercentage) {
                    hedgeDiffPercentageB2A = parseFloat(arr[1])     // modify the spread trigger line
                } else {
                    hedgeDiffPriceA2B = parseFloat(arr[1])          // modify the spread trigger line
                }
            } else if (arr[0] == "B2A") {           // detected the triggered control is B2A
                Log("modify parameterB2A,", diffAsPercentage ? "parameter of spread ratio:" : "parameter of spread:", arr[1])
                if (diffAsPercentage) {
                    hedgeDiffPercentageA2B = parseFloat(arr[1])
                } else {
                    hedgeDiffPriceB2A = parseFloat(arr[1])
                }
            }
        }
Mengelola informasi bilah status dan menampilkannya dalam format tabel
Membuat tampilan data bar status lebih diatur dan mudah diamati.
        var tbl = {
            "type" : "table",
            "title" : "data",
            "cols" : ["platform", "Currency", "frozenCurrrency", "quoteCurrency", "frozenQuoteCurrency", "triggerSpread", "currentSpread"],
            "rows" : [],
        }
        tbl.rows.push(["A:" + exA.GetName(), nowAccs[0].Stocks, nowAccs[0].FrozenStocks, nowAccs[0].Balance, nowAccs[0].FrozenBalance, "A->B:" + targetDiffPriceA2B, "A->B:" + (depthA.Bids[0].Price - depthB.Asks[0].Price)])
        tbl.rows.push(["B:" + exB.GetName(), nowAccs[1].Stocks, nowAccs[1].FrozenStocks, nowAccs[1].Balance, nowAccs[1].FrozenBalance, "B->A:" + targetDiffPriceB2A, "B->A:" + (depthB.Bids[0].Price - depthA.Asks[0].Price)])

        LogStatus(_D(), "\n", "`" + JSON.stringify(tbl) + "`")

Backtest
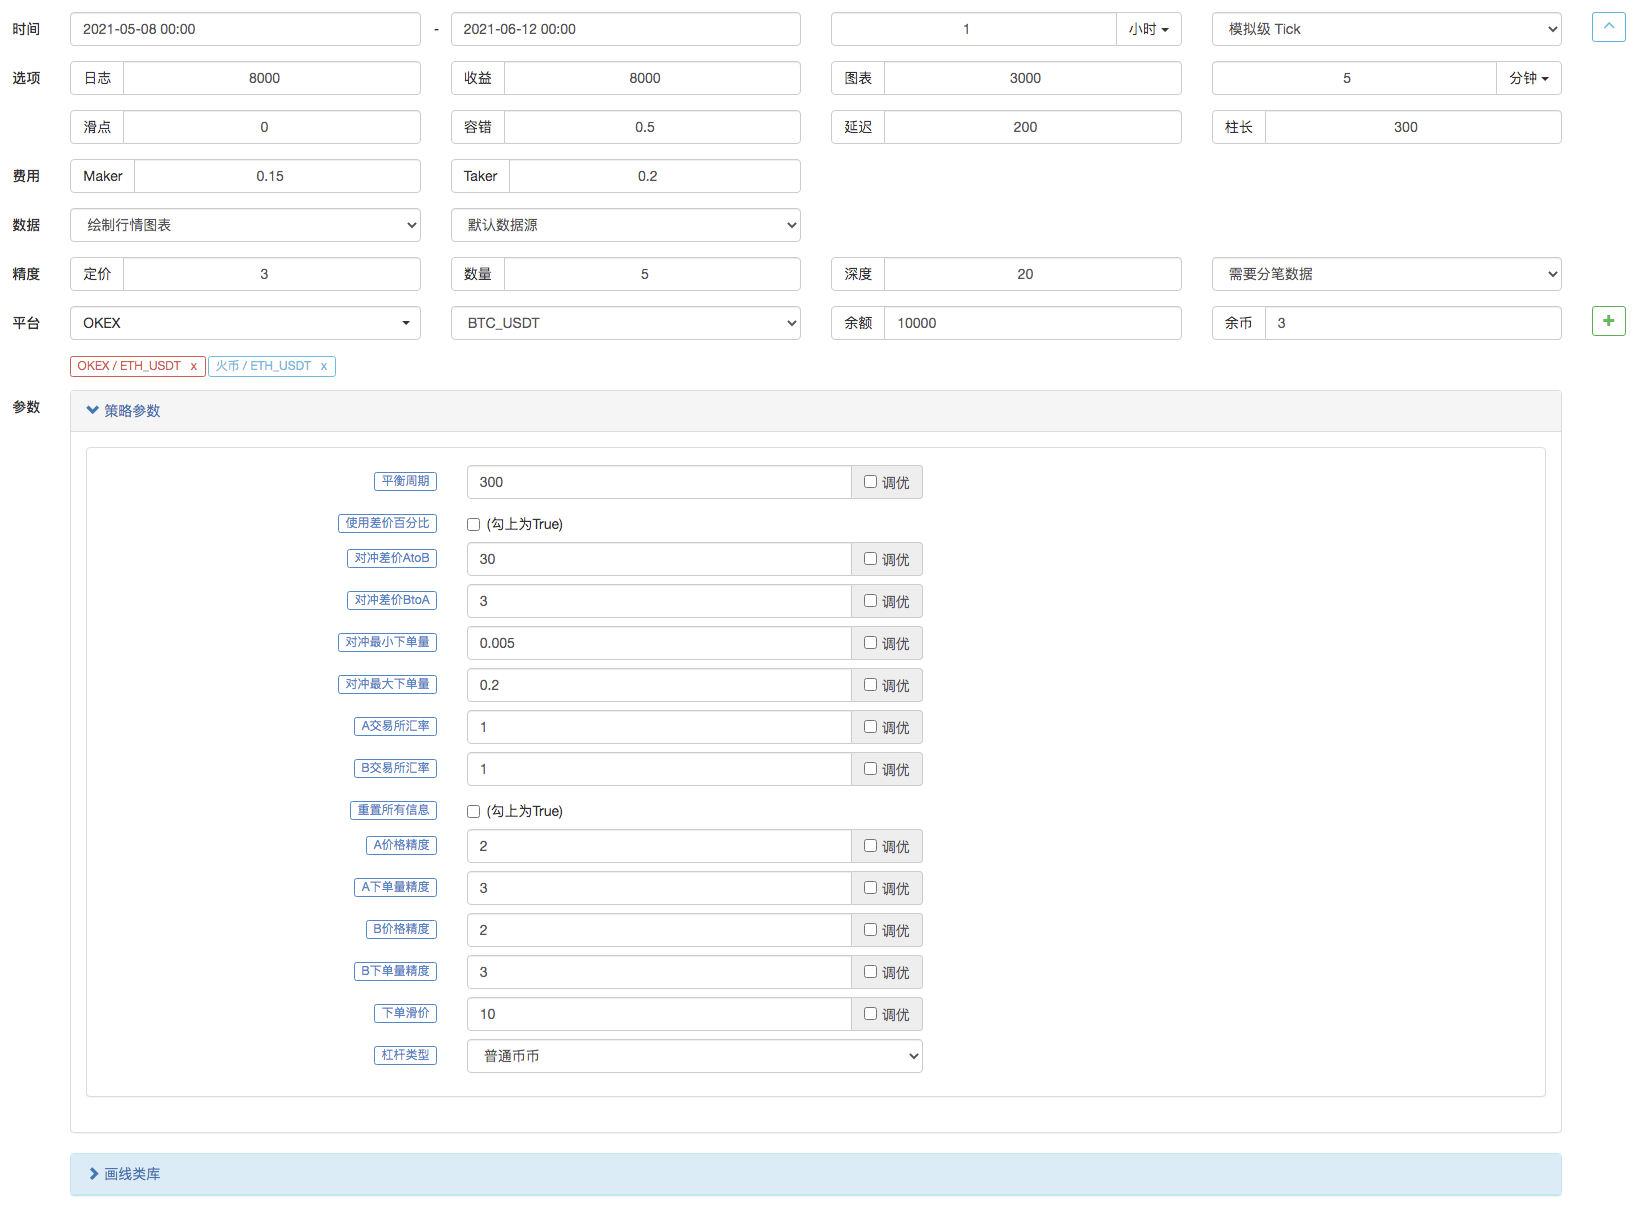
Backtest adalah hanya tes strategi, sebagai fungsi deteksi awal. Banyak bug sebenarnya dapat diuji pada tahap backtest. Tidak perlu terlalu peduli tentang hasil backtest. Akhirnya, strategi masih perlu diuji di lingkungan yang sebenarnya dengan bot nyata.


Kode sumber strategi:https://www.fmz.com/strategy/302834
- Penemu saya tidak tepat waktu.
- Berikan ide untuk strategi penulisan yang lebih baik!
- Pemula, periksa
Membawa Anda ke Cryptocurrency Quantitative Trading (5) - Pemula, periksa
Membawa Anda ke Cryptocurrency Quantitative Trading (4) - Waktu pembuatan pesanan dan waktu penyelesaian pesanan
- Strategi jual-beli Martin
- Jika Anda ingin memahami bahasa saya, tolong jelaskan apa yang dimaksud dengan kode ini: _TR:=MAX ((MAX (((HIGH-LOW), ABS ((REF ((CLOSE, 1) -HIGH)), ABS ((REF ((CLOSE, 1) -LOW));
- Pertanyaan tentang laporan kesalahan
- Pemula, periksa
Membawa Anda ke Cryptocurrency Quantitative Trading (1) - Apakah Anda bisa menambahkan dukungan untuk typescript?
- Strategi Hedge Spot Cryptocurrency (1)
- Dalam API Bitget, masalah muncul ketika transaksi yang dicatat pada ADA, AVAX, AXS, BCH, DOT, EOS, ETC, FIL, LINK, LTC, LUNA, MATIC, SOL, XRP ditempatkan.
- Berdoa
- Strategi jual beli langsung yang dibayarkan
- Apakah ada contoh kebijakan di bursa bitget? Apakah ada bantuan dari administrator, terima kasih
- Dapatkan 80 Kali dalam 5 Hari
Kekuatan Strategi Frekuensi Tinggi - Aplikasi Metadata Kode Sewa Strategi
- Advanced Platform Research
Python Data Analysis & Strategi Backtest - Desain Strategi Jenis Martingale Futures Cryptocurrency
- Strategi Mylanguage untuk Mencapai Push Real-Time dari Perubahan Posisi ke Aplikasi Seluler & WeChat