Rasio Emas Rata-rata Reversi Tren Strategi Trading
Penulis:ChaoZhang, Tanggal: 2023-12-07 11:03:20Tag:

Gambaran umum
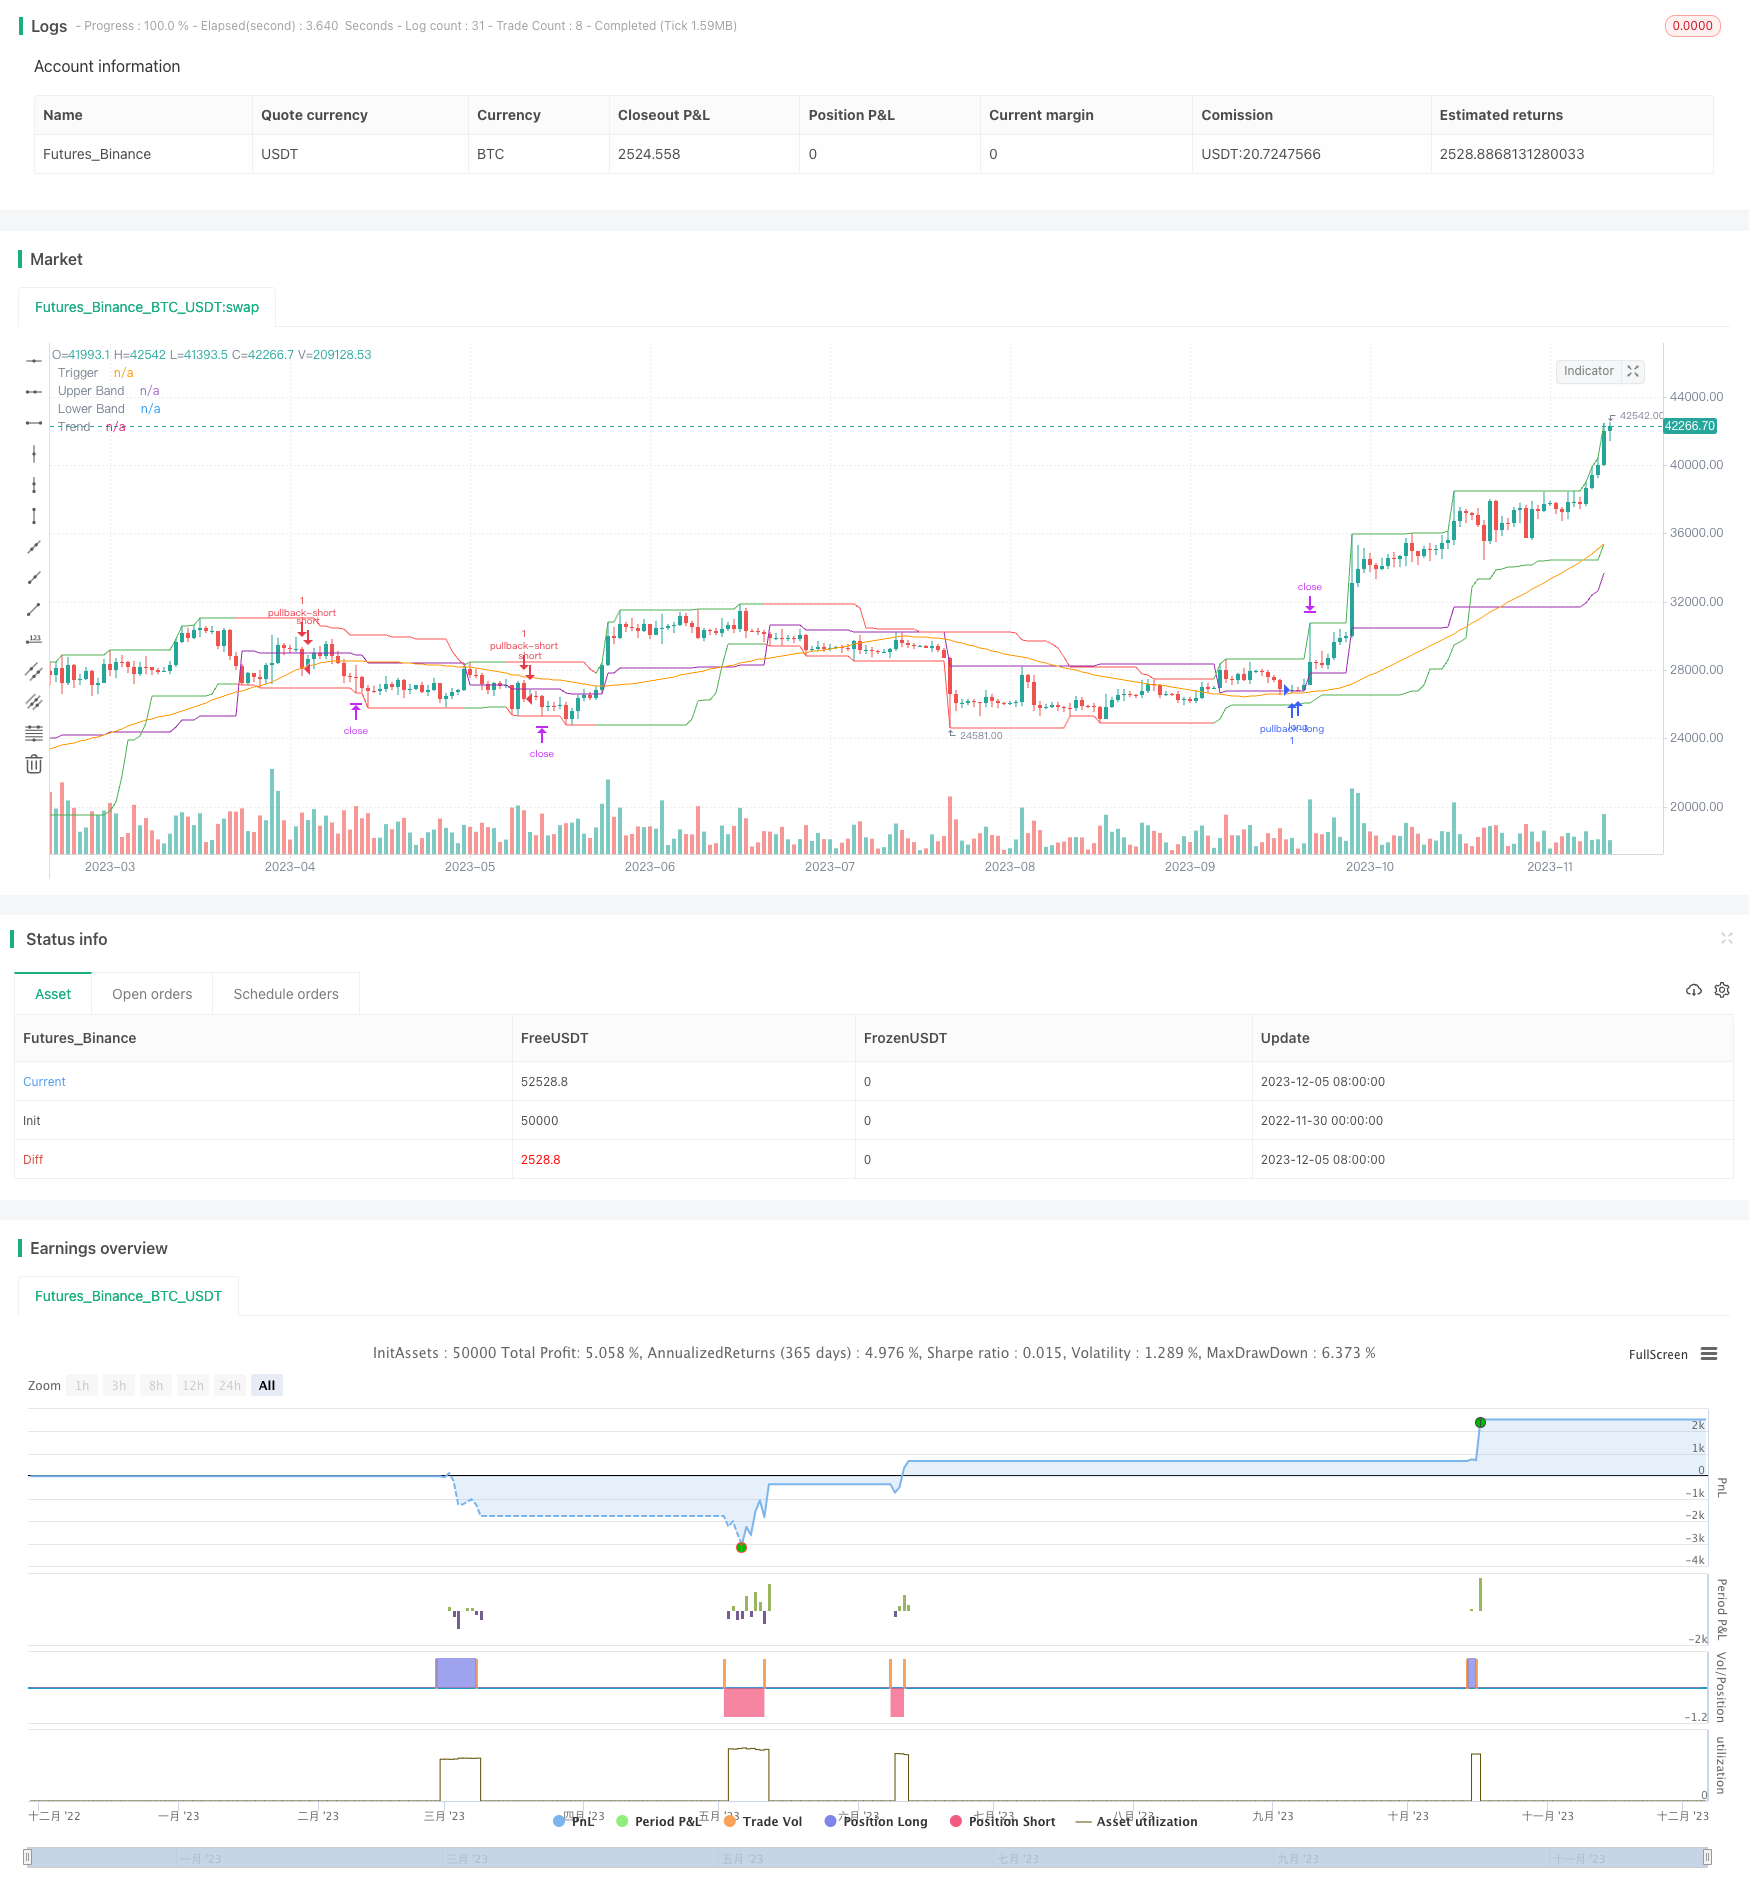
Strategi perdagangan tren reversi rata-rata emas mengidentifikasi arah tren yang lebih kuat menggunakan indikator saluran dan rata-rata bergerak, dan membuka posisi dalam arah tren setelah harga mundur ke rasio tertentu.
Logika Strategi
Indikator inti dari strategi ini meliputi indikator saluran, moving average dan garis pemicu pullback.
- Indikator saluran dihitung dari tertinggi tertinggi dan terendah untuk mengidentifikasi saluran harga.
- Rata-rata bergerak digunakan untuk menentukan arah tren harga secara keseluruhan.
- Garis pemicu pullback kemudian membuka posisi setelah harga memantul kembali dari batas saluran dengan rasio tertentu.
Ketika harga mencapai bagian bawah saluran, strategi mencatat titik terendah sebagai titik referensi dan mengatur sinyal jual. Ketika harga naik, setelah kenaikan mencapai rasio pullback, posisi pendek akan dibuka di sekitar titik rebound.
Sebaliknya, ketika harga mencapai bagian atas saluran, strategi mencatat titik tertinggi sebagai titik referensi dan mengatur sinyal beli.
Oleh karena itu, logika perdagangan strategi ini adalah untuk melacak saluran harga dan campur tangan dalam tren yang ada ketika sinyal pembalikan muncul.
Analisis Keuntungan
Keuntungan utama dari strategi ini adalah:
- Hal ini dapat berkinerja baik di pasar tren yang kuat.
- Kekerasan memasuki perdagangan dapat disesuaikan melalui parameter rasio pullback.
- Pengendalian pengambilan yang wajar dapat membatasi kerugian perdagangan tunggal.
Secara khusus, karena strategi terutama membuka posisi pada titik pembalikan tren, ia bekerja lebih baik di pasar dengan fluktuasi harga yang lebih besar dan tren yang lebih jelas. Selain itu, menyesuaikan parameter rasio pullback dapat mengontrol tingkat agresifitas strategi untuk mengikuti tren. Akhirnya, stop loss dapat mengontrol kerugian perdagangan tunggal dengan sangat baik.
Analisis Risiko
Risiko utama dari strategi ini juga meliputi:
- Strategi ini sensitif terhadap karakteristik tren instrumen perdagangan.
- Pengaturan rasio pullback yang tidak benar dapat menyebabkan terlalu agresif atau terlalu konservatif.
- Waktu memegang posisi mungkin terlalu lama, risiko overnight membutuhkan perhatian.
Secara khusus, jika instrumen perdagangan yang digunakan dalam strategi memiliki tren yang lebih lemah dan fluktuasi yang lebih kecil, kinerja dapat terganggu. Selain itu, rasio pullback yang terlalu besar atau terlalu kecil akan mempengaruhi kinerja strategi.
Untuk menghindari risiko di atas, pertimbangkan untuk mengoptimalkan aspek berikut:
- Pilih instrumen perdagangan dengan karakteristik tren yang lebih jelas.
- Sesuaikan rasio pullback parameter untuk menemukan kombinasi parameter terbaik.
- Atur keuntungan mengambil keluar untuk secara wajar mengontrol waktu ditahan.
Kesimpulan
Rasio emas berarti strategi perdagangan tren reversi menilai tren harga dan sinyal pullback melalui indikator sederhana, membuka posisi untuk melacak tren di pasar yang kuat, dan termasuk dalam sistem tren khas.
/*backtest
start: 2022-11-30 00:00:00
end: 2023-12-06 00:00:00
period: 1d
basePeriod: 1h
exchanges: [{"eid":"Futures_Binance","currency":"BTC_USDT"}]
*/

//@version=3
//
// A port of the TradeStation EasyLanguage code for a mean-revision strategy described at
//     http://traders.com/Documentation/FEEDbk_docs/2017/01/TradersTips.html
//
// "In “Mean-Reversion Swing Trading,” which appeared in the December 2016 issue of STOCKS & COMMODITIES, author Ken Calhoun
//  describes a trading methodology where the trader attempts to enter an existing trend after there has been a pullback.
//  He suggests looking for 50% pullbacks in strong trends and waiting for price to move back in the direction of the trend
//  before entering the trade."
//
//  See Also:
//    - 9 Mistakes Quants Make that Cause Backtests to Lie (https://blog.quantopian.com/9-mistakes-quants-make-that-cause-backtests-to-lie-by-tucker-balch-ph-d/)
//    - When Backtests Meet Reality (http://financial-hacker.com/Backtest.pdf)
//    - Why MT4 backtesting does not work (http://www.stevehopwoodforex.com/phpBB3/viewtopic.php?f=28&t=4020)
//
//
// -----------------------------------------------------------------------------
// Copyright 2018 sherwind
//
// This program is free software: you can redistribute it and/or modify
// it under the terms of the GNU General Public License as published by
// the Free Software Foundation, either version 3 of the License, or
// any later version.
//
// This program is distributed in the hope that it will be useful,
// but WITHOUT ANY WARRANTY; without even the implied warranty of
// MERCHANTABILITY or FITNESS FOR A PARTICULAR PURPOSE.  See the
// GNU General Public License for more details.
//
// The GNU General Public License can be found here
// <http://www.gnu.org/licenses/>.
//
// -----------------------------------------------------------------------------
//

strategy("Mean-Reversion Swing Trading Strategy v1", shorttitle="MRST Strategy v1", overlay=true)
channel_len  = input(defval=20, title="Channel Period", minval=1)
pullback_pct = input(defval=0.5, title="Percent Pull Back Trigger", minval=0.01, maxval=1, step=0.01)
trend_filter_len = input(defval=50, title="Trend MA Period", minval=1)


upper_band = highest(high, channel_len)
lower_band = lowest(low, channel_len)
trend      = sma(close, trend_filter_len)

low_ref  = 0.0
low_ref  :=  nz(low_ref[1])
high_ref = 0.0
high_ref := nz(high_ref[1])
long_ok  = false
long_ok  := nz(long_ok[1])
short_ok = false
short_ok := nz(short_ok[1])
long_ok2 = false
long_ok2  := nz(long_ok2[1])

if (low == lower_band)
    low_ref  := low
    long_ok  := false
    short_ok := true
    long_ok2 := false

if (high == upper_band)
    high_ref := high
    long_ok  := true
    short_ok := false
    long_ok2  := true

// Pull Back Level
trigger = long_ok2 ? high_ref - pullback_pct * (high_ref - low_ref) : low_ref + pullback_pct * (high_ref - low_ref)

plot(upper_band, title="Upper Band", color=long_ok2?green:red)
plot(lower_band, title="Lower Band", color=long_ok2?green:red)
plot(trigger, title="Trigger", color=purple)
plot(trend, title="Trend", color=orange)

enter_long = long_ok[1] and long_ok and crossover(close, trigger) and close > trend and strategy.position_size <= 0
enter_short = short_ok[1] and short_ok and crossunder(close, trigger) and close < trend and strategy.position_size >= 0

if (enter_long)
    long_ok := false
    strategy.entry("pullback-long", strategy.long, stop=close, comment="pullback-long")
else
    strategy.cancel("pullback-long")

if (enter_short)
	short_ok := false
    strategy.entry("pullback-short", strategy.short, stop=close, comment="pullback-short")
else
    strategy.cancel("pullback-short")

strategy.exit("exit-long", "pullback-long", limit=upper_band, stop=lower_band)
strategy.exit("exit-short", "pullback-short", limit=lower_band, stop=upper_band)
- Strategi Momentum Dinamis
- Strategi Perdagangan Bitcoin Intraday John Berdasarkan Beberapa Indikator
- Strategi Rata-rata Gerak Perlahan
- Strategi price breakout Z-Score
- Fibonacci Retracement Reversal Strategi
- Strategi Perdagangan Kuantitas Faktor Dua
- Strategi Perdagangan EMA Golden Cross Dual
- Strategi Trading BTC Berdasarkan Moving Average Crossover
- Indikator MACD Strategi Peringatan Awal Pemberontakan Dasar
- Strategi Rata-rata Gerak Adaptif Mala
- Strategi Trading Trend Berdasarkan Rata-rata Bergerak Ganda
- Dual Indicator Filtered Strategi Sinyal Beli
- Strategi perdagangan lintas rata-rata bergerak ganda
- Strategi Crossover EMA Dual
- Momentum Breakout Camarilla Dukungan Strategi
- Honey Trend ATR Breakout Strategi
- Tren Mengikuti Strategi dengan EMA
- Strategi Kuantitatif Bar Perubahan Persentase Reversal Ganda
- Bollinger Bands Reversal dengan MA Trend Filter
- Strategi Perdagangan Kuantitatif Berdasarkan RSI