Strategi Quant VIP Solid sebagai Batu
Penulis:ChaoZhang, Tanggal: 2023-12-19 13:54:05Tag:

Gambaran umum
Strategi ini disebut
Prinsip
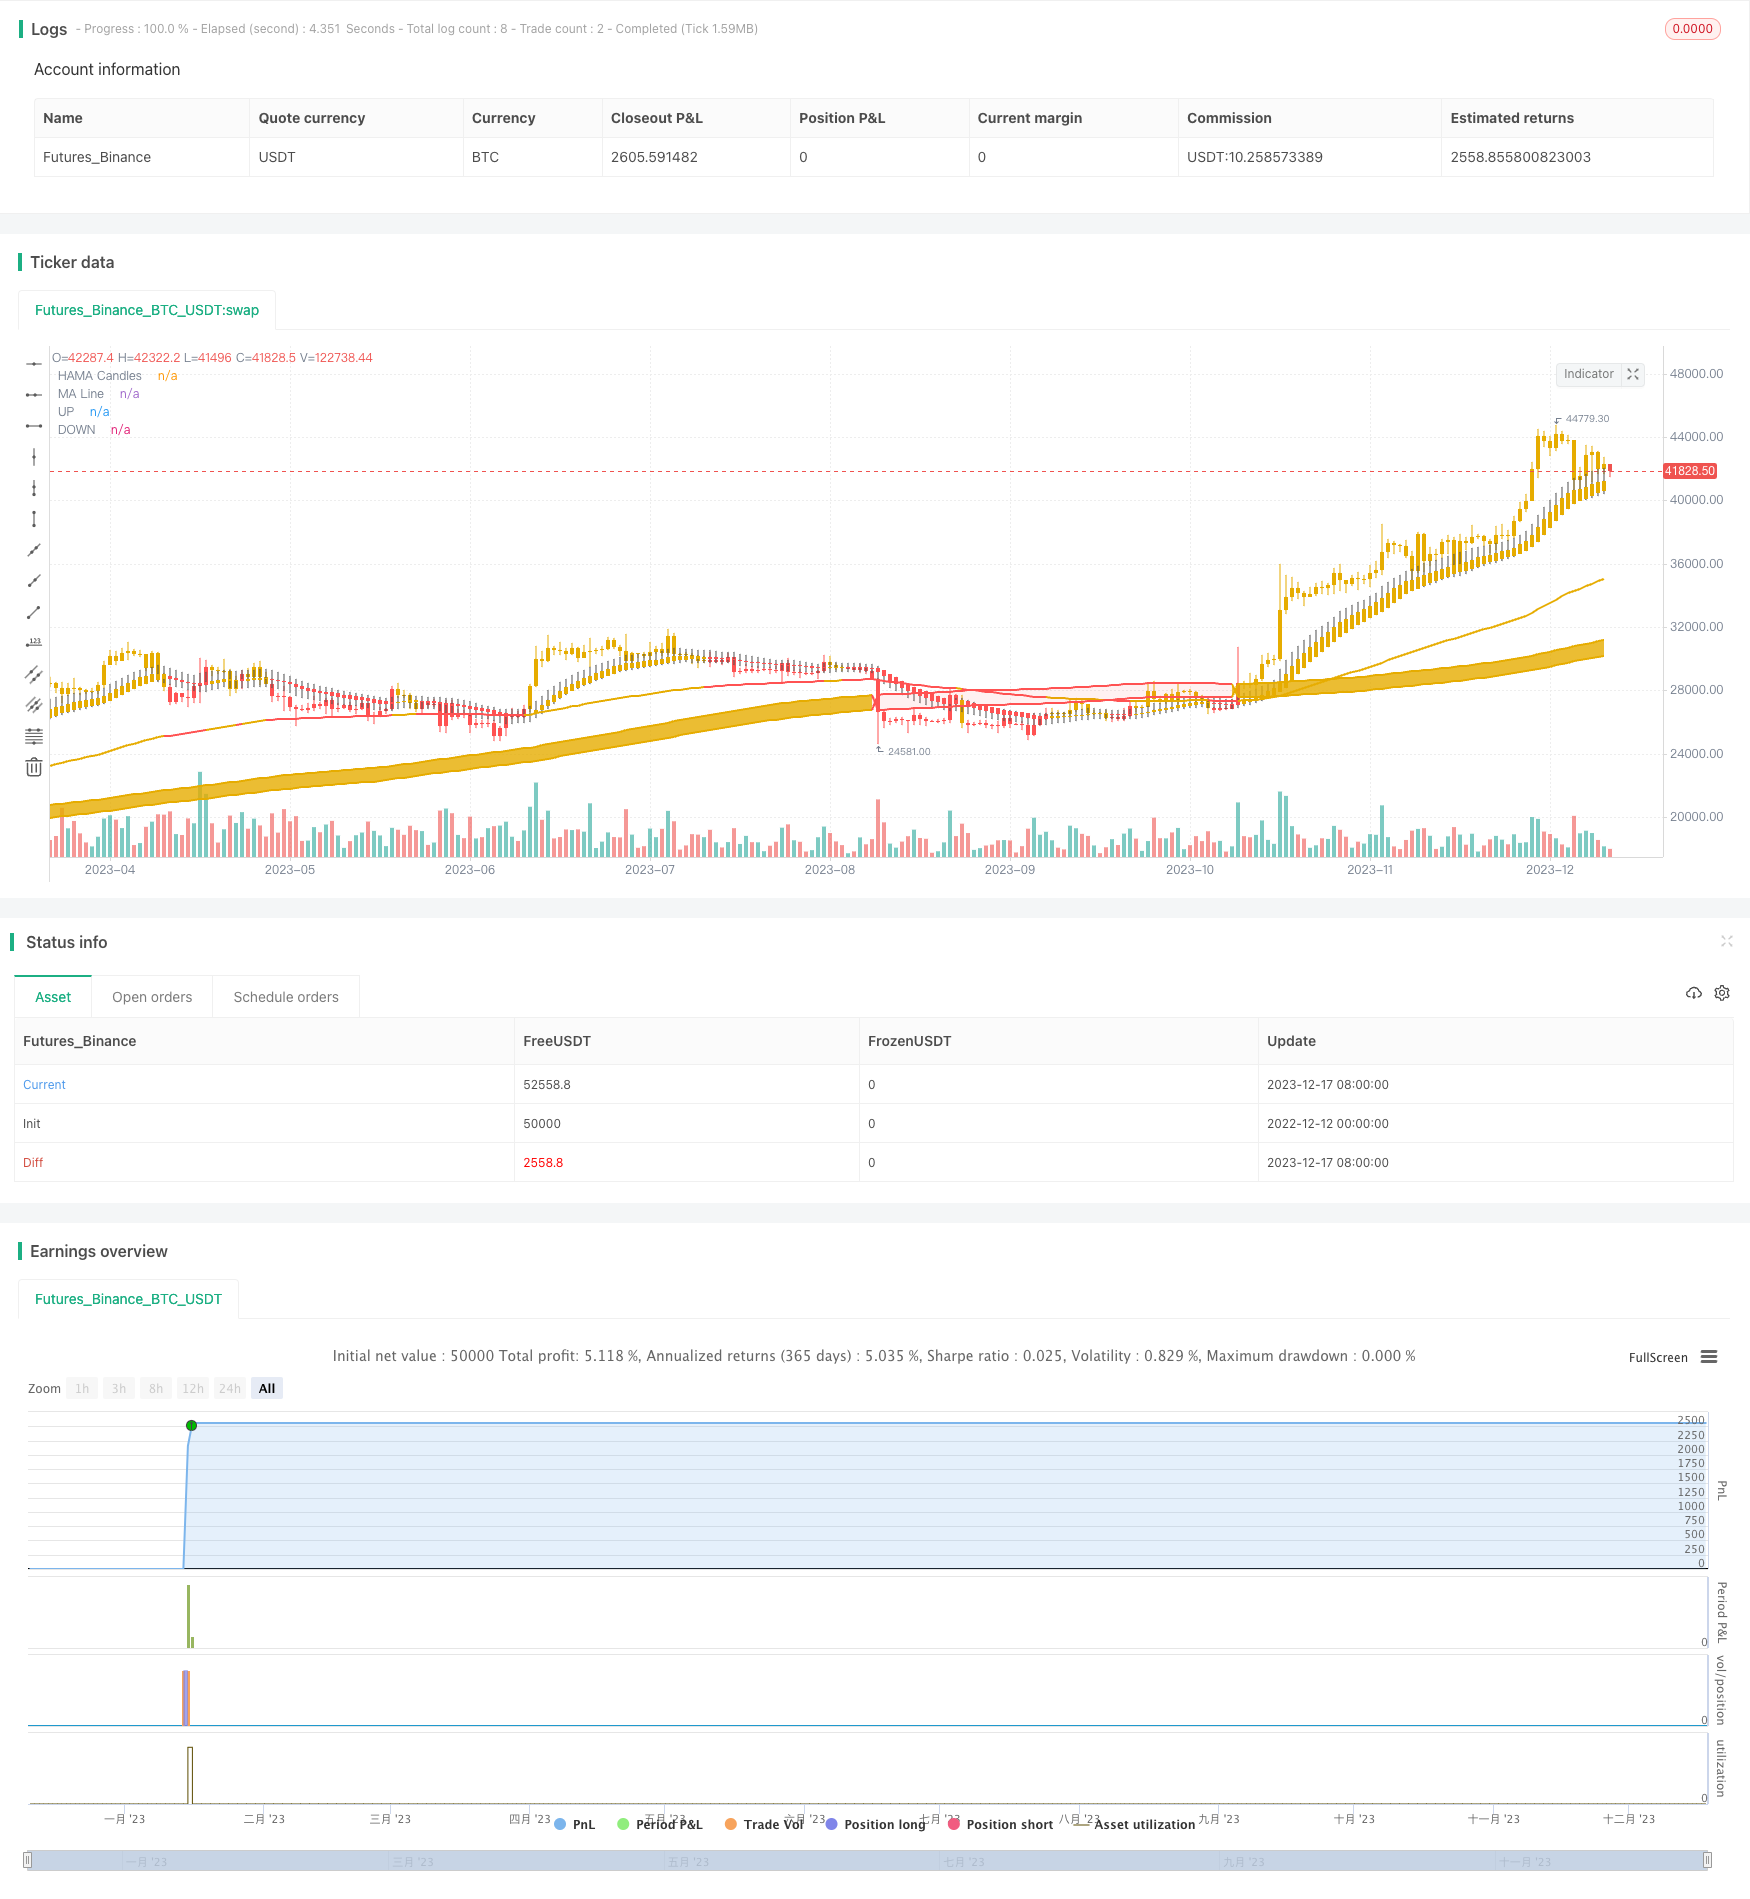
Strategi ini menggabungkan dua indikator. Salah satunya adalah indikator WMA yang dimodifikasi, yang menghitung harga rata-rata dari setiap lilin dan kemudian menerapkan metode rata-rata bergerak eksponensial untuk menentukan arah tren. Yang lainnya adalah indikator Saluran SSL, yang menggunakan rata-rata bergerak dari harga tertinggi dan terendah untuk menentukan saluran harga dan menilai status tren saat ini.
Ketika indikator WMA yang dimodifikasi menghasilkan sinyal beli, yaitu salib emas, kita menggabungkan indikator SSL Channel untuk menentukan apakah harga di saluran tersebut sesuai.
Keuntungan
- Menggabungkan dua indikator membuat sinyal beli lebih dapat diandalkan untuk menghindari false breakout.
- Indikator WMA yang dimodifikasi dapat menentukan titik balik dengan lebih tepat.
- Saluran SSL dengan jelas menilai saluran harga untuk menghindari pembelian pada tingkat tinggi.
- Menggunakan metode rata-rata bergerak eksponensial lebih kondusif untuk menentukan tren jangka panjang.
Risiko dan Solusi
- Titik stop loss dapat dengan mudah dipicu di pasar yang tidak stabil.
- Sistem rata-rata bergerak sensitif terhadap kebisingan pasar jangka pendek, yang dapat menghasilkan sinyal yang salah.
- Pengaturan parameter yang tidak benar juga dapat mempengaruhi kinerja strategi. Kita dapat mengoptimalkan parameter melalui backtesting untuk menemukan kombinasi parameter terbaik.
Arahan Optimasi
- Kita dapat menguji berbagai jenis rata-rata bergerak, seperti EMA dan VWMA, untuk menemukan indikator garis rata-rata yang paling cocok.
- Kita bisa menambahkan indikator volume untuk menghindari sinyal di daerah volume rendah.
- Kita bisa mencoba metode gambar saluran yang berbeda, seperti saluran Donchian, untuk membuat batas saluran lebih dapat diandalkan.
- Kita dapat menambahkan indikator tambahan lainnya, seperti MACD dan RSI, untuk lebih mengkonfirmasi waktu masuk.
Ringkasan
Melalui kombinasi yang cerdik dari indikator WMA yang dimodifikasi dan indikator SSL Channel, strategi ini membangun kerangka perdagangan kuantitatif yang stabil dan dapat diandalkan.
/*backtest
start: 2022-12-12 00:00:00
end: 2023-12-18 00:00:00
period: 1d
basePeriod: 1h
exchanges: [{"eid":"Futures_Binance","currency":"BTC_USDT"}]
*/

// This source code is subject to the terms of the Mozilla Public License 2.0 at https://mozilla.org/MPL/2.0/
// © Darshana_Alwis

//@version=5
strategy("VIP", overlay=true, initial_capital=1000,currency=currency.USD,default_qty_type=strategy.percent_of_equity,default_qty_value=100,pyramiding=0)
//SSS = Sultan+Saud Strategy

//The original idea of the code belonges to saudALThaidy
//The strategy code is basically made out of two other indicators, edited and combined by me.
// 1- NSDT HAMA Candles => https://www.tradingview.com/script/k7nrF2oI-NSDT-HAMA-Candles/
// 2- SSL Channel => https://www.tradingview.com/script/6y9SkpnV-SSL-Channel/


//MA INFO
WickColor = input.color(color.rgb(80, 80, 80, 100), title='Wick Color', tooltip='Suggest Full Transparency.')
LengthMA = input.int(100, minval=1, title='MA Line Length', inline='MA Info')
TakeProfit = input.float(1, minval=0, title='Take Profit Percentage', step=1)
UseStopLose = input.bool(false, title='Use Stop Percentage')
StopLose = input.float(1, minval=0, title='StopLose Percentage', step=1)

MASource = close

ma(source, length, type) =>
    type == "SMA" ? ta.sma(source, length) :
     type == "EMA" ? ta.ema(source, length) :
     type == "SMMA (RMA)" ? ta.rma(source, length) :
     type == "WMA" ? ta.wma(source, length) :
     type == "VWMA" ? ta.vwma(source, length) :
     na

ma1_color  = color.rgb(230, 172, 0)
ma1 = ma(high, 200, "SMA")

ma2_color  = color.red
ma2 = ma(low, 200, "SMA")

Hlv1 = float(na)
Hlv1 := close > ma1 ? 1 : close < ma2 ? -1 : Hlv1[1]
sslUp1   = Hlv1 < 0 ? ma2 : ma1
sslDown1 = Hlv1 < 0 ? ma1 : ma2

Color1 = Hlv1 == 1 ? ma1_color : ma2_color
fillColor1 = color.new(Color1, 90)

highLine1 = plot(sslUp1, title="UP", linewidth=2, color = Color1)
lowLine1 = plot(sslDown1, title="DOWN", linewidth=2, color = Color1)

OpenLength = 25
HighLength = 20
LowLength = 20
CloseLength = 20


SourceOpen = (open[1] + close[1]) / 2
SourceHigh = math.max(high, close)
SourceLow = math.min(low, close)
SourceClose = (open + high + low + close) / 4

funcCalcMA1(src1, len1) => ta.ema(src1, len1)
funcCalcOpen(SourceOpen, OpenLength) => ta.ema(SourceOpen, OpenLength)
funcCalcHigh(SourceHigh, HighLength) => ta.ema(SourceHigh, HighLength)
funcCalcLow(SourceLow, LowLength) => ta.ema(SourceLow, LowLength)
funcCalcClose(SourceClose, CloseLength) => ta.ema(SourceClose, CloseLength)

MA_1 = funcCalcMA1(MASource, LengthMA)

CandleOpen = funcCalcOpen(SourceOpen, OpenLength)
CandleHigh = funcCalcHigh(SourceHigh, HighLength)
CandleLow = funcCalcLow(SourceLow, LowLength)
CandleClose = funcCalcClose(SourceClose, CloseLength)

//PLOT CANDLES
//-------------------------------NSDT HAMA Candels
BodyColor = CandleOpen > CandleOpen[1] ? color.rgb(230, 172, 0) : color.red
barcolor(BodyColor)
plotcandle(CandleOpen, CandleHigh, CandleLow, CandleClose, color=BodyColor, title='HAMA Candles', wickcolor=WickColor, bordercolor=na)
plot(MA_1, title='MA Line', color=BodyColor, style=plot.style_line, linewidth=2)

//------------------------------SSL Channel


plot_buy = false
avg = ((high-low)/2)+low
LongCondition = (Hlv1 == 1 and Hlv1[1] == -1) and (BodyColor == color.rgb(230, 172, 0)) and (MA_1 < avg) and (CandleHigh < avg) and (strategy.opentrades == 0)
if LongCondition
    strategy.entry("BUY with VIP", strategy.long)
    plot_buy := true

base = strategy.opentrades.entry_price(0)
baseProfit = (base+((base/100)*TakeProfit))
baseLose = (base-((base/100)*StopLose))

strategy.exit("SELL with VIP","BUY with VIP",limit = baseProfit)
if UseStopLose and (close < MA_1)
    strategy.exit("SELL with VIP","BUY with VIP",stop = baseLose)
if not UseStopLose and (close < MA_1)
    strategy.exit("SELL with VIP","BUY with VIP", stop = close)

plotshape(plot_buy, title="Buy Label", text="Buy", location=location.belowbar, style=shape.labelup, size=size.tiny, color=Color1, textcolor=color.white)

fill(highLine1, lowLine1, color = fillColor1)
- Volatilitas Elemen Volume Terbatas Strategi
- Strategi akuisisi kuantitatif BIST ini terdiri dari 4 tahap
- Strategi perdagangan MFI tersembunyi/STOCH Divergence/Trend Breaker dari Kifier
- Strategi Perdagangan Kuantitatif MACD
- Strategi Pelacakan Tren Rata-rata Bergerak Ganda
- Strategi Pembalikan Momentum Means
- Indeks Gerakan Arah Strategi Perdagangan Dua Arah
- Bollinger Band Breakout Trading Strategi
- Laguerre RSI Strategi Perdagangan
- Dinamis Re-entry Strategi Hanya Beli
- Golden Cross Optimized Moving Average Crossover Trading Strategy (Strategi Perdagangan lintas rata-rata bergerak yang dioptimalkan)
- Strategi Melalui Rata-rata Gerak
- Strategi Trading Trend Wave Berdasarkan LazyBear
- Strategi Lapan Hari yang Ditingkatkan
- Strategi Pullback Rata-rata Bergerak
- Dinamis MA Crossover Trend Mengikuti Strategi
- Strategi Rata-rata Bergerak Stoa-stik
- Momentum Oscillation Crossing Bollinger Bands dengan Strategi Moving Average
- RSI Bollinger Bands Strategi Perdagangan Jangka Pendek
- Strategi Stop Loss Super Trend Tracking