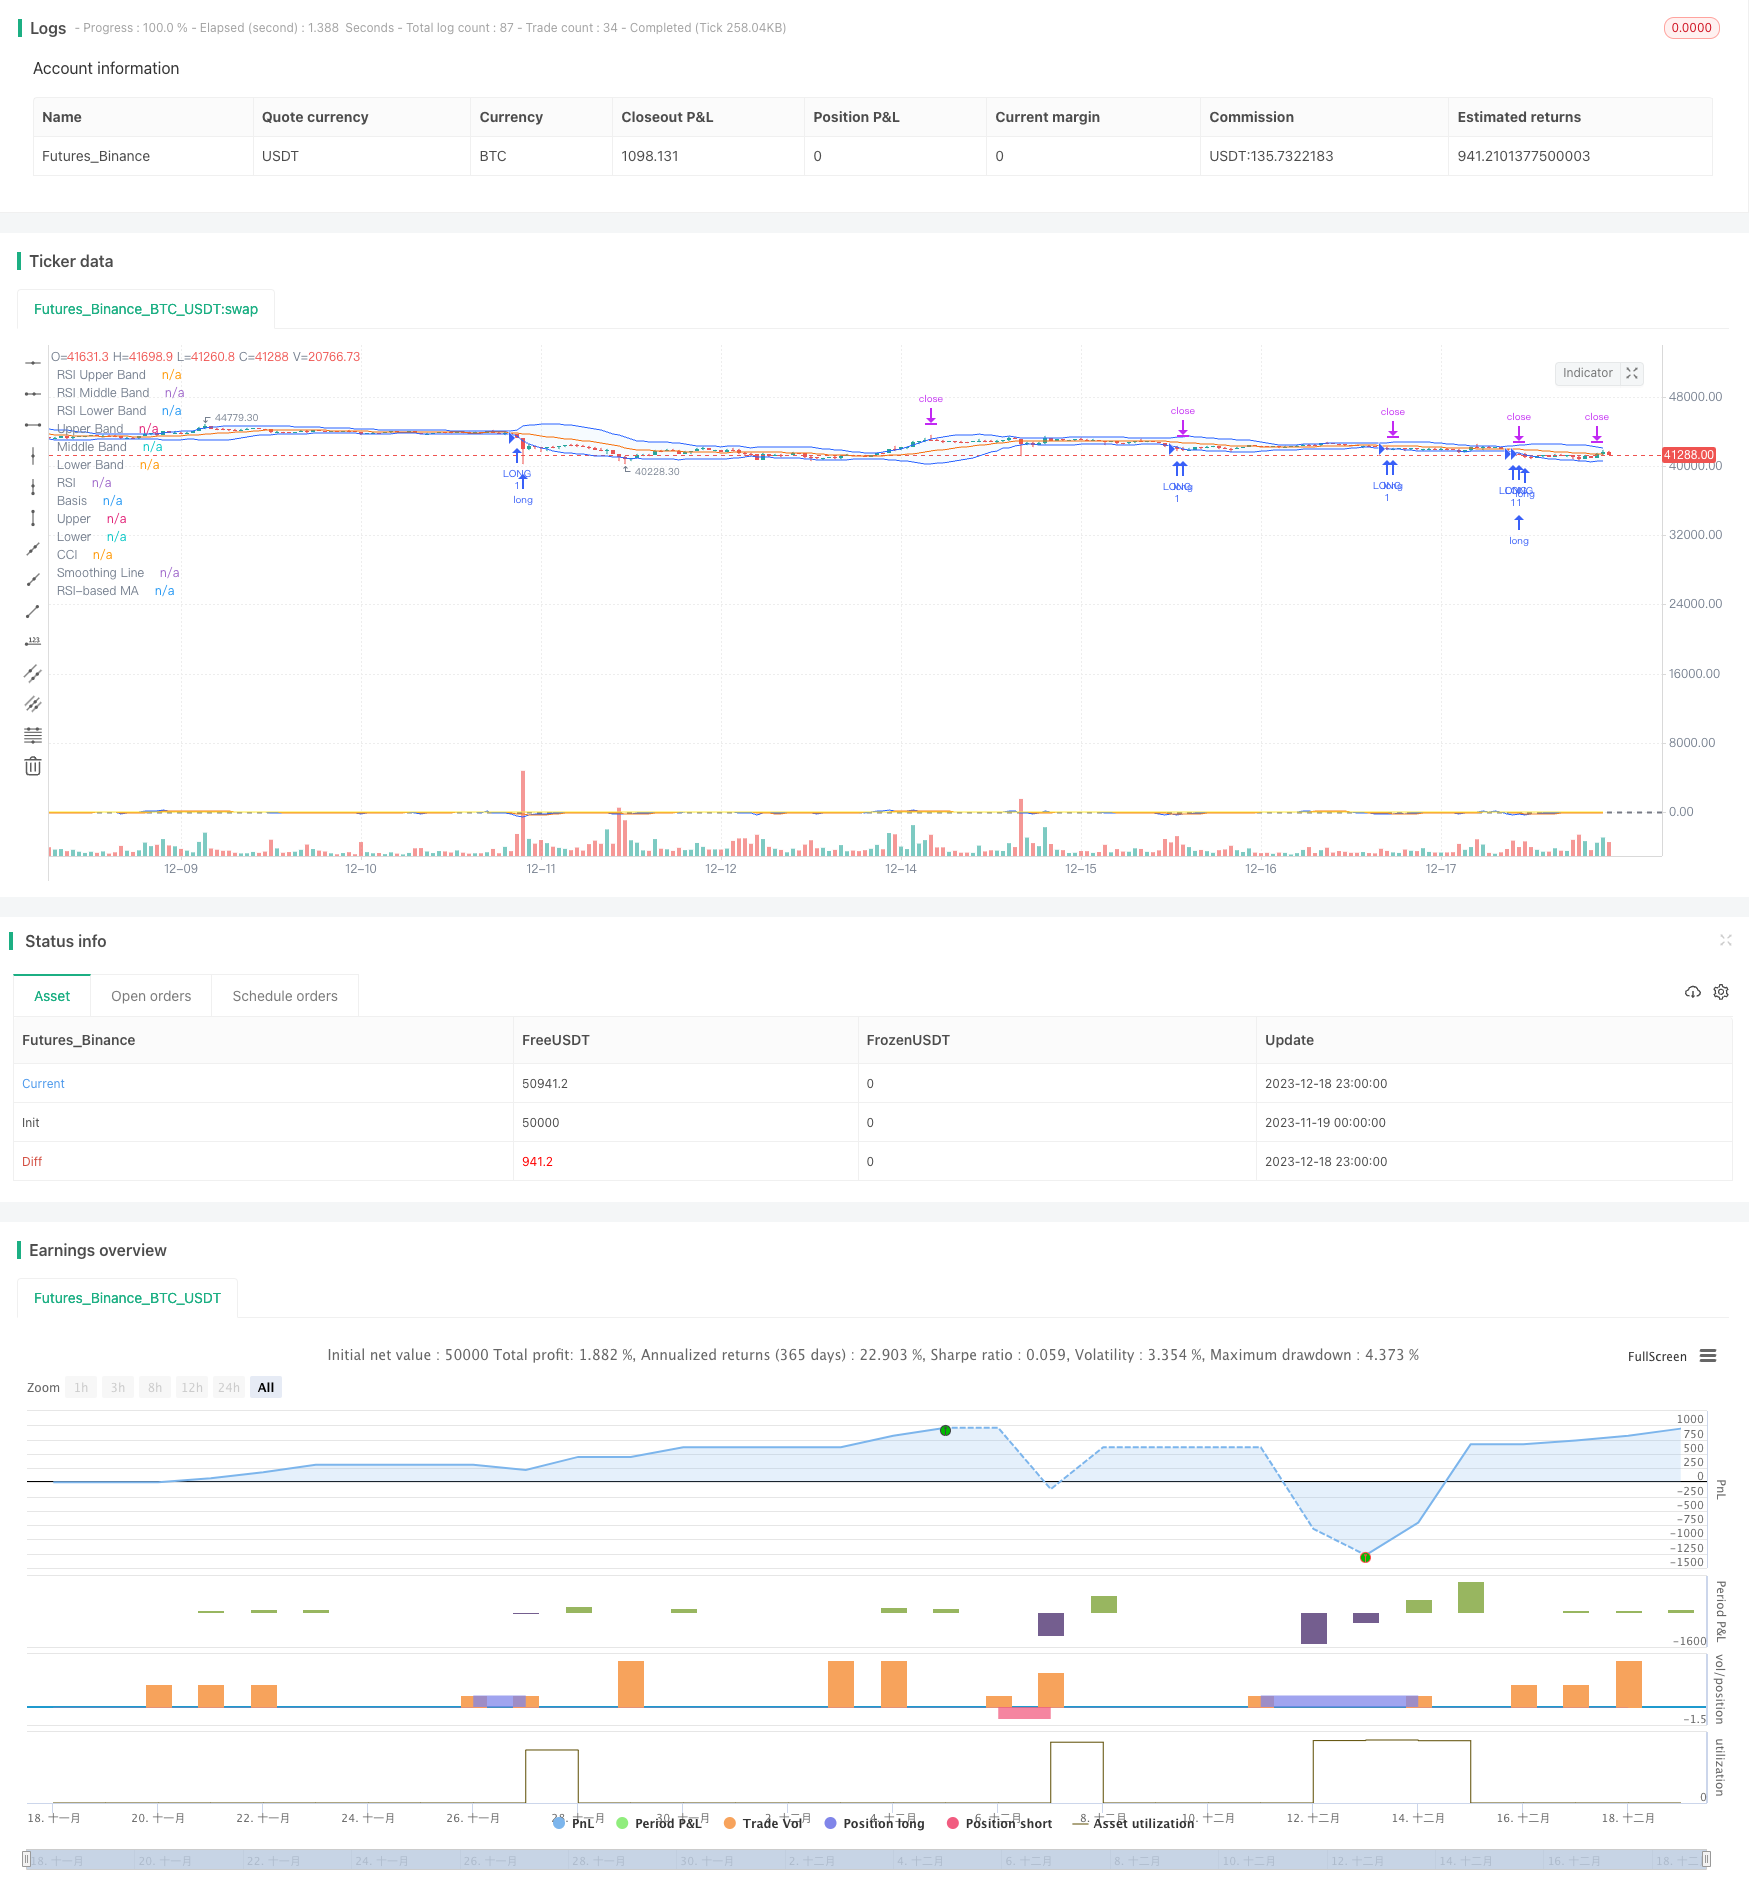
Strategi Kuantitatif: Bollinger Bands RSI Strategi Crossover CCI
Penulis:ChaoZhang, Tanggal: 2023-12-20 16:24:49Tag:

Gambaran umum
Strategi ini menggabungkan Bollinger Bands, Relative Strength Index (RSI) dan Commodity Channel Index (CCI) untuk menemukan sinyal silang dan menghasilkan sinyal beli dan jual.
Logika Strategi
Bollinger Bands
Bollinger Bands terdiri dari band tengah, band atas dan band bawah. Band tengah biasanya adalah rata-rata bergerak 20 hari. Band atas adalah dua penyimpangan standar di atas band tengah. Band bawah adalah dua penyimpangan standar di bawah. Harga di dekat band bawah mungkin menunjukkan kondisi oversold. Harga di dekat band atas mungkin menunjukkan kondisi overbought.
RSI
RSI mengukur kecepatan pergerakan harga arah ke atas dan ke bawah. Ini menunjukkan overbought di atas 70 dan oversold di bawah 30. Ketika RSI turun dari atas 70, itu bisa menjadi sinyal jual. Ketika RSI bangkit dari bawah 30, itu bisa menjadi sinyal beli.
CCI
CCI mengukur seberapa jauh harga telah bergerak dari harga rata-rata. Pembacaan di atas +100 menyiratkan kondisi overbought. Pembacaan di bawah -100 menyiratkan kondisi oversold. CCI mencerminkan tingkat harga ekstrem.
Sinyal silang
Strategi ini menggunakan Bollinger Bands untuk menilai tingkat overbought / oversold jangka pendek, RSI untuk mengukur momentum bullish / bearish dan CCI untuk mengidentifikasi harga ekstrem.
Keuntungan
- Menggabungkan beberapa indikator meningkatkan akurasi sinyal dan mengurangi sinyal palsu
- Menangkap kesempatan untuk membalikkan pada titik balik
- Parameter yang dapat disesuaikan beradaptasi dengan kondisi pasar yang berbeda
- Filter CCI yang halus mengurangi kebisingan dan meningkatkan stabilitas
Risiko dan Solusi
- Semua tiga indikator dapat menghasilkan sinyal buruk yang mengakibatkan kerugian. Parameter dapat longgar atau menambahkan filter lain.
- CCI berjuang dengan pasar bergolak. dapat diganti dengan rata-rata bergerak atau indikator volatilitas.
- Hanya stop loss di tempat tanpa mengambil keuntungan. bisa menambahkan trailing stop untuk mengunci beberapa keuntungan.
Peluang Optimalisasi
- Uji lebih banyak kombinasi parameter untuk menemukan pengaturan yang optimal
- Memperkenalkan pembelajaran mesin untuk menyesuaikan parameter secara otomatis
- Strategi pengambilan keuntungan dengan target keuntungan
- Masukkan lebih banyak indikator seperti MACD, KD untuk memvalidasi sinyal
Kesimpulan
Strategi ini menganalisis kondisi pasar secara keseluruhan menggunakan Bollinger Bands, RSI dan indikator CCI. Ini mengidentifikasi titik infleksi melalui sinyal crossover untuk membalikkan pasar perdagangan. Dengan optimasi lebih lanjut seperti penyesuaian parameter, mekanisme pengambilan keuntungan dll, ini dapat menjadi strategi kontra-trend yang kuat untuk berbagai lingkungan pasar.
/*backtest
start: 2023-11-19 00:00:00
end: 2023-12-19 00:00:00
period: 1h
basePeriod: 15m
exchanges: [{"eid":"Futures_Binance","currency":"BTC_USDT"}]
*/

//@version=5
strategy(shorttitle="BBRSIstr", title="Bollinger Bands", overlay=true)
length = input.int(20, minval=1)
maType = input.string("SMA", "Basis MA Type", options = ["SMA", "EMA", "SMMA (RMA)", "WMA", "VWMA"])
src = input(close, title="Source")
mult = input.float(2.0, minval=0.001, maxval=50, title="StdDev")

ma(source, length, _type) =>
    switch _type
        "SMA" => ta.sma(source, length)
        "EMA" => ta.ema(source, length)
        "SMMA (RMA)" => ta.rma(source, length)
        "WMA" => ta.wma(source, length)
        "VWMA" => ta.vwma(source, length)

basis = ma(src, length, maType)
dev = mult * ta.stdev(src, length)
upper = basis + dev
lower = basis - dev
offset = input.int(0, "Offset", minval = -500, maxval = 500)
plot(basis, "Basis", color=#FF6D00, offset = offset)
p1 = plot(upper, "Upper", color=#2962FF, offset = offset)
p2 = plot(lower, "Lower", color=#2962FF, offset = offset)
fill(p1, p2, title = "Background", color=color.rgb(33, 150, 243, 95))

//RSI
rsiLengthInput = input.int(14, minval=1, title="RSI Length", group="RSI Settings")
rsiSourceInput = input.source(close, "Source", group="RSI Settings")
maTypeInput = input.string("SMA", title="MA Type", options=["SMA", "Bollinger Bands", "EMA", "SMMA (RMA)", "WMA", "VWMA"], group="MA Settings")
maLengthInput = input.int(14, title="MA Length", group="MA Settings")
bbMultInput = input.float(2.0, minval=0.001, maxval=50, title="BB StdDev", group="MA Settings")
showDivergence = input.bool(false, title="Show Divergence", group="RSI Settings")

up = ta.rma(math.max(ta.change(rsiSourceInput), 0), rsiLengthInput)
down = ta.rma(-math.min(ta.change(rsiSourceInput), 0), rsiLengthInput)
rsi = down == 0 ? 100 : up == 0 ? 0 : 100 - (100 / (1 + up / down))
rsiMA = ma(rsi, maLengthInput, maTypeInput)
isBB = maTypeInput == "Bollinger Bands"

rsiPlot = plot(rsi, "RSI", color=#7E57C2)
plot(rsiMA, "RSI-based MA", color=color.yellow)
rsiUpperBand = hline(70, "RSI Upper Band", color=#787B86)
midline = hline(50, "RSI Middle Band", color=color.new(#787B86, 50))
rsiLowerBand = hline(30, "RSI Lower Band", color=#787B86)
fill(rsiUpperBand, rsiLowerBand, color=color.rgb(126, 87, 194, 90), title="RSI Background Fill")

//cci
ma = ta.sma(src, length)
cci = (src - ma) / (0.015 * ta.dev(src, length))
plot(cci, "CCI", color=#2962FF)
band1 = hline(100, "Upper Band", color=#787B86, linestyle=hline.style_dashed)
hline(0, "Middle Band", color=color.new(#787B86, 50))
band0 = hline(-100, "Lower Band", color=#787B86, linestyle=hline.style_dashed)
fill(band1, band0, color=color.rgb(33, 150, 243, 90), title="Background")

typeMA = input.string(title = "Method", defval = "SMA", options=["SMA", "EMA", "SMMA (RMA)", "WMA", "VWMA"], group="Smoothing")
smoothingLength = input.int(title = "Length", defval = 5, minval = 1, maxval = 100, group="Smoothing")

smoothingLine = ma(cci, smoothingLength, typeMA)
plot(smoothingLine, title="Smoothing Line", color=#f37f20, display=display.none)


longCBB= close < lower
shortCBB = close>upper
longBRSI = rsi < 33
shortBRSI = rsi > 70
longcci = cci < -215
shortcci = cci > 250

strategy.entry("LONG", strategy.long, when = longCBB and longBRSI and longcci)
strategy.exit("Exit ", profit = 600)
strategy.entry("SHORT", strategy.short, when = shortCBB and shortBRSI and shortcci)
strategy.exit("Exit ", profit = 600)
- Strategi Trading Candlestick Berbasis Model Interaktif
- Strategi Kombinasi DEMA MACD
- Ichimoku Yin Yang Candlestick Breakout Strategi
- Strategi Tren yang Didorong Likuiditas - Strategi Perdagangan Kuantitas Berdasarkan Indikasi Tren Aliran
- EMA Crossover Strategy dengan Trailing Stop Loss
- SMA RSI & Strategi Jual Beli Tiba-tiba
- Strategi Pelacakan Pembalikan Kuantitatif dua faktor
- Ehlers Instantaneous Trendline Strategi
- Dual EMA Golden Cross Strategi Terobosan
- Bull dan Bear Power Moving Average Strategi Perdagangan
- Strategi pelacakan pelarian VWAP
- Strategi Perdagangan Pembalikan Momentum
- Strategi Perdagangan Pelacakan Momentum
- Strategi tren rata-rata bergerak bertimbang ganda
- Strategi perdagangan berdasarkan Bollinger Bands dan MACD
- Strategi Leverage Macd Biru Merah
- Strategi Saluran Pengambilan Momentum
- Strategi pembalikan osilasi lindung nilai
- Strategi perdagangan kuantitatif berdasarkan Bollinger Bands dan RSI
- Strategi Indikator Volume Relatif