Ringkasan
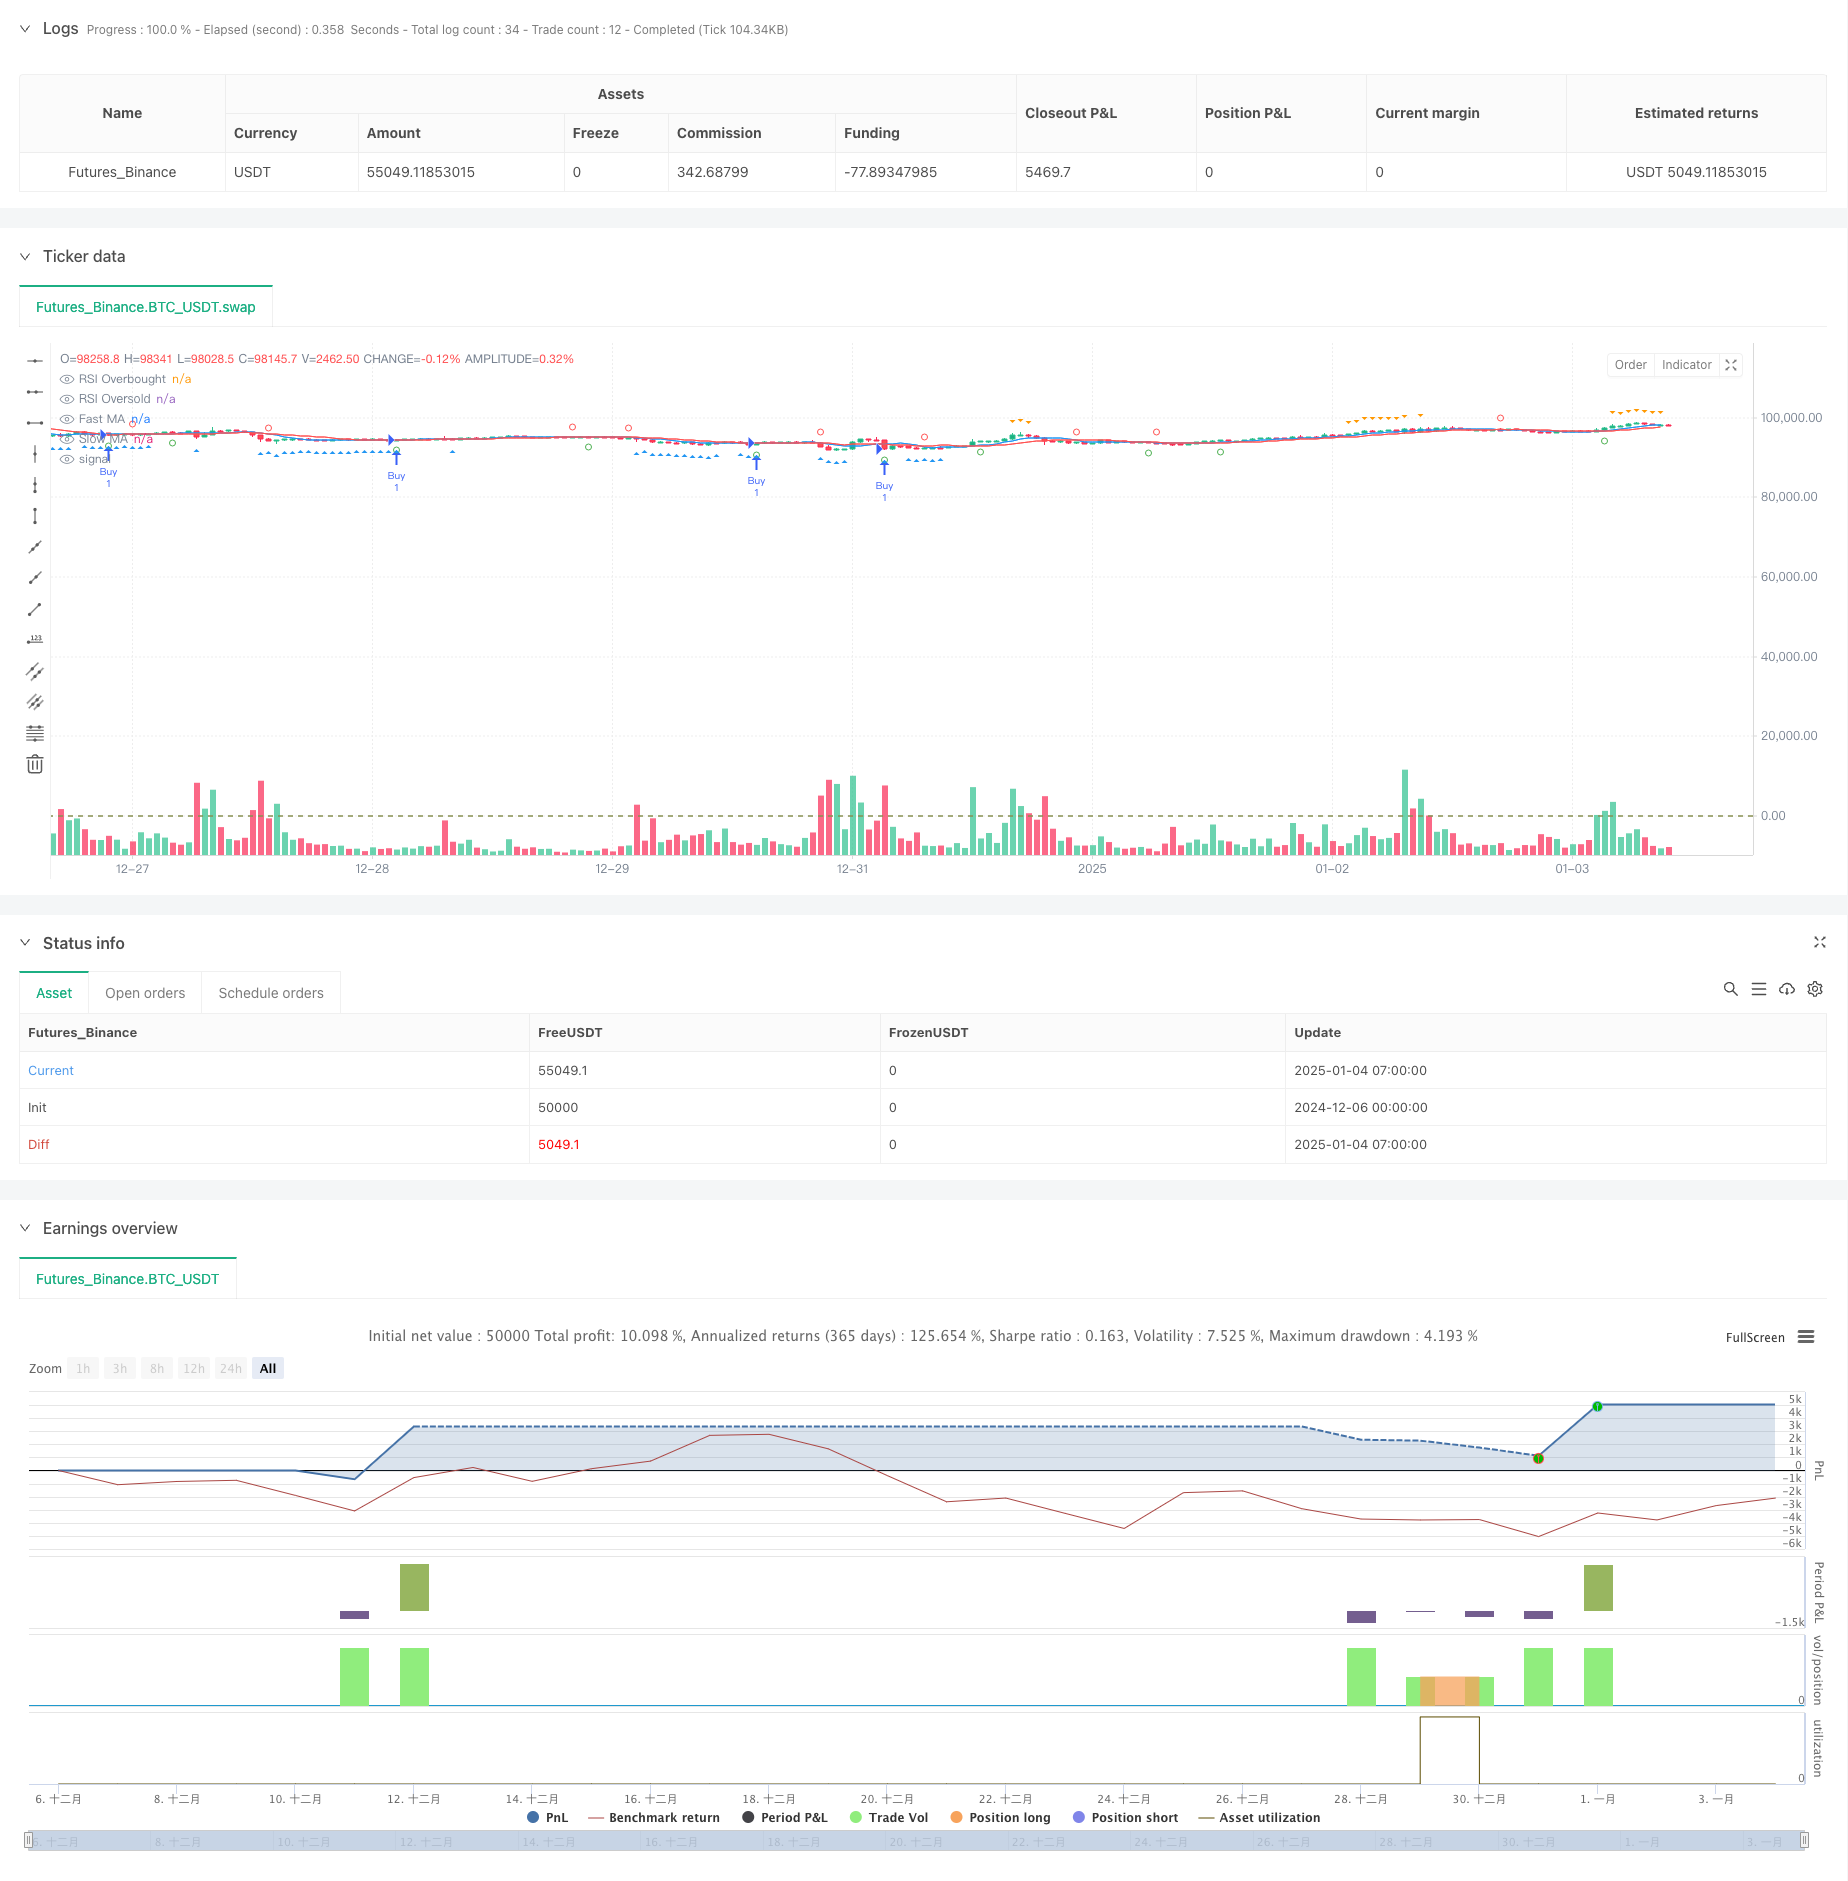
Strategi ini adalah sistem perdagangan kuantitatif berdasarkan persilangan rata-rata pergerakan dan indikator RSI, yang terutama digunakan untuk perdagangan di pasar opsi. Strategi ini menggunakan sinyal persilangan rata-rata pergerakan cepat dan lambat, dipadukan dengan level jenuh beli dan jenuh jual RSI untuk menentukan waktu transaksi, sekaligus menetapkan take-profit dan stop-loss untuk mengendalikan risiko. Strategi ini cocok untuk perdagangan pada kerangka waktu 5 menit.
Prinsip Strategi
Strategi ini menggunakan dua indikator teknis utama: Moving Average (MA) dan Relative Strength Index (RSI). Secara khusus:
- Gunakan simple moving average (SMA) periode 7 dan 13 untuk menangkap tren harga
- Menggunakan indikator RSI 17 periode untuk mengidentifikasi kondisi overbought dan oversold
- Ketika rata-rata pergerakan cepat melintasi rata-rata pergerakan lambat ke atas dan RSI berada di bawah 43, sistem menghasilkan sinyal panjang
- Ketika rata-rata pergerakan cepat melintasi rata-rata pergerakan lambat ke bawah dan RSI berada di atas 64, sistem menghasilkan sinyal pendek
- Tetapkan take profit 4% dan stop loss 0,5% untuk mengelola risiko
Keunggulan Strategis
- Mekanisme konfirmasi ganda: Gabungkan crossover moving average dan indikator RSI untuk memberikan sinyal perdagangan yang lebih andal
- Manajemen risiko yang sempurna: tetapkan persentase tetap stop-profit dan stop-loss untuk mengendalikan risiko secara efektif
- Kemampuan beradaptasi yang kuat: parameter dapat disesuaikan secara fleksibel sesuai dengan kondisi pasar yang berbeda
- Dukungan visualisasi: Strategi ini menyediakan instruksi grafis yang jelas untuk memudahkan pedagang memahami kondisi pasar
- Aturan operasi yang jelas: kondisi masuk dan keluar yang jelas, mengurangi gangguan yang disebabkan oleh penilaian subjektif
Risiko Strategis
- Risiko pasar yang fluktuatif: Sinyal palsu sering terjadi di pasar yang sideways dan fluktuatif
- Risiko slippage: Ketika pasar opsi tidak likuid, Anda mungkin menghadapi slippage yang besar
- Sensitivitas parameter: Efek strategi sensitif terhadap pengaturan parameter dan perlu dioptimalkan secara terus-menerus.
- Ketergantungan lingkungan pasar: Dalam lingkungan pasar yang fluktuatif, stop loss mungkin tidak cukup tepat waktu
- Risiko sistemik: Ketika terjadi kesenjangan pasar atau peristiwa besar, stop loss mungkin gagal
Arah optimasi strategi
- Memperkenalkan indikator volatilitas: Pertimbangkan untuk memasukkan ATR atau Bollinger Bands ke dalam sistem pengambilan keputusan Anda
- Mengoptimalkan adaptasi parameter: Mengembangkan mekanisme penyesuaian parameter dinamis berdasarkan kondisi pasar
- Tingkatkan penyaringan sentimen pasar: Gabungkan volume perdagangan dan indikator lain untuk menyaring sinyal palsu
- Meningkatkan mekanisme stop loss: pertimbangkan untuk memperkenalkan trailing stop loss untuk meningkatkan efisiensi manajemen risiko
- Tambahkan filter waktu: tambahkan batas waktu perdagangan untuk menghindari perdagangan yang tidak efisien
Meringkaskan
Strategi ini membangun sistem perdagangan yang relatif lengkap dengan menggabungkan persilangan rata-rata pergerakan dan indikator RSI. Keunggulan strategi ini terletak pada konfirmasi sinyal ganda dan manajemen risiko yang sempurna, namun perlu juga memperhatikan dampak lingkungan pasar terhadap kinerja strategi. Melalui optimalisasi dan perbaikan berkelanjutan, strategi ini diharapkan dapat mencapai kinerja yang stabil di pasar opsi. Disarankan agar pedagang melakukan pengujian ulang dan pengoptimalan parameter yang memadai sebelum penggunaan waktu nyata.
/*backtest
start: 2024-12-06 00:00:00
end: 2025-01-04 08:00:00
period: 1h
basePeriod: 1h
exchanges: [{"eid":"Futures_Binance","currency":"BTC_USDT"}]
*/

//@version=5
strategy("MA Crossover with RSI Debugging", overlay=true)

// Inputs
fastLength = input.int(7, title="Fast MA Length", minval=1)
slowLength = input.int(13, title="Slow MA Length", minval=1)
rsiLength = input.int(17, title="RSI Length", minval=1)
rsiOverbought = input.int(64, title="RSI Overbought Level", minval=50, maxval=100)
rsiOversold = input.int(43, title="RSI Oversold Level", minval=0, maxval=50)
takeProfitPerc = input.float(4, title="Take Profit (%)", minval=0.1)
stopLossPerc = input.float(0.5, title="Stop Loss (%)", minval=0.1)

// Moving Averages
fastMA = ta.sma(close, fastLength)
slowMA = ta.sma(close, slowLength)

// RSI
rsi = ta.rsi(close, rsiLength)

// Entry Conditions
longCondition = ta.crossover(fastMA, slowMA) and rsi < rsiOversold
shortCondition = ta.crossunder(fastMA, slowMA) and rsi > rsiOverbought

// Plot Debugging Shapes
plotshape(ta.crossover(fastMA, slowMA), color=color.green, style=shape.circle, location=location.belowbar, title="Fast MA Crossover")
plotshape(ta.crossunder(fastMA, slowMA), color=color.red, style=shape.circle, location=location.abovebar, title="Fast MA Crossunder")

plotshape(rsi < rsiOversold, color=color.blue, style=shape.triangleup, location=location.belowbar, title="RSI Oversold")
plotshape(rsi > rsiOverbought, color=color.orange, style=shape.triangledown, location=location.abovebar, title="RSI Overbought")

// Entry and Exit Execution
if (longCondition)
    strategy.entry("Buy", strategy.long)

if (shortCondition)
    strategy.entry("Sell", strategy.short)

takeProfitPrice = strategy.position_avg_price * (1 + takeProfitPerc / 100)
stopLossPrice = strategy.position_avg_price * (1 - stopLossPerc / 100)

if (strategy.position_size > 0)
    strategy.exit("Exit Buy", from_entry="Buy", limit=takeProfitPrice, stop=stopLossPrice)

if (strategy.position_size < 0)
    strategy.exit("Exit Sell", from_entry="Sell", limit=takeProfitPrice, stop=stopLossPrice)

// Plot Moving Averages
plot(fastMA, color=color.blue, title="Fast MA")
plot(slowMA, color=color.red, title="Slow MA")

// RSI Levels
hline(rsiOverbought, "RSI Overbought", color=color.red)
hline(rsiOversold, "RSI Oversold", color=color.green)