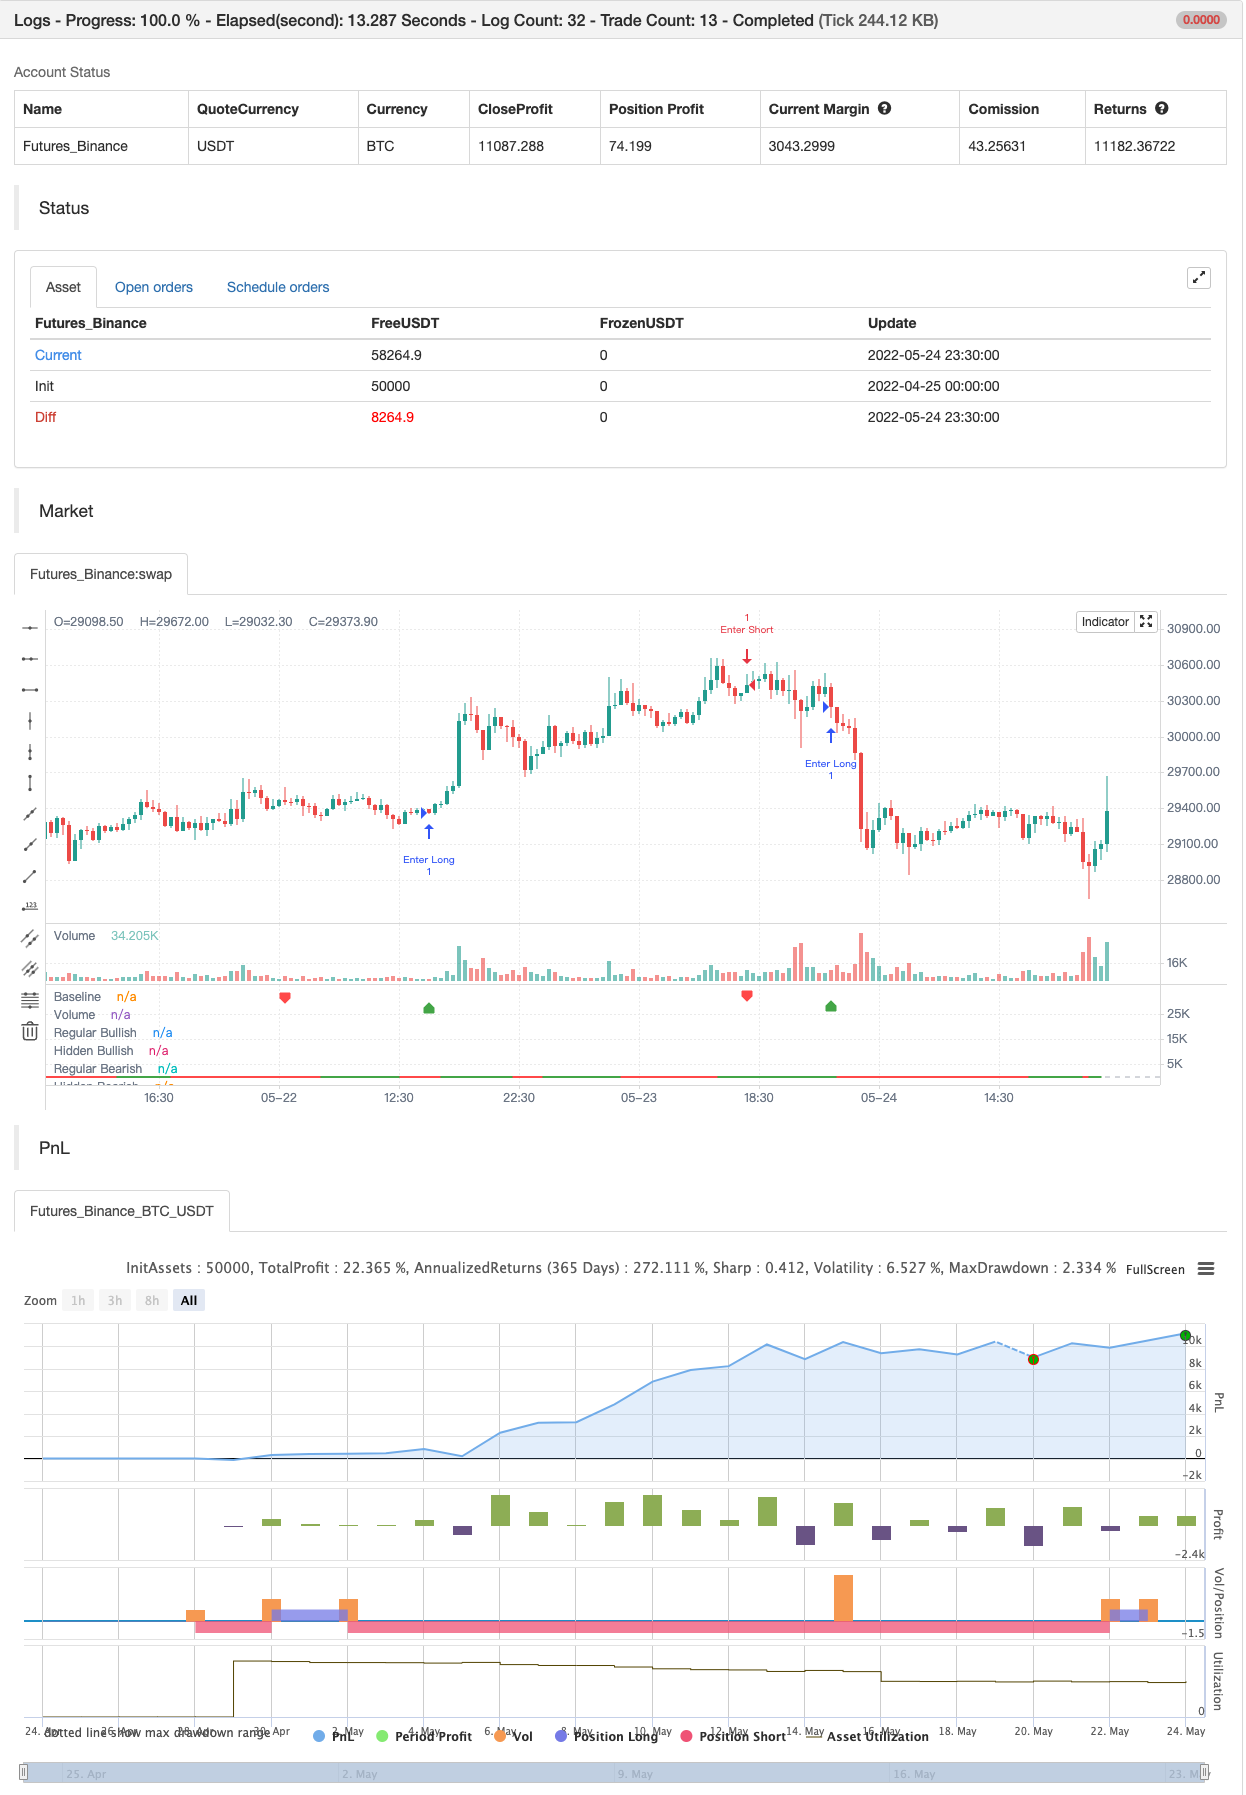
量差
作者: リン・ハーンチャオチャン開催日:2022年5月26日17時04分32秒タグ:WMAポイント
これは単にボリューム指標です.ボリューム上昇トレンドと減少トレンドの両方のブレイクを注意してください.ボリュームの滑らかな移動平均を構築するためにフィボナッチ数を使用します.
トレンド逆転やインパクト損失の差をチェックできます
バックテスト

/*backtest
start: 2022-04-25 00:00:00
end: 2022-05-24 23:59:00
period: 30m
basePeriod: 15m
exchanges: [{"eid":"Futures_Binance","currency":"BTC_USDT"}]
*/

// This source code is subject to the terms of the Mozilla Public License 2.0 at https://mozilla.org/MPL/2.0/
// © baymucuk

//@version=4
study(title="Volume Divergence by MM", shorttitle="Volume Divergence", format=format.volume)

pine_wma(x, y) =>
    norm = 0.0
    sum = 0.0
    for i = 0 to y - 1
        weight = (y - i) * y
        norm := norm + weight
        factor = close[i] < open[i] ? -1 : 1
        sum := sum + (x[i] * weight * factor)
    sum / norm

vl1 = input(defval=5, title="First Moving Average length", type=input.integer)
vl2 = input(defval=8, title="Second Moving Average length", type=input.integer)
vl3 = vl1 + vl2
vl4 = vl2 + vl3
vl5 = vl3 + vl4

v1 = pine_wma(volume, vl1)
v2 = pine_wma(v1, vl2)
v3 = pine_wma(v2, vl3)
v4 = pine_wma(v3, vl4)
vol = pine_wma(v4, vl5)

vol_color = vol > 0 ? color.green : color.red
hline(0, title="Baseline", color=color.silver, linewidth=1)
plot(vol, color=vol_color, linewidth=2, title="Volume")

lbR = input(title="Pivot Lookback Right", defval=5)
lbL = input(title="Pivot Lookback Left", defval=5)
rangeUpper = input(title="Max of Lookback Range", defval=60)
rangeLower = input(title="Min of Lookback Range", defval=5)
plotBull = input(title="Plot Bullish", defval=true)
plotHiddenBull = input(title="Plot Hidden Bullish", defval=false)
plotBear = input(title="Plot Bearish", defval=true)
plotHiddenBear = input(title="Plot Hidden Bearish", defval=false)

bearColor = color.red
bullColor = color.green
hiddenBullColor = color.new(color.green, 25)
hiddenBearColor = color.new(color.red, 25)
textColor = color.white
noneColor = color.new(color.white, 100)

plFound = na(pivotlow(vol, lbL, lbR)) ? false : true
phFound = na(pivothigh(vol, lbL, lbR)) ? false : true

_inRange(cond) =>
    bars = barssince(cond == true)
    rangeLower <= bars and bars <= rangeUpper

//------------------------------------------------------------------------------
// Regular Bullish

// vol: Higher Low
volHL = vol[lbR] > valuewhen(plFound, vol[lbR], 1) and _inRange(plFound[1])

// Price: Lower Low
priceLL = low[lbR] < valuewhen(plFound, low[lbR], 1)

bullCond = plotBull and priceLL and volHL and plFound

plot(
	 plFound ? vol[lbR] : na,
	 offset=-lbR,
	 title="Regular Bullish",
	 linewidth=2,
	 color=(bullCond ? bullColor : noneColor),
	 transp=0
	 )

plotshape(
	 bullCond ? vol[lbR] : na,
	 offset=-lbR,
	 title="Regular Bullish Label",
	 text=" Bull ",
	 style=shape.labelup,
	 location=location.absolute,
	 color=bullColor,
	 textcolor=textColor,
	 transp=0
	 )

//------------------------------------------------------------------------------
// Hidden Bullish

// vol: Lower Low
volLL = vol[lbR] < valuewhen(plFound, vol[lbR], 1) and _inRange(plFound[1])

// Price: Higher Low
priceHL = low[lbR] > valuewhen(plFound, low[lbR], 1)

hiddenBullCond = plotHiddenBull and priceHL and volLL and plFound

plot(
	 plFound ? vol[lbR] : na,
	 offset=-lbR,
	 title="Hidden Bullish",
	 linewidth=2,
	 color=(hiddenBullCond ? hiddenBullColor : noneColor),
	 transp=0
	 )

plotshape(
	 hiddenBullCond ? vol[lbR] : na,
	 offset=-lbR,
	 title="Hidden Bullish Label",
	 text=" H Bull ",
	 style=shape.labelup,
	 location=location.absolute,
	 color=bullColor,
	 textcolor=textColor,
	 transp=0
	 )

//------------------------------------------------------------------------------
// Regular Bearish

// vol: Lower High
volLH = vol[lbR] < valuewhen(phFound, vol[lbR], 1) and _inRange(phFound[1])

// Price: Higher High
priceHH = high[lbR] > valuewhen(phFound, high[lbR], 1)

bearCond = plotBear and priceHH and volLH and phFound

plot(
	 phFound ? vol[lbR] : na,
	 offset=-lbR,
	 title="Regular Bearish",
	 linewidth=2,
	 color=(bearCond ? bearColor : noneColor),
	 transp=0
	 )

plotshape(
	 bearCond ? vol[lbR] : na,
	 offset=-lbR,
	 title="Regular Bearish Label",
	 text=" Bear ",
	 style=shape.labeldown,
	 location=location.absolute,
	 color=bearColor,
	 textcolor=textColor,
	 transp=0
	 )

//------------------------------------------------------------------------------
// Hidden Bearish

// vol: Higher High
volHH = vol[lbR] > valuewhen(phFound, vol[lbR], 1) and _inRange(phFound[1])

// Price: Lower High
priceLH = high[lbR] < valuewhen(phFound, high[lbR], 1)

hiddenBearCond = plotHiddenBear and priceLH and volHH and phFound

plot(
	 phFound ? vol[lbR] : na,
	 offset=-lbR,
	 title="Hidden Bearish",
	 linewidth=2,
	 color=(hiddenBearCond ? hiddenBearColor : noneColor),
	 transp=0
	 )

plotshape(
	 hiddenBearCond ? vol[lbR] : na,
	 offset=-lbR,
	 title="Hidden Bearish Label",
	 text=" H Bear ",
	 style=shape.labeldown,
	 location=location.absolute,
	 color=bearColor,
	 textcolor=textColor,
	 transp=0
	 )


if bullCond
    strategy.entry("Enter Long", strategy.long)
else if bearCond
    strategy.entry("Enter Short", strategy.short)
関連コンテンツ
- 簡単なストック
- jma + dwma 多穀物による
- ブラーマストラ
- ピボット順序ブロック
- ピボットポイント 高低 多時間枠
- パインスクリプト戦略における月間リターン
- ピボットベース トレイリング マキシマ・ミニマ
- ウィリアムズ %R - 滑らか
- ハルフ移動平均スイングトレーダー
- 低スキャナー戦略暗号化
もっと見る