ダイナミックな利益目標を持つオープンレンジ戦略
作者: リン・ハーンチャオチャン,日付: 2023-09-10 00:10:22タグ:

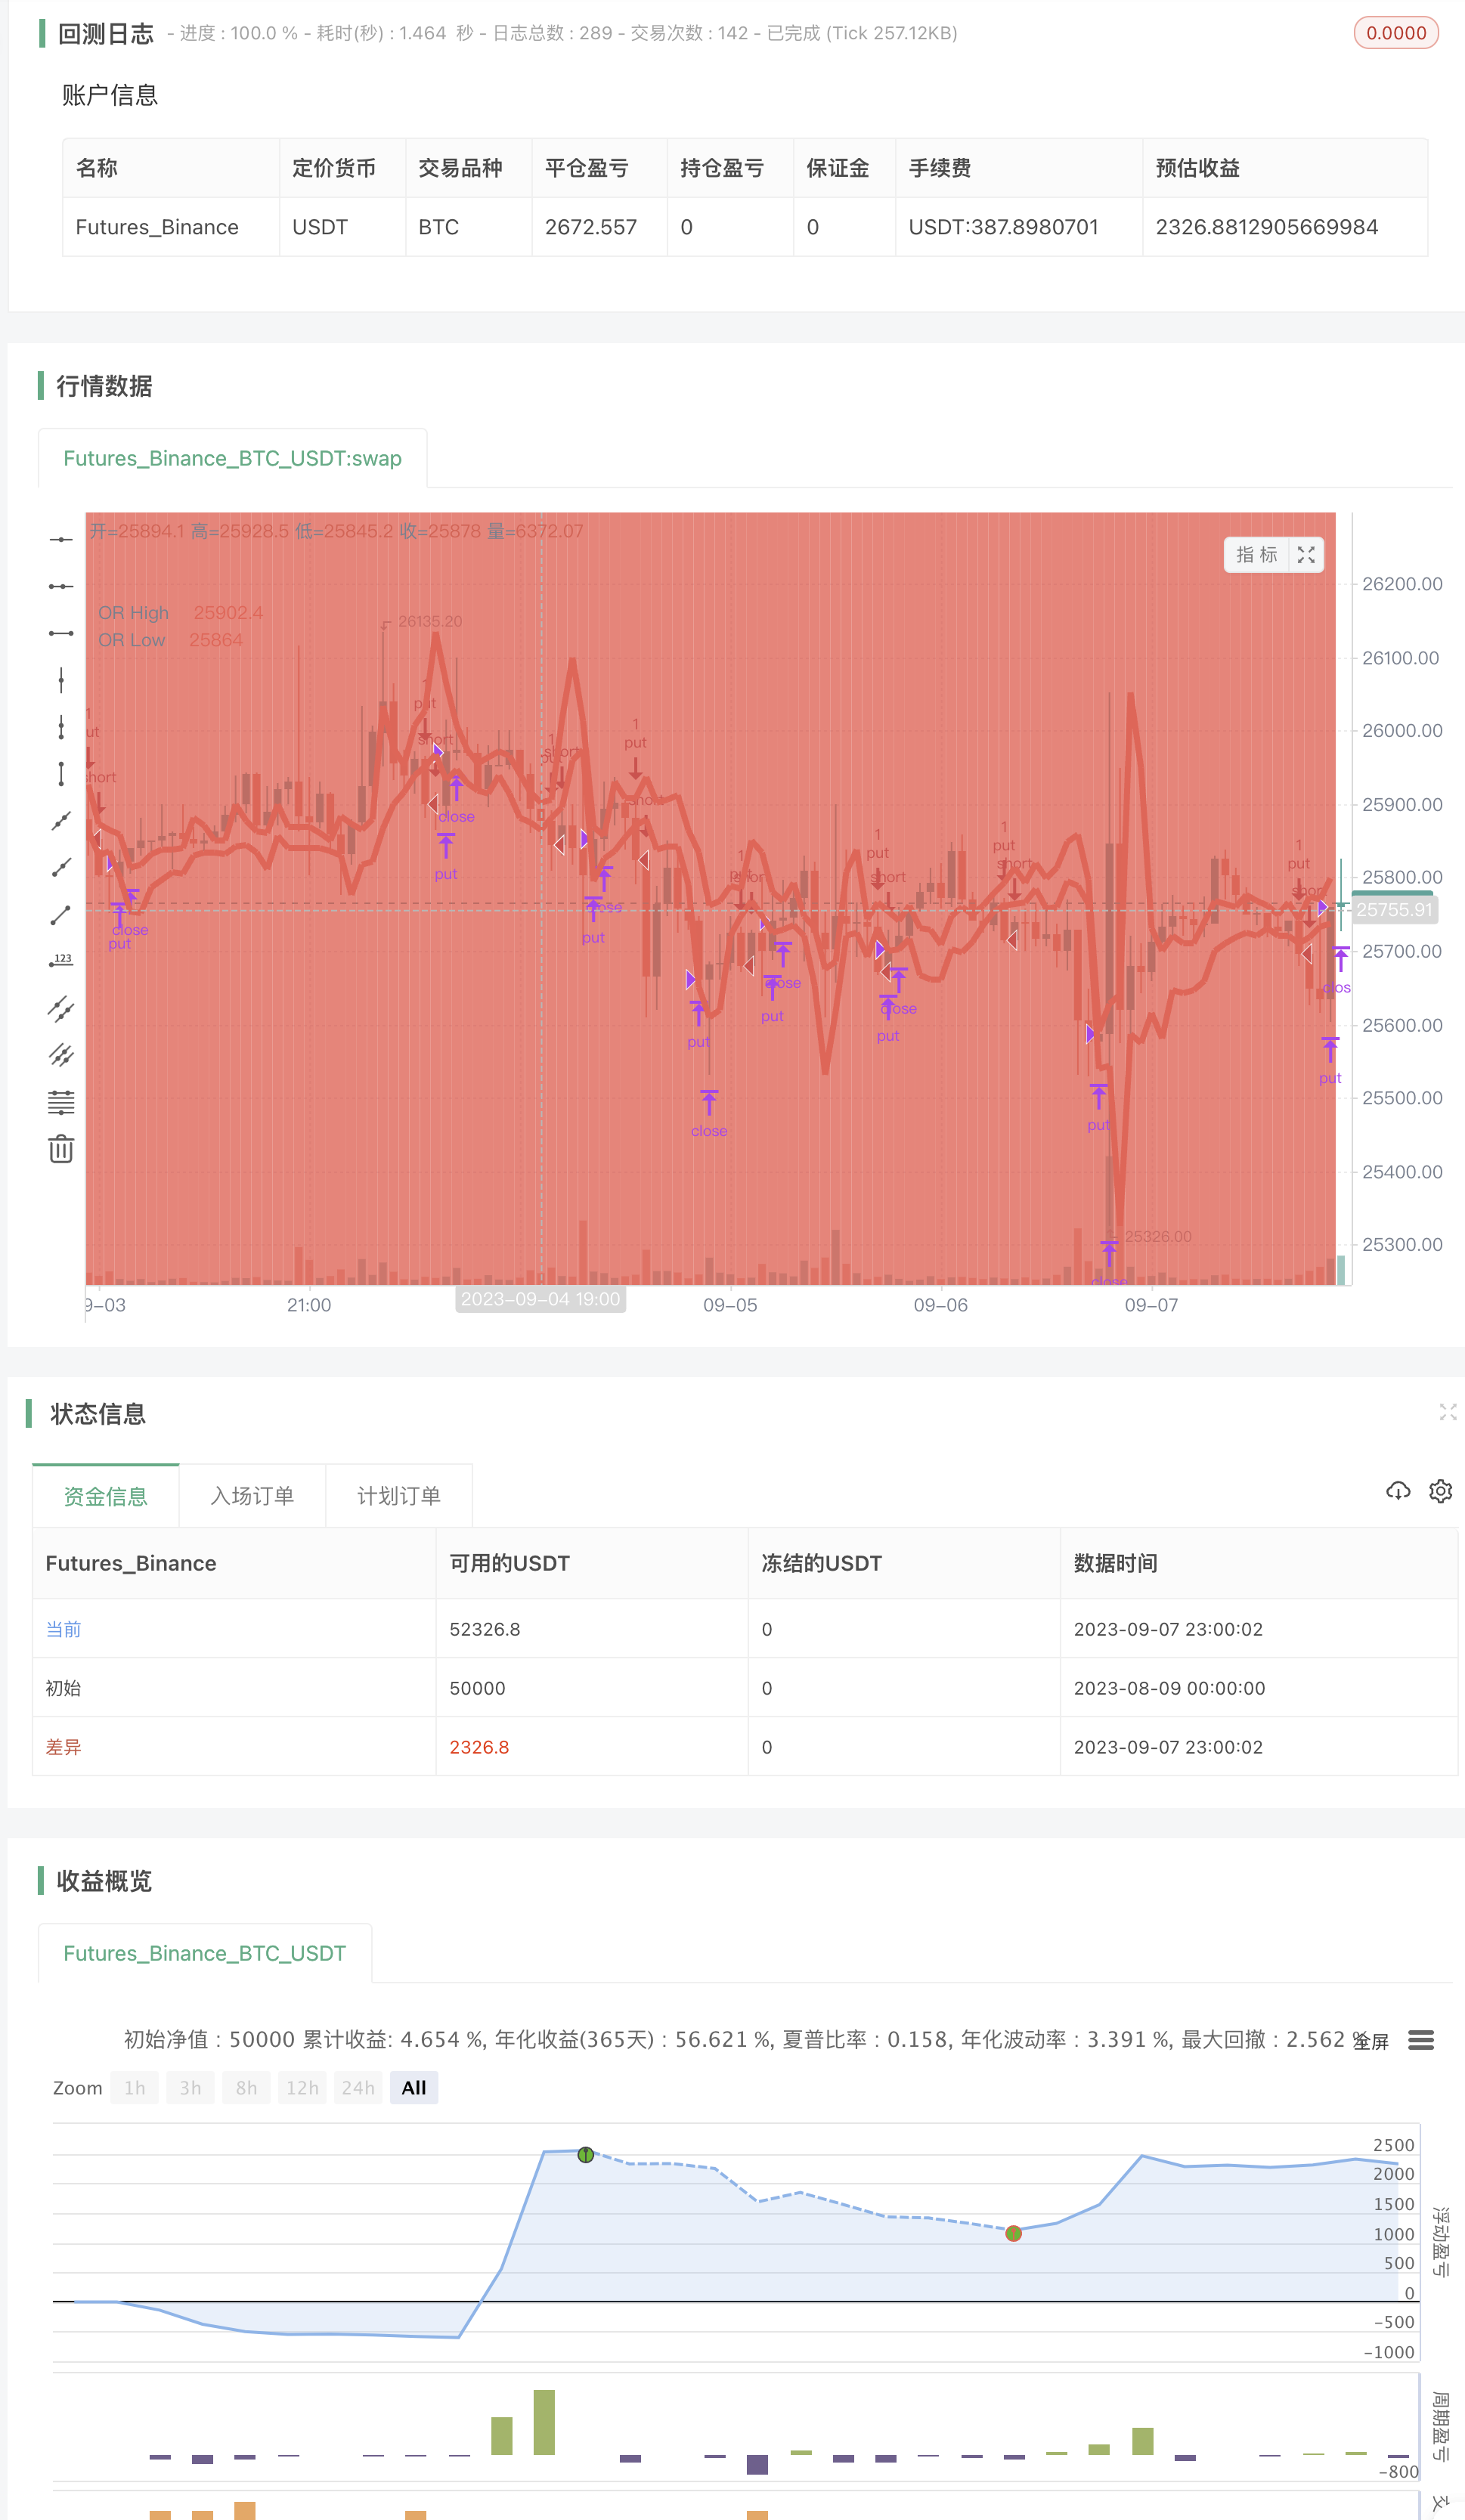
ダイナミック・プロフィート・ターゲットのオープン・レンジ戦略 (Open Range Strategy with Dynamic Profit Target) は,潜在的な取引機会を特定するために市場のオープニング・レンジを使用する技術的取引戦略である.この戦略は,市場のオープニング・レンジが短期的に市場の方向性について貴重な情報を提供できるという考えに基づいている.
この戦略は,まず市場のオープニングレンジを計算することによって機能する.オープニングレンジは,取引日の最初のバーの高価格と低価格の違いである.その後,戦略は,オープニングレンジ上のまたは下のブレイクを探して潜在的な取引機会を特定する.
ストラテジーは,価格が開拓範囲を超えると,ロングポジションに入ります.価格が開拓範囲を下回ると,ストラテジーはショートポジションに入ります.価格が既定の利益目標またはストップ損失に達すると,ストラテジーはポジションを退きます.
戦略の利益目標は動的であり,価格の動きに応じて変化することを意味します. 利益目標は開拓範囲と市場の現在の価格に基づいて計算されます. 価格は開拓範囲の事前に決定されたパーセントに達すると戦略はポジションを退場します.
ストップ・ロスは,ストップ・ロスは,ストップ・ロスの値が変動するにつれて変化する.ストップ・ロスは,市場の現在の価格と開口範囲の事前決定された割合に基づいて計算されます.ストップ・ロスは,ストップ・ロスの値に達した場合,ストップ・ロスは終了します.ストップ・ロスは,ストップ・ロスの値に達した場合,ストップ・ロスは終了します.ストップ・ロスは,ストップ・ロスの値に達した場合,ストップ・ロスは終了します.ストップ・ロスは,ストップ・ロスの値に達した場合,ストップ・ロスは終了します.ストップ・ロスは,ストップ・ロスの値に達した場合,ストップ・ロスは終了します.ストップ・ロスは,ストップ・ロスの値に達した場合,ストップ・ロスは終了します.ストップ・ロスは,ストップ・ロスの値に達した場合,ストップ・ロスは終了します.
ダイナミック・プロフィート・ターゲットのオープン・レンジ戦略は,比較的シンプルな戦略ですが,短期間の取引機会を特定するのに効果的です.しかし,どの取引戦略も利益をもたらすことは保証されないことを覚えておくことが重要です.ライブ・トレーディングで使用する前に,戦略を歴史的なデータでバックテストすることが常に重要です.
戦略の様々な構成要素について詳しく説明します.
- オープニングレンジ:オープニングレンジは,取引日の最初のバーの高価格と低価格の違いである.それは日の初めの市場の変動を測定するものです.
- ブレイクアウト:ブレイクアウトは,価格が開拓範囲を超えたり,以下になったりすると発生する.これは市場がブレイクアウトの方向に動き続ける可能性が高いという信号です.
- 利益目標: 利益目標とは,戦略がポジションを終了する前に達成しようとする開拓範囲の事前に決定された割合です.
- ストップ・ロスは,市場がトレードに逆行した場合,戦略がポジションを退場する事前の価格です. ダイナミック・プロフィート・ターゲットのオープン・レンジ戦略は,さまざまなタイムフレームや市場で使用できる汎用的な戦略である.しかし,この戦略はトレンド市場で最も有効であることを注意することが重要です.不安定な市場では,この戦略は多くの誤った信号を生む可能性があります.
ダイナミック・プロフィート・ターゲットのオープン・レンジ・戦略を使用するためのヒントは以下の通りです
- ストップ・ロスを使って 利益を守ります
- 市場が有利に動くと 利益を得るためにストップロスを使います
- リアルタイムの取引に使う前に ストラテジーを過去データでバックテストします
- ダイナミック・プロフィート・ターゲットのオープン・レンジ戦略によって生じるシグナルを確認するために,他の様々な指標を使用します. ダイナミック・プロフィート・ターゲットのオープン・レンジ戦略は,短期間の取引機会を特定するために使用できる強力なツールです.しかし,戦略を賢く使用し,その限界を理解することは重要です.上記のヒントに従うことで,この戦略を使用する際に成功の機会を高めることができます.
この 記事 が 役立ち た と 思います.それ以外 の 疑問 が ある なら 教えて ください.
/*backtest
start: 2023-08-09 00:00:00
end: 2023-09-08 00:00:00
period: 1h
basePeriod: 15m
exchanges: [{"eid":"Futures_Binance","currency":"BTC_USDT"}]
args: [["v_input_10",true]]
*/

//@version=2
//Created by Frenchy/lisfse/Francois Seguin on 2019-01-22"
strategy(title="Open_Range_Strategy_with_dynamic_PT_by_frenchy", shorttitle="O/R Strategy Dynamic PT  ", overlay=true)

// === INPUT BACKTEST RANGE ===
FromMonth = input(defval = 1, title = "From Month", minval = 1, maxval = 12)
FromDay   = input(defval = 1, title = "From Day", minval = 1, maxval = 31)
FromYear  = input(defval = 2017, title = "From Year", minval = 2010)
ToMonth   = input(defval = 1, title = "To Month", minval = 1, maxval = 12)
ToDay     = input(defval = 1, title = "To Day", minval = 1, maxval = 31)
ToYear    = input(defval = 9999, title = "To Year", minval = 2016)
// === FUNCTION EXAMPLE ===
start     = timestamp(FromYear, FromMonth, FromDay, 00, 00)  // backtest start window
finish    = timestamp(ToYear, ToMonth, ToDay, 23, 59)        // backtest finish window
window()  => time >= start and time <= finish ? true : false // create function "within window of time"


// === INPUT SESSION RANGE ===
SessionLenght = input('0930-1100',  title="Session Lenght")
res = input('30', title="Length Of Opening Range?")
Notradetime= time('30', '0930-1000')
Tradetime= time('1', '1000-1100')

// === LONG/SHORT STRATEGY AND ALERT SELECTION     ===

Select_long = input(true, title="Long Strategy and alert ?")
Select_short = input(false, title="Short Strategy and alert ?")


//Session Rules
sessToUse = SessionLenght
bartimeSess = time('D', sessToUse)
fr2to17 =  time(timeframe.period, sessToUse)
newbarSess = bartimeSess != bartimeSess[1]
high_range = valuewhen(newbarSess,high,0)
low_range = valuewhen(newbarSess,low,0)
adopt(r, s) => security(syminfo.tickerid, r, s)


//Formula For Opening Range
highRes = adopt(res, high_range)
lowRes = adopt(res, low_range)
range = highRes - lowRes

//Highlighting Line Rules For Opening Range
highColor = Notradetime  ? red : green
lowColor = Notradetime  ? red : green


//Plot Statements For Opening Range Lines
openRangeHigh = plot(fr2to17 > 0 ? highRes : na, color=highColor, style=linebr, linewidth=4,title="OR High")
openRangeLow = plot(fr2to17 > 0 ? lowRes : na, color=lowColor, style=linebr, linewidth=4,title="OR Low")


//Price definition
price = security(syminfo.tickerid, timeframe.period, close)
haclose = ((open + high + low + close)/4)
//aopen = na(haopen[1]) ? (open + close)/2 : (haopen[1] + haclose[1]) / 2
MA20= sma(price,20)


//Plots For Profit Targe 2
bgcolor(Notradetime? red:na)


///////////////////////////////////////Strategy Definition ///////////////////////////////////////////////////////////////


/////////////////////////////////////////Long Strategy////////////////////////////////////////////////////////////////////
//Enter Strategy Long criteria
Enterlong = (crossover(price,highRes) and Select_long and Tradetime ? 1:0 ) and (Notradetime ? 0:1)
plotarrow(Enterlong, color=black, style=shape.triangleup, text="Enter", location=location.belowbar, minheight = 80, maxheight=80, offset=0)

//Exit Strategy Long  criteria
Exitlong  = crossunder(price,highRes) or crossunder(price,MA20)
//plotshape(Exitlong, color=black, style=shape.triangledown, text="Exit", location=location.abovebar)

/////////////////////////////////////////Long Strategy Excution////////////////////////////////////////////////////////
strategy.entry ("Call", strategy.long, when=Enterlong and window())
strategy.close("Call", when=Exitlong and window())


//////////////////////////////////////////Short Strategy////////////////////////////////////////////////////////////////

//Enter Strategy Short criteria
Entershort = crossunder(price,lowRes) and time(res, SessionLenght) and Select_short ? 1:0

// Exit Strategy short criteria
Exitshort  =  crossover(price,lowRes) or crossover(haclose,MA20)


///////////////////////////////////////Strategy execution Short///////////////////////////////////////////////////////

strategy.entry ("put", strategy.short, when=Entershort and window())
strategy.close("put", when=Exitshort and window())
- ストカスティックRSI取引戦略
- SMAクロスオーバー取引戦略
- アップトレンドとオーバーセールド インデックス・スウィング・トレーディング・システム戦略
- 多項式回帰を用いた定量的なトレンド取引戦略
- コンボ バックテスト 123 リバースメント&相対変動指数
- SMA-3 トレーディング 戦略
- ボリンジャー・バンド自動取引戦略
- ジェネシス・クロスオーバー・トレーディング・戦略
- ガンボット 集団 の 戦略
- パア取引戦略
- 逆転戦略の勢いを絞る
- 最良のスーパートレンド戦略
- 逆転システム
- アダプティブ・ゼロ・レイグ・EMA戦略
- BVのICHIMOKUクラウド - すべての信号
- 相対強度指数戦略
- ボリンジャー・バンド + EMA 9
- シンプル EMA20 戦略 + ストカスティック
- NTPCclient UDP&& エクスチェンジサーバーの遅延
- VWMA + SMA ボリンジャーバンド + RSI 戦略:価格とボリュームの相関を分析する