MCL-YG ボリンジャー・バンド・ブレークアウト・ペア・トレーディング・戦略
作者: リン・ハーンチャオチャン,日付: 2023-11-14 13:49:12タグ:

概要
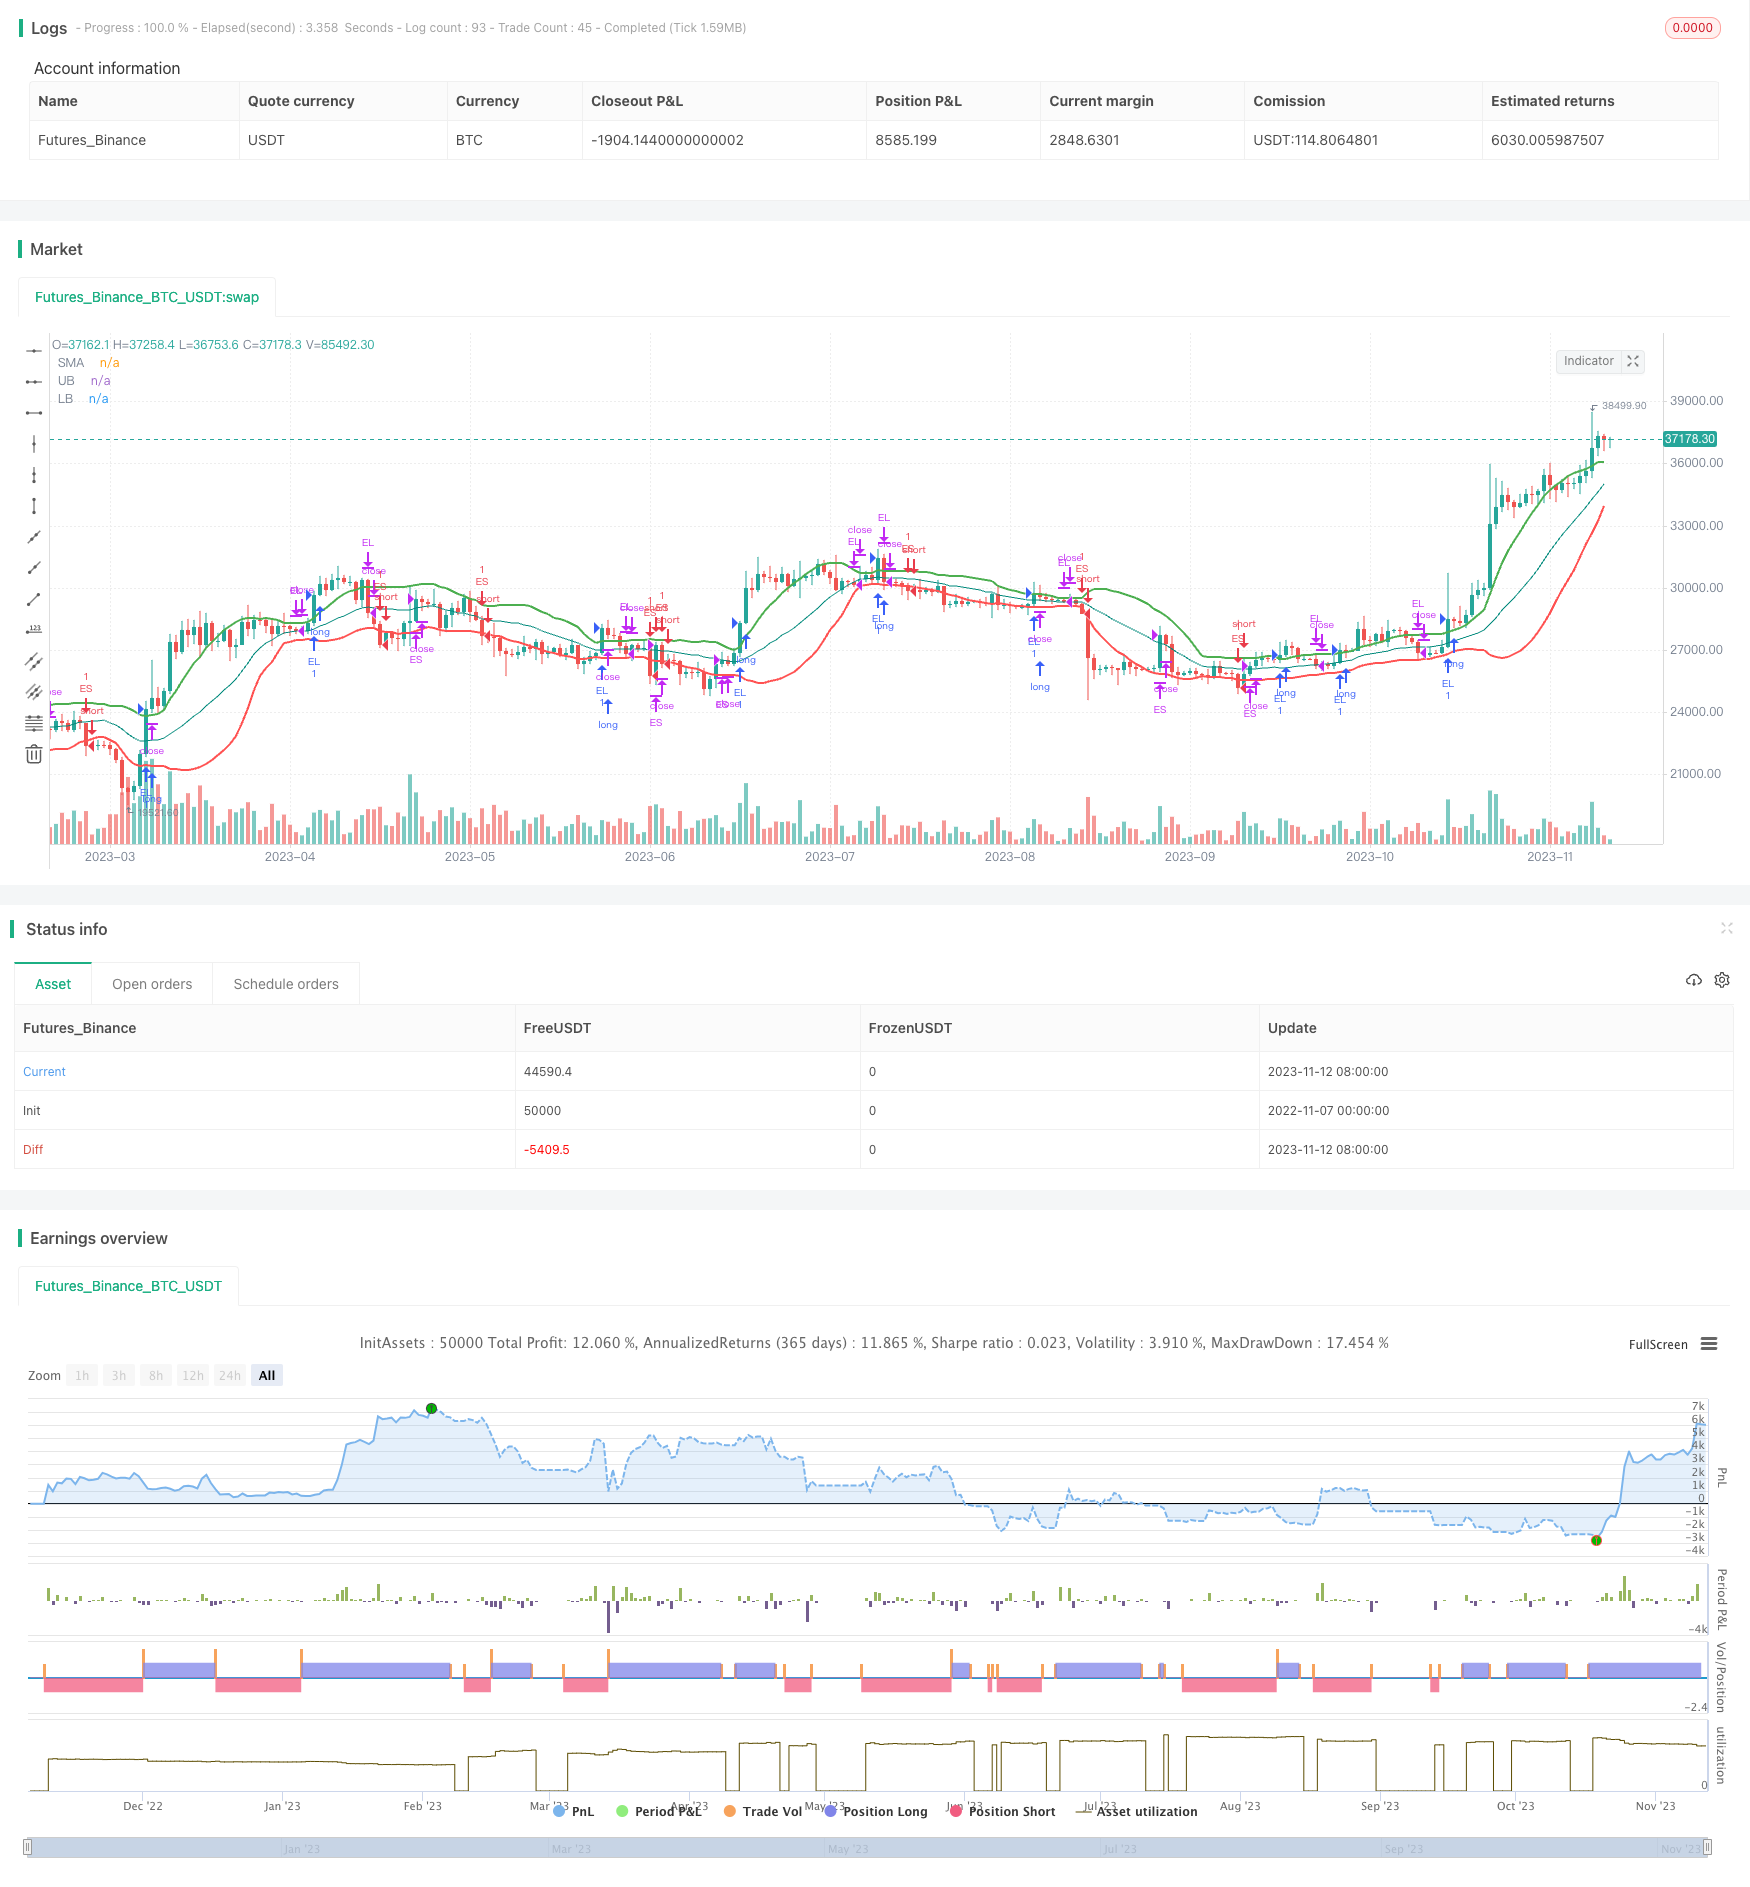
この戦略は,トレード信号を生成し,2つの肯定的な相関性のある資産MCLとYGの間のペア取引を実装するためにボリンガーバンドブレイクアウトを使用します.MCL価格が上部帯に触るとMCLとYGを短くし,MCL価格が下部帯に触るとMCLとYGを短くし,価格トレンドに沿って取引します.
戦略の論理
まず,戦略は,特定の期間中の閉値に基づいてSMAラインとStdDevを計算する.その後,SMAの上下をオフセットしてボリンジャーバンドの上下帯を形成する.価格が上帯に触ると購入信号,価格が下帯に触ると販売信号が生成される.
この戦略は,ボリンジャーバンドのブレイクアウト取引論理を利用する.価格が上部帯を超えるとロング,下部帯を下回るとショート.ボリンジャーバンドは,市場変動に基づいてバンドの幅を動的に調整し,変動期間中に市場のノイズをフィルタリングするのに役立ちます.固定チャネルバンドとは異なり,ボリンジャーバンドは,高い波動度において拡大し,低い波動度において狭くなります.これは,波動性が高いときにいくつかのノイズをフィルタリングし,波動性が低いときに小さなブレイクを捕捉することができます.
MCLとYGの間のペア取引を実装する.MCLが上部帯を超えると,MCLが上昇傾向にあることを示します.戦略は,MCLとYGを長引く - より強い資産を購入し,より弱い資産を売って,価格の差異から利益を得ます.
利点
- ボリンジャー・バンドに基づいたブレイクアウト取引は,市場の騒音を効果的にフィルターし,トレンドを特定することができます.
- 関連資産のペア取引は,価格差からアルファリターンを得ることができます.
- ダイナミックなポジションサイズ化により,個々の取引のリスクを制御できます
- 標準的なブレイクアウトエントリーとリバーション出口ロジックは,戦略ロジックをシンプルで明確にする
リスク
- ボリンジャー・バンドのパラメータの調節が不十分である場合,信号が多すぎたり,信号が不透明になる可能性があります.
- 資産間の相関率が低下すると,ペア取引からの利益が減少する可能性があります.
- ブレイクアウトは,不安定な市場での誤った信号によって騙され,損失を引き起こす可能性があります
- ストップロスのない場合,単一の取引で損失が増加する可能性があります.
パラメータを最適化し,より強い相関性と流動性を持つ資産を選択し,適切なストップロスを設定することでリスクを軽減することができます.
最適化 の 機会
- 最適な組み合わせを見つけるためにボリンガー帯のパラメータを最適化
- より多くの関連性のある資産ペアをテストし,最良の組み合わせを選択します
- 単一の取引の損失を制限するためにストップ損失ロジックを追加
- 偽のブレイク信号を避けるためにより多くのフィルターを追加します.
- 入力タイミングを改善するために,ボリューム確認などの他の要因を組み込む
概要
ストラテジーは,ボリンジャーバンドでトレンドを把握し,ペア取引からアルファを獲得する.しかし,パラメータ調節,ストップ損失,ペア選択の改善には余地があります.パラメータ,取引車両,トレンドフィルターなどのさらなるテストは戦略のパフォーマンスを向上させることができます.
/*backtest
start: 2022-11-07 00:00:00
end: 2023-11-13 00:00:00
period: 1d
basePeriod: 1h
exchanges: [{"eid":"Futures_Binance","currency":"BTC_USDT"}]
*/

// This source code is subject to the terms of the Mozilla Public License 2.0 at https://mozilla.org/MPL/2.0/
// © shark792

//@version=5

// 1. Define strategy settings
strategy(title="MCL-YG Pair Trading Strategy", overlay=true,
     pyramiding=0, initial_capital=10000,
     commission_type=strategy.commission.cash_per_order,
     commission_value=4, slippage=2)

smaLength = input.int(title="SMA Length", defval=20)
stdLength = input.int(title="StdDev Length", defval=20)

ubOffset = input.float(title="Upper Band Offset", defval=1, step=0.5)
lbOffset = input.float(title="Lower Band Offset", defval=1, step=0.5)

usePosSize = input.bool(title="Use Position Sizing?", defval=true)
riskPerc   = input.float(title="Risk %", defval=0.5, step=0.25)


// 2. Calculate strategy values
smaValue = ta.sma(close, smaLength)
stdDev   = ta.stdev(close, stdLength)

upperBand = smaValue + (stdDev * ubOffset)
lowerBand = smaValue - (stdDev * lbOffset)

riskEquity  = (riskPerc / 100) * strategy.equity
atrCurrency = (ta.atr(20) * syminfo.pointvalue)
posSize     = usePosSize ? math.floor(riskEquity / atrCurrency) : 1


// 3. Output strategy data
plot(series=smaValue, title="SMA", color=color.teal)

plot(series=upperBand, title="UB", color=color.green,
     linewidth=2)
plot(series=lowerBand, title="LB", color=color.red,
     linewidth=2)


// 4. Determine long trading conditions
enterLong = ta.crossover(close, upperBand)
exitLong  = ta.crossunder(close, smaValue)


// 5. Code short trading conditions
enterShort = ta.crossunder(close, lowerBand)
exitShort  = ta.crossover(close, smaValue)


// 6. Submit entry orders
if enterLong
    strategy.entry(id="EL", direction=strategy.long, qty=posSize)

if enterShort
    strategy.entry(id="ES", direction=strategy.short, qty=posSize)


// 7. Submit exit orders
strategy.close(id="EL", when=exitLong)
strategy.close(id="ES", when=exitShort)
- 期間制限付きの二重MA戦略
- トレンドフォロー戦略 移動平均と超トレンドに基づいた
- 簡単な移動平均のクロスオーバー戦略
- 二重取利益移動平均クロスオーバー量的な戦略
- RSI オシレーター カメ トレーディング 短期戦略
- マッキンリー移動平均取引戦略
- 改善された渦輪指標に基づく定量的な取引戦略
- 多期トレンド追跡戦略
- 双方向オシレーターパターン戦略
- モメントスプレス戦略
- 双重確認の逆転取引戦略
- トレンド逆転追跡ストップ損失戦略
- 週末の取引戦略
- ANN ベースの量的な取引戦略
- モメントブレイク戦略
- 双重MACD量的な取引戦略
- コーン・ムービング・平均バランス・トレード戦略
- 二重逆転入国戦略
- モメント市場情緒指標戦略
- モメントスプレイス ブレイクアウト トレンド追跡戦略