RSIトレンドフォロー戦略
概要
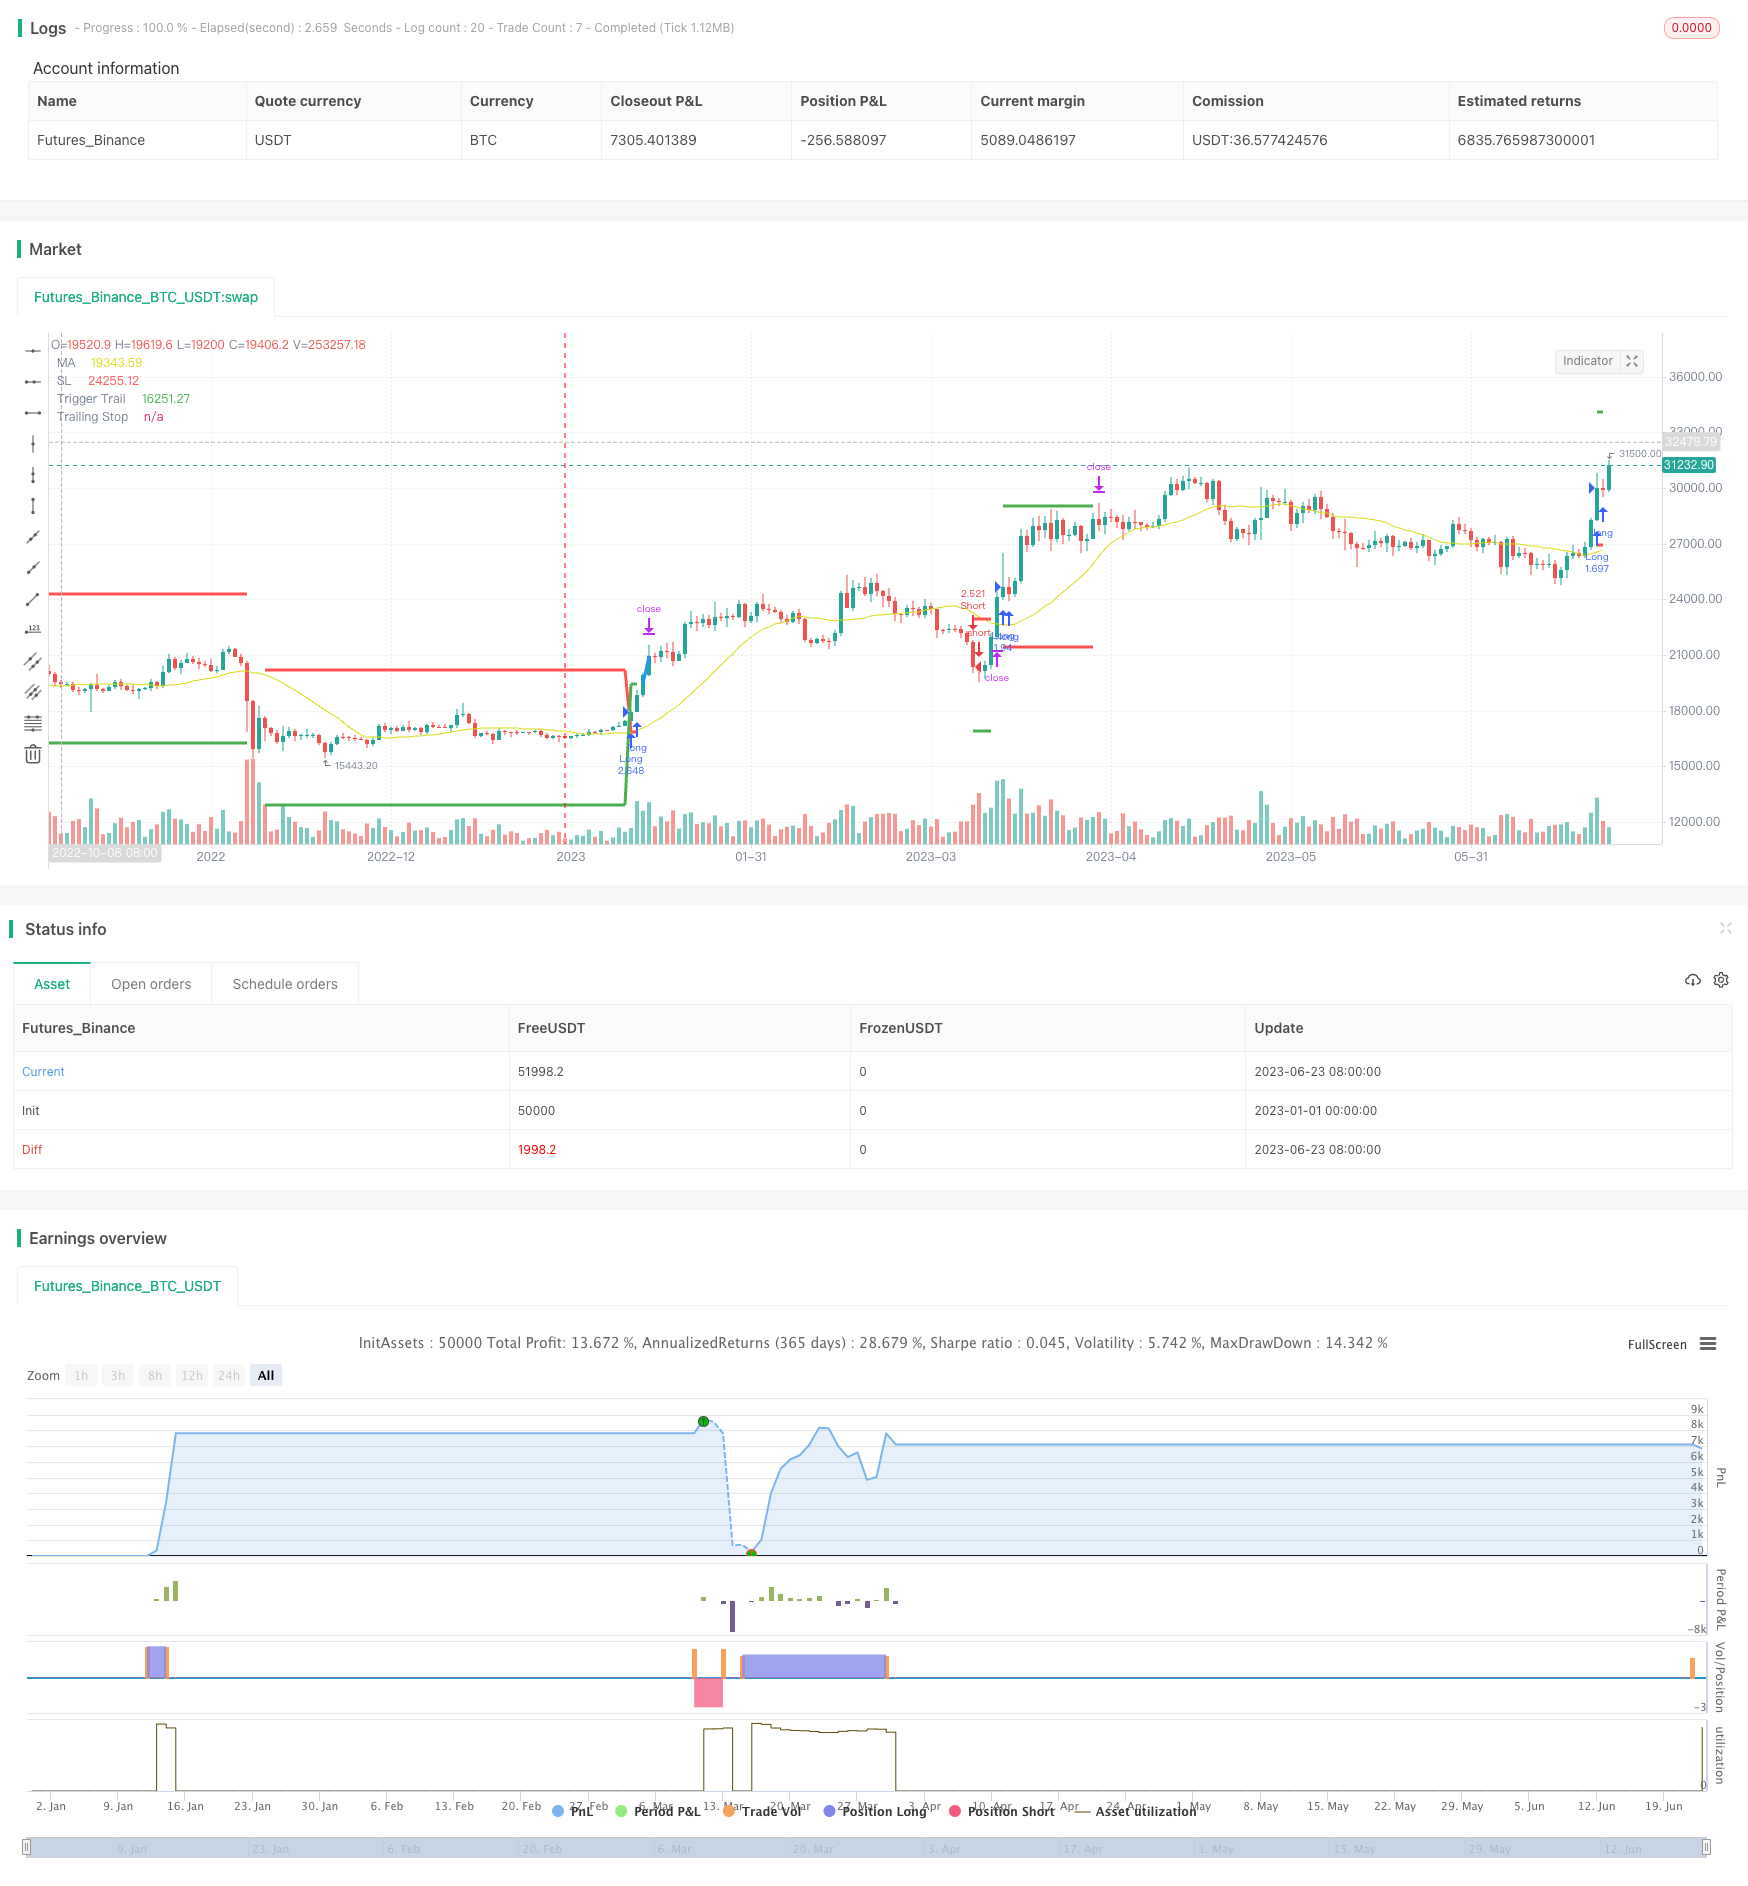
この戦略は,RSI指数と重み付けの移動平均を組み合わせて,トレンドフォローの取引を実現する. RSIが60を超えると看板になり,RSIが40を下回ると看板になり,移動平均がトレンド条件を満たすように要求する.40サイクルRSIをトレンドフォローの指標として採用する.重み付けの移動平均は,異なる重み付けによって短期変動の影響を軽減する.戦略は,同時に,リスクを管理するために,止損と移動ストップを設定する.
戦略原則
この戦略は,まずRSIと加重移動平均を計算する. RSIの長さは20周期で,加重移動平均の長さは20で,短期的な変動の影響を減らすために重み設定が大きい. RSIが60より大きく,加重移動平均の変動率は1%未満であるとき,多操作を実行する. RSIが40より小さく,加重移動平均の変動率は1%以上であるとき,空き操作を実行する.
余分な空白を行った後,同時にストップ・ロズとモバイル・ストップ・ロズを設定する. ストップ・ロズは現在の価格から3倍ATR; モバイル・ストップの初期アクティベーション価格は現在の価格から4倍ATR,その後は3%の幅で移動する. 価格がストップ・ロズまたはモバイル・ストップ・アクティベーション価格に触れたとき,対応するポジションを閉鎖する.
この戦略には,固定比率法によってポジションを調整する資金管理の規則も加えられている. 利益や損失が固定金額に達するたびに,固定数の取引量を増加または減少させる.
優位分析
- RSIはトレンドを判断し,トレンドを効果的に追跡します.
- 重み付けの移動平均は,異なる重み付けによって短期変動の影響を軽減し,套期を回避します.
- モバイルストップを利用して利益を増やす
- 固定比率法 資金管理 効果的なリスク管理
この戦略の全体的な優位性は,トレンドを追跡し,同時に,リスクを制御するために,ストップとモビルのストップを取ることで,強気な状況でより良いリターンを得ることができるという点にあります.
リスク分析
- RSIは誤った信号を発し,不必要な取引を誘導する
- ストップを突破したり,ストップを移動したりすると,ストップを強制的に停止し,トレンドを継続的に追跡することができません.
- 資金管理のルールは過度に激しくなり,大きな損失を招く可能性があります.
この戦略の主なリスクは,RSI指標の信頼性と,ストップ・モビルのストップ・セットが合理的であることにある.パラメータが正しく設定されていない場合,不必要な平仓または耐受性を超える損失を引き起こす可能性がある.さらに,ストップ・ストップまたはストップ・価格を破るときにストップを強制され,トレンドを継続するチャンスを失う可能性がある.
RSIのパラメータを最適化したり,他の指標の補助判断を改変したりすることも考えられます. 異なる品種と変動状況に合わせてストップ・ローズ・モバイル・ストップのパラメータを調整してください. 最後に,資金管理のルールを慎重に設定し,リスクの承受能力を超えてしまうことを避けるために過度に過激にしないでください.
最適化の方向
- KD,MACDなどの他の指標とRSIを組み合わせてシグナル確認を試みる
- 異なる品種特性と波動範囲に応じて最適化されるストープダスト移動ストップパラメータ
- 固定金取引やケリー公式などの資金管理方法を試す
- ポジション開設条件を追加します. ブリンラインを突破したり,RSIを背離したりします.
- スタート価格への追加を考慮し,強気なトレンドでポジションを追加する
この戦略は,多くの点で最適化できます. まず,RSI指標を補足または確認できる他の技術指標を探し,信号の信頼性を向上させることです. 次に,特定の品種の特性に合わせて,ストップ・ロズ・モバイル・ストップパラメータを最適化することが非常に重要です.
要約する
RSIトレンド追跡戦略の全体的な考え方は明確であり,その核心はRSIを使用してトレンドの方向を判断し,移動平均を重み付けることで判断の正確性を向上させることにある.戦略の優点は,トレンドを追跡し,利潤を最大限にロックでき,同時にリスクを管理するためにストップと資金管理を設定することです.しかし,RSI指標の信頼性が低いこととパラメータの設定には最適化可能なスペースがあります.我々は,停止信号指標,損失移動ストップパラメータ,資金管理方法などの最適化から始めることができます.
||
Overview
This strategy combines the RSI indicator and weighted moving average for trend following trading. It goes long when RSI is above 60 and goes short when RSI is below 40, with the moving average verifying the trend condition. The 40-period RSI acts as a trend following indicator. The weighted moving average uses different weights to reduce the impact of short-term fluctuations. The strategy also employs stop loss and trailing take profit to control risks.
Strategy Logic
The strategy firstly calculates the RSI and weighted moving average. The RSI length is 20 periods and the weighted MA length is 20 with higher weights that reduce the impact of short-term volatility. It goes long when RSI is above 60 and weighted MA rate of change is below -1%. It goes short when RSI is below 40 and weighted MA rate of change is above 1%.
After opening long or short, stop loss and trailing take profit orders are placed simultaneously. The stop loss is set at 3 ATR from the current price. The initial trailing take profit activation is 4 ATR away, and trails in 3% increments. When price hits either stop loss or trailing take profit activation, the position will be closed.
The strategy also incorporates money management rules based on the fixed fractional position sizing approach. Whenever PNL hits a fixed amount, the order size is increased or decreased by a fixed amount.
Advantage Analysis
- RSI indicator can effectively track trends
- Weighted MA reduces the impact of short-term fluctuations, avoiding whipsaws
- Trailing take profit allows profits to be maximized
- Fixed fraction position sizing controls risk effectively
The overall edge is the ability to follow trends, while taking stop loss and trailing take profit measures to control risks, thus capturing significant gains in strong trends.
Risk Analysis
- False signals from RSI may cause unnecessary trades
- Forced to stop out when price breaches stop or trailing take profit levels, unable to keep following trends
- Aggressive money management rules may lead to large losses
The main risks come from the reliability of RSI signals and the stop loss/trailing take profit settings. Incorrect parameters may result in unnecessary closing of trades or losses beyond risk appetite. Breaking stop loss/take profit may also force unwarranted stop outs, losing the chance to continue trend trading.
Solutions include optimizing RSI parameters or adding other indicators for signal confirmation. Adjust stop/trailing take profit levels based on different products and volatility conditions. Also be prudent with money management rules to avoid excessive risks.
Optimization Directions
- Test other indicators together with RSI for signal confirmation, e.g. KD, MACD etc
- Optimize stop loss and trailing take profit parameters based on product characteristics and volatility range
- Try other money management techniques like fixed size trading, Kelly formula etc
- Add entry conditions like Bollinger breakouts, RSI divergences etc
- Consider adding positions on strong trends
There are many aspects to optimize. First is identifying other indicators to supplement RSI signals. Next critical step is optimizing stop loss/trailing take profit parameters based on historical performance. Money management can also switch to other types. Finally, entry, add-on conditions can be enhanced to pyramiding positions in strong trends.
Summary
The RSI trend following strategy has clear logic, using RSI for trend direction and weighted MA for confirmation. Its strength lies in trend trading, maximizing profits with stops/money management controlling risks. But RSI reliability and parameter optimization need improvement. We can look into enhancing signal indicators, stop/trailing parameters, money management methods etc to make the strategy more robust across different products.
[/trans]
/*backtest
start: 2023-01-01 00:00:00
end: 2023-06-24 00:00:00
period: 1d
basePeriod: 1h
exchanges: [{"eid":"Futures_Binance","currency":"BTC_USDT"}]
*/

// This source code is subject to the terms of the Mozilla Public License 2.0 at https://mozilla.org/MPL/2.0/
// © gsanson66


//This code is based on RSI and a backed weighted MA
//@version=5
strategy("RSI + MA BACKTESTING", overlay=true, initial_capital=1000, default_qty_type=strategy.fixed, commission_type=strategy.commission.percent, commission_value=0.18)


//------------------------FUNCTIONS---------------------------//

//@function which calculate a retro weighted moving average to minimize the impact of short term reversal
rwma(source, length) =>
    sum = 0.0
    denominator = 0.0
    weight = 0.0
    weight_x = 100/(4+(length-4)*1.30)
    weight_y = 1.30*weight_x
    for i=0 to length - 1
        if i <= 3
            weight := weight_x
        else
            weight := weight_y
        sum := sum + source[i] * weight
        denominator := denominator + weight
    rwma = sum/denominator

//@function which permits the user to choose a moving average type
ma(source, length, type) =>
    switch type
        "SMA" => ta.sma(source, length)
        "RWMA" => rwma(source, length)

//@function Displays text passed to `txt` when called.
debugLabel(txt, color) =>
    label.new(bar_index, high, text = txt, color=color, style = label.style_label_lower_right, textcolor = color.black, size = size.small)

//@function which looks if the close date of the current bar falls inside the date range
inBacktestPeriod(start, end) => (time >= start) and (time <= end)


//--------------------------------USER INPUTS-------------------------------//

//Technical parameters
rsiLengthInput = input.int(20, minval=1, title="RSI Length", group="RSI Settings")
maTypeInput = input.string("RWMA", title="MA Type", options=["SMA", "RWMA"], group="MA Settings", inline="1")
maLenghtInput = input.int(20, minval=1, title="MA Length", group="MA Settings", inline="1")
rsiLongSignalValue = input.int(60, minval=1, maxval=99, title="RSI Long Signal", group="Strategy parameters", inline="3")
rsiShortSignalValue = input.int(40, minval=1, maxval=99, title="RSI Short Signal", group="Strategy parameters", inline="3")
rocMovAverLongSignalValue = input.float(-1, maxval=0, title="ROC MA Long Signal", group="Strategy parameters", inline="4")
rocMovAverShortSignalValue = input.float(1, minval=0, title="ROC MA Short Signal", group="Strategy parameters", inline="4")
//TP Activation and Trailing TP
takeProfitActivationInput = input.float(4, minval=1.0, title="TP activation in multiple of ATR", group="Strategy parameters")
trailingStopInput = input.float(3, minval=0, title="Trailing TP in percentage", group="Strategy parameters")
//Money Management
fixedRatio = input.int(defval=400, minval=1, title="Fixed Ratio Value ($)", group="Money Management")
increasingOrderAmount = input.int(defval=200, minval=1, title="Increasing Order Amount ($)", group="Money Management")
//Backtesting period
startDate = input(title="Start Date", defval=timestamp("1 Jan 2018 00:00:00"), group="Backtesting Period")
endDate = input(title="End Date", defval=timestamp("1 July 2024 00:00:00"), group="Backtesting Period")

strategy.initial_capital = 50000

//------------------------------VARIABLES INITIALISATION-----------------------------//

float rsi = ta.rsi(close, rsiLengthInput)
float ma = ma(close, maLenghtInput, maTypeInput)
float roc_ma = ((ma/ma[maLenghtInput]) - 1)*100
float atr = ta.atr(20)
var float trailingStopOffset = na
var float trailingStopActivation = na
var float trailingStop = na
var float stopLoss = na
var bool long = na
var bool short = na
var bool bufferTrailingStopDrawing = na
float theoreticalStopPrice = na
bool inRange = na
equity = strategy.equity - strategy.openprofit
var float capital_ref = strategy.initial_capital
var float cashOrder = strategy.initial_capital * 0.95


//------------------------------CHECKING SOME CONDITIONS ON EACH SCRIPT EXECUTION-------------------------------//

//Checking if the date belong to the range
inRange := true

//Checking performances of the strategy
if equity > capital_ref + fixedRatio
    spread = (equity - capital_ref)/fixedRatio
    nb_level = int(spread)
    increasingOrder = nb_level * increasingOrderAmount
    cashOrder := cashOrder + increasingOrder
    capital_ref := capital_ref + nb_level*fixedRatio
if equity < capital_ref - fixedRatio
    spread = (capital_ref - equity)/fixedRatio
    nb_level = int(spread)
    decreasingOrder = nb_level * increasingOrderAmount
    cashOrder := cashOrder - decreasingOrder
    capital_ref := capital_ref - nb_level*fixedRatio

//Checking if we close all trades in case where we exit the backtesting period
if strategy.position_size!=0 and not inRange
    debugLabel("END OF BACKTESTING PERIOD : we close the trade", color=color.rgb(116, 116, 116))
    strategy.close_all()
    bufferTrailingStopDrawing := false
    stopLoss := na
    trailingStopActivation := na
    trailingStop := na
    short := false
    long := false


//------------------------------STOP LOSS AND TRAILING STOP ACTIVATION----------------------------//

// We handle the stop loss and trailing stop activation
if (low <= stopLoss or high >= trailingStopActivation) and long
    if high >= trailingStopActivation
        bufferTrailingStopDrawing := true
    else if low <= stopLoss
        long := false
    stopLoss := na
    trailingStopActivation := na
if (low <= trailingStopActivation or high >= stopLoss) and short
    if low <= trailingStopActivation
        bufferTrailingStopDrawing := true
    else if high >= stopLoss
        short := false
    stopLoss := na
    trailingStopActivation := na


//-------------------------------------TRAILING STOP--------------------------------------//

// If the traling stop is activated, we manage its plotting with the bufferTrailingStopDrawing
if bufferTrailingStopDrawing and long
    theoreticalStopPrice := high - trailingStopOffset * syminfo.mintick
    if na(trailingStop)
        trailingStop := theoreticalStopPrice
    else if theoreticalStopPrice > trailingStop
        trailingStop := theoreticalStopPrice
    else if low <= trailingStop
        trailingStop := na
        bufferTrailingStopDrawing := false
        long := false
if bufferTrailingStopDrawing and short
    theoreticalStopPrice := low + trailingStopOffset * syminfo.mintick
    if na(trailingStop)
        trailingStop := theoreticalStopPrice
    else if theoreticalStopPrice < trailingStop
        trailingStop := theoreticalStopPrice
    else if high >= trailingStop
        trailingStop := na
        bufferTrailingStopDrawing := false
        short := false


//---------------------------------LONG CONDITION--------------------------//

if rsi >= 60 and roc_ma <= rocMovAverLongSignalValue and inRange and not long
    if short
        bufferTrailingStopDrawing := false
        stopLoss := na
        trailingStopActivation := na
        trailingStop := na
        short := false
    trailingStopActivation := close + takeProfitActivationInput*atr
    trailingStopOffset := (trailingStopActivation * trailingStopInput/100) / syminfo.mintick
    stopLoss := close - 3*atr
    long := true
    qty = cashOrder/close
    strategy.entry("Long", strategy.long, qty)
    strategy.exit("Exit Long", "Long", stop = stopLoss, trail_price = trailingStopActivation,
                 trail_offset = trailingStopOffset)


//--------------------------------SHORT CONDITION-------------------------------//

if rsi <= 40 and roc_ma >= rocMovAverShortSignalValue and inRange and not short
    if long
        bufferTrailingStopDrawing := false
        stopLoss := na
        trailingStopActivation := na
        trailingStop := na
        long := false
    trailingStopActivation := close - takeProfitActivationInput*atr
    trailingStopOffset := (trailingStopActivation * trailingStopInput/100) / syminfo.mintick
    stopLoss := close + 3*atr
    short := true
    qty = cashOrder/close
    strategy.entry("Short", strategy.short, qty)
    strategy.exit("Exit Short", "Short", stop = stopLoss, trail_price = trailingStopActivation,
                 trail_offset = trailingStopOffset)


//--------------------------------PLOTTING ELEMENT---------------------------------//

// Plotting of element in the graph
plotchar(rsi, "RSI", "", location.top, color.rgb(0, 214, 243))
plot(ma, "MA", color.rgb(219, 219, 18))
plotchar(roc_ma, "ROC MA", "", location.top, color=color.orange)
// Visualizer trailing stop and stop loss movement
plot(stopLoss, "SL", color.red, 3, plot.style_linebr)
plot(trailingStopActivation, "Trigger Trail", color.green, 3, plot.style_linebr)
plot(trailingStop, "Trailing Stop",  color.blue, 3, plot.style_linebr)