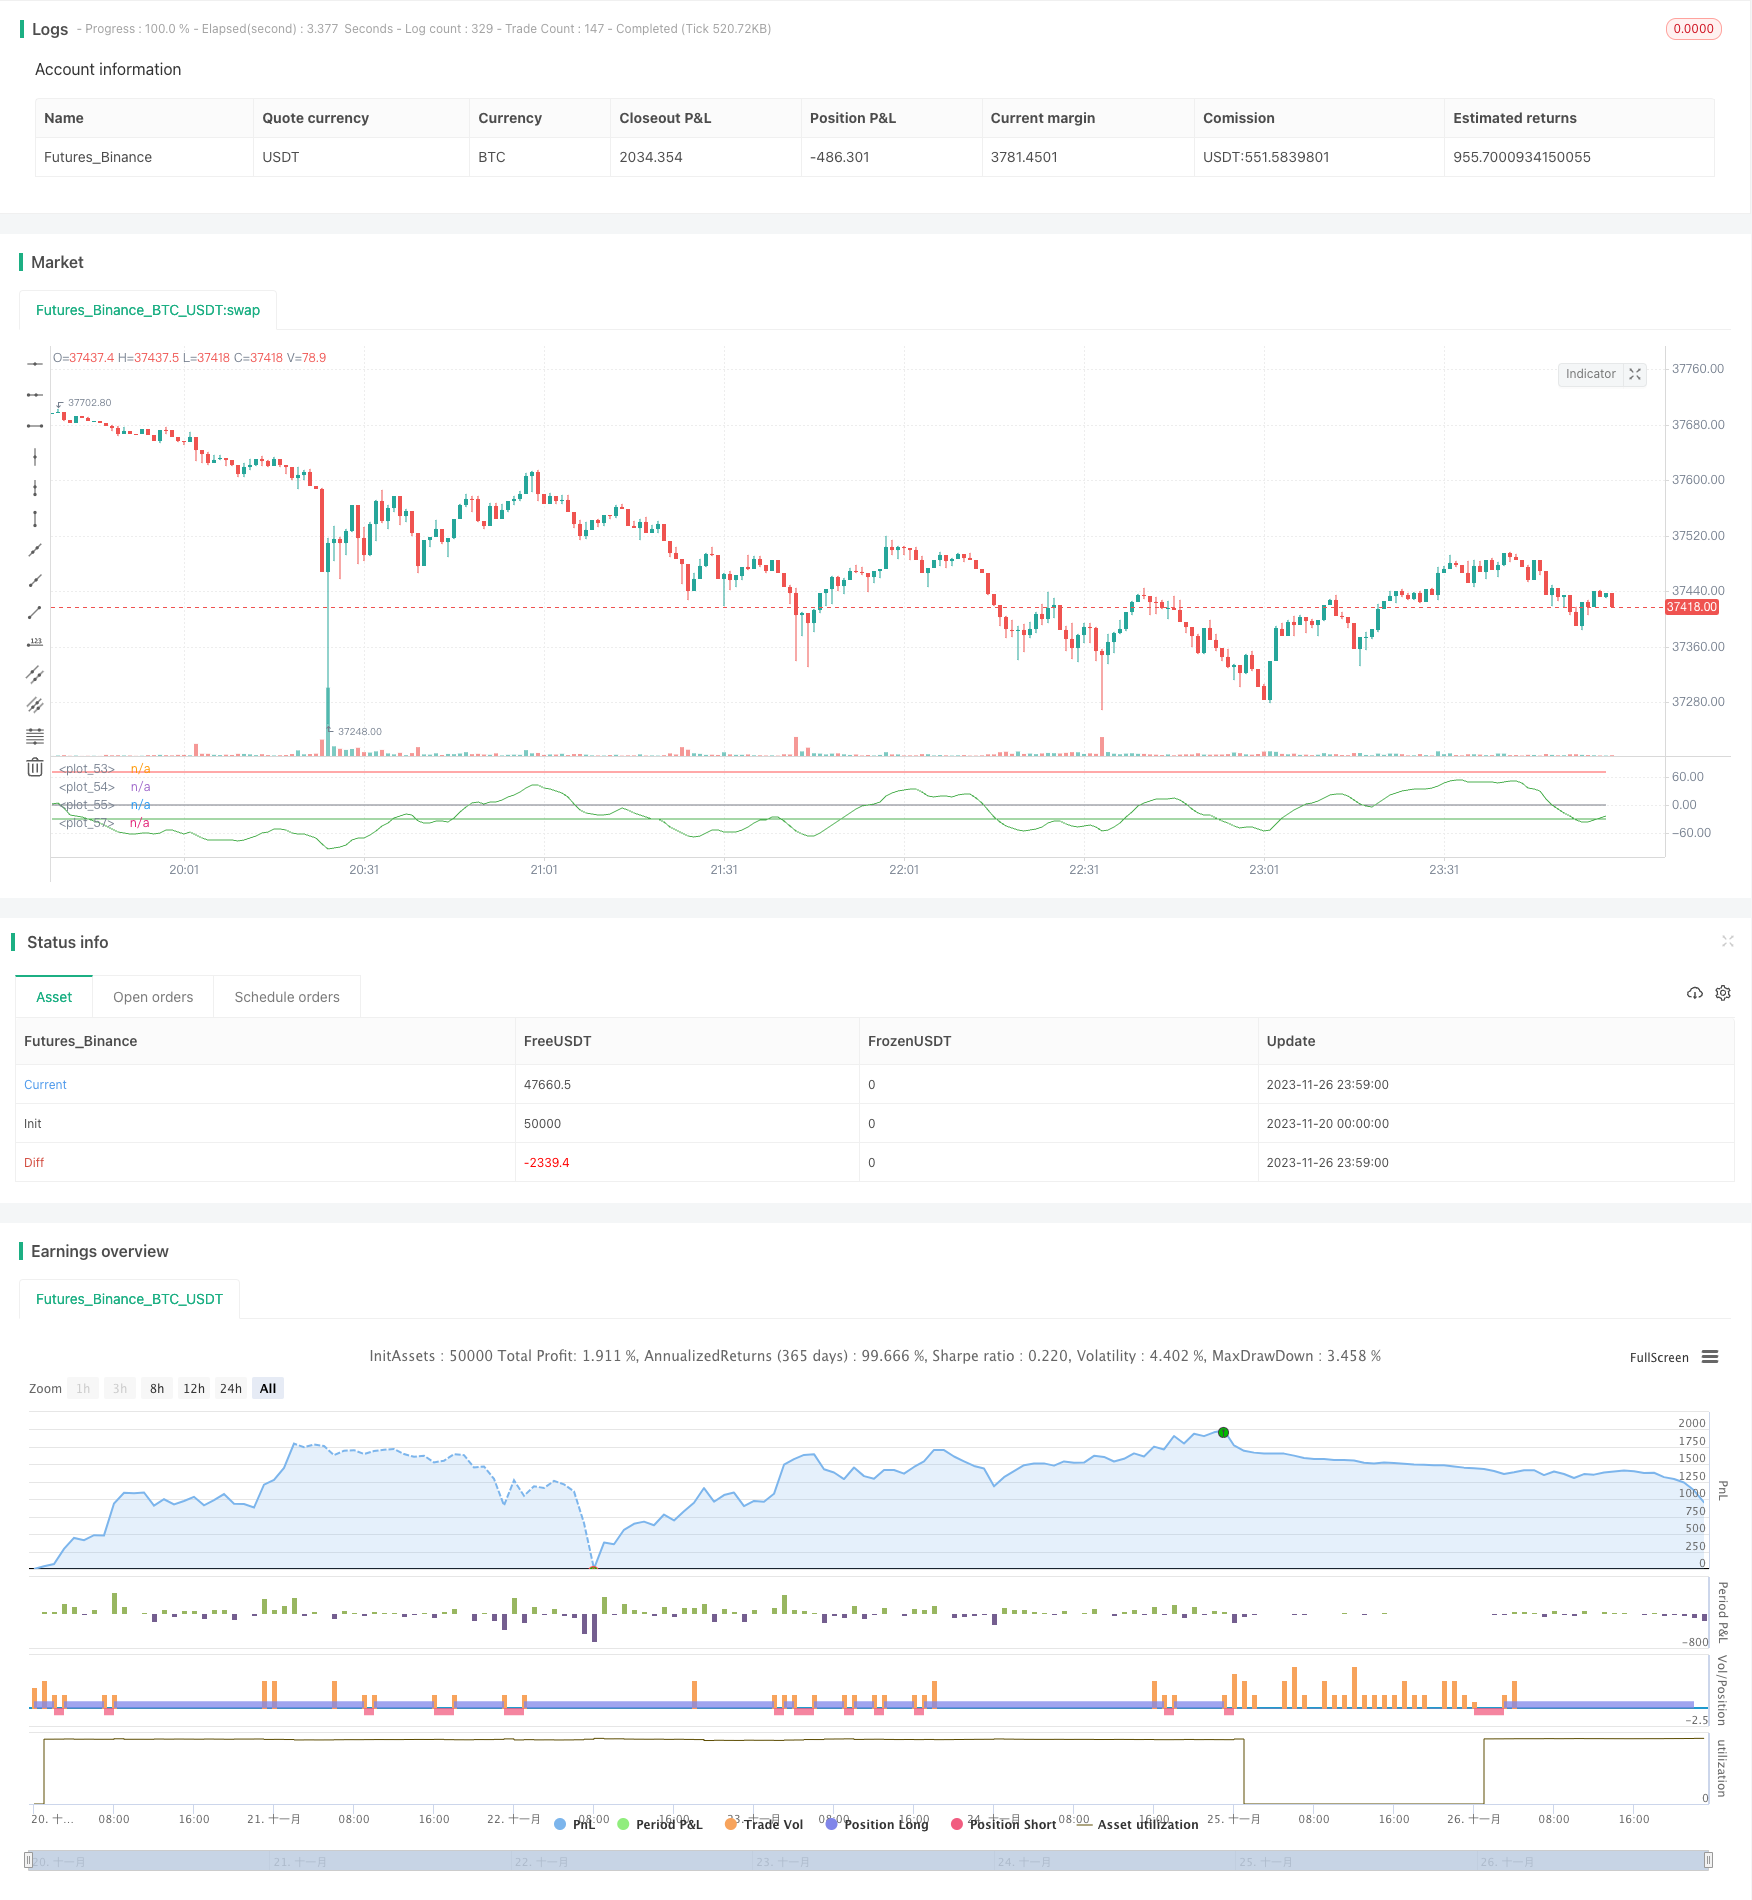
波動傾向に基づく定量的な取引戦略
作者: リン・ハーンチャオチャン, 日付: 2023-11-28 16:17:31タグ:

概要
この戦略は,波動トレンド指標に基づいて設計されています.波動トレンド指標は,価格チャネルと移動平均を組み合わせて,市場のトレンドを効果的に特定し,取引信号を生成します.この戦略は,波動トレンドラインが過買いまたは過売り状態を表すキーレベルを横切ったときに,ロングまたはショートポジションに入ります.
戦略の論理
- アップの指数的な移動平均 esa を計算します.
- アップとエサの絶対差の指数移動平均dを計算します
- 波動性指標 ci を導き出します.
- 波動傾向指標 wt1 を得るために ci の n2 期間の移動平均を計算します.
- 過剰購入と過剰販売の限界線を設定します
- 超売り線を超えるとロング,超買い線を超えるとショート.
利点分析
- 波動トレンドブレイクでは,過剰購入/過剰販売レベルは,効果的にトレンド逆転点を捕捉し,正確な取引信号を生成します.
- 価格チャネルと移動平均理論を組み合わせることで,この指標は頻繁な誤った信号を回避します.
- すべての時間枠と様々な取引手段に適用されます.
- パーソナライズ可能なパラメータは良いユーザー体験を提供します.
リスク と 解決策
- 大幅なウィプソーが悪い信号を誘発し,リスクが高い. 短い保持期間を使用したり,信号フィルタリングのための他の指標と組み合わせることもできます.
- ポジションサイズとストップ・ロスのメカニズムがない. 損失のリスク. 固定ポジションサイズルールと移動ストップを設定できます.
オプティマイゼーションの方向性
- KDJやMACDなどの他の指標と組み合わせて 戦略コンボを形成し 安定性を高めることを検討します
- トレーリングストップのように自動ストップロスを設計します 変動は取引損失を制限します
- 機械学習アルゴリズムを活用して 履歴データで パーマータを自動調整し 戦略のパフォーマンスを向上させる
結論
この戦略は,波動トレンド指標を使用して,トレンドとオーバー買い/オーバーセールレベルを特定し,戦略をフォローする効果的なトレンドを形成する.短期オシレーターと比較して,波動トレンドは誤った信号を避け,より良い安定性を提供します.適切なリスク管理方法により,安定した利益を達成することができます.パラメータとモデルチューニングからさらなるパフォーマンスブームが期待できます.
/*backtest
start: 2023-11-20 00:00:00
end: 2023-11-27 00:00:00
period: 1m
basePeriod: 1m
exchanges: [{"eid":"Futures_Binance","currency":"BTC_USDT"}]
*/


//@author SoftKill21
//@version=4

strategy(title="WaveTrend strat", shorttitle="WaveTrend strategy")
n1 = input(10, "Channel Length")
n2 = input(21, "Average Length")
Overbought = input(70, "Over Bought")
Oversold = input(-30, "Over Sold ")

// BACKTESTING RANGE

// From Date Inputs
fromDay = input(defval = 1, title = "From Day", minval = 1, maxval = 31)
fromMonth = input(defval = 1, title = "From Month", minval = 1, maxval = 12)
fromYear = input(defval = 2001, title = "From Year", minval = 1970)

// To Date Inputs
toDay = input(defval = 1, title = "To Day", minval = 1, maxval = 31)
toMonth = input(defval = 12, title = "To Month", minval = 1, maxval = 12)
toYear = input(defval = 2020, title = "To Year", minval = 1970)

// Calculate start/end date and time condition
DST = 1 //day light saving for usa
//--- Europe
London = iff(DST==0,"0000-0900","0100-1000")
//--- America
NewYork = iff(DST==0,"0400-1500","0500-1600")
//--- Pacific
Sydney = iff(DST==0,"1300-2200","1400-2300")
//--- Asia
Tokyo = iff(DST==0,"1500-2400","1600-0100")

//-- Time In Range
timeinrange(res, sess) => time(res, sess) != 0

london = timeinrange(timeframe.period, London)
newyork = timeinrange(timeframe.period, NewYork)

startDate = timestamp(fromYear, fromMonth, fromDay, 00, 00)
finishDate = timestamp(toYear, toMonth, toDay, 00, 00)
time_cond = true //and (london or newyork)

ap = hlc3
esa = ema(ap, n1)
d = ema(abs(ap - esa), n1)
ci = (ap - esa) / (0.015 * d)
tci = ema(ci, n2)

wt1 = tci
wt2 = sma(wt1,4)

plot(0, color=color.gray)
plot(Overbought, color=color.red)
plot(Oversold, color=color.green)

plot(wt1, color=color.green)
longButton = input(title="Long", type=input.bool, defval=true)
shortButton = input(title="Short", type=input.bool, defval=true)

if(longButton==true)
    strategy.entry("long",1,when=crossover(wt1,Oversold) and time_cond)
    strategy.close("long",when=crossunder(wt1, Overbought))

if(shortButton==true)
    strategy.entry("short",0,when=crossunder(wt1, Overbought) and time_cond)
    strategy.close("short",when=crossover(wt1,Oversold))

//strategy.close_all(when= not (london or newyork),comment="time")
if(dayofweek == dayofweek.friday)
    strategy.close_all(when= timeinrange(timeframe.period, "1300-1400"), comment="friday")
もっと
- 2つのエントリーポジションを平均するストップ損失戦略
- RSI移動平均クロスオーバートレンド戦略
- 歴史的データに基づく動的サポートと抵抗戦略
- ノロのボリンジャー・トラッキング戦略
- EMAの逆買い売り戦略
- ハラミ 閉店価格戦略
- CMOとWMAをベースにしたモメンタム・トレード戦略
- P-Signal マルチタイムフレーム取引戦略
- コモディティ・モメントムインデックス戦略
- ダブル・タートル・ブレークスルー戦略
- イチモク・クモ・トウィスト ゴールド吸収戦略
- 部分的な利益を取る戦略でステップアップトラッキングストップ
- Hull TSI と CCI の移動平均傾向追跡戦略
- リバースエンジニアリング RSI 戦略
- 二重のCCI量的な戦略
- 双 EMA クロスオーバー ブレイクアウト 戦略
- マルチタイムフレームMACD戦略
- RSIとATR経路に基づく超スカルピング戦略
- ドンチアン・トレンド戦略
- マルチSMA移動平均のクロスオーバー戦略