トラッキングライン戦略

概要
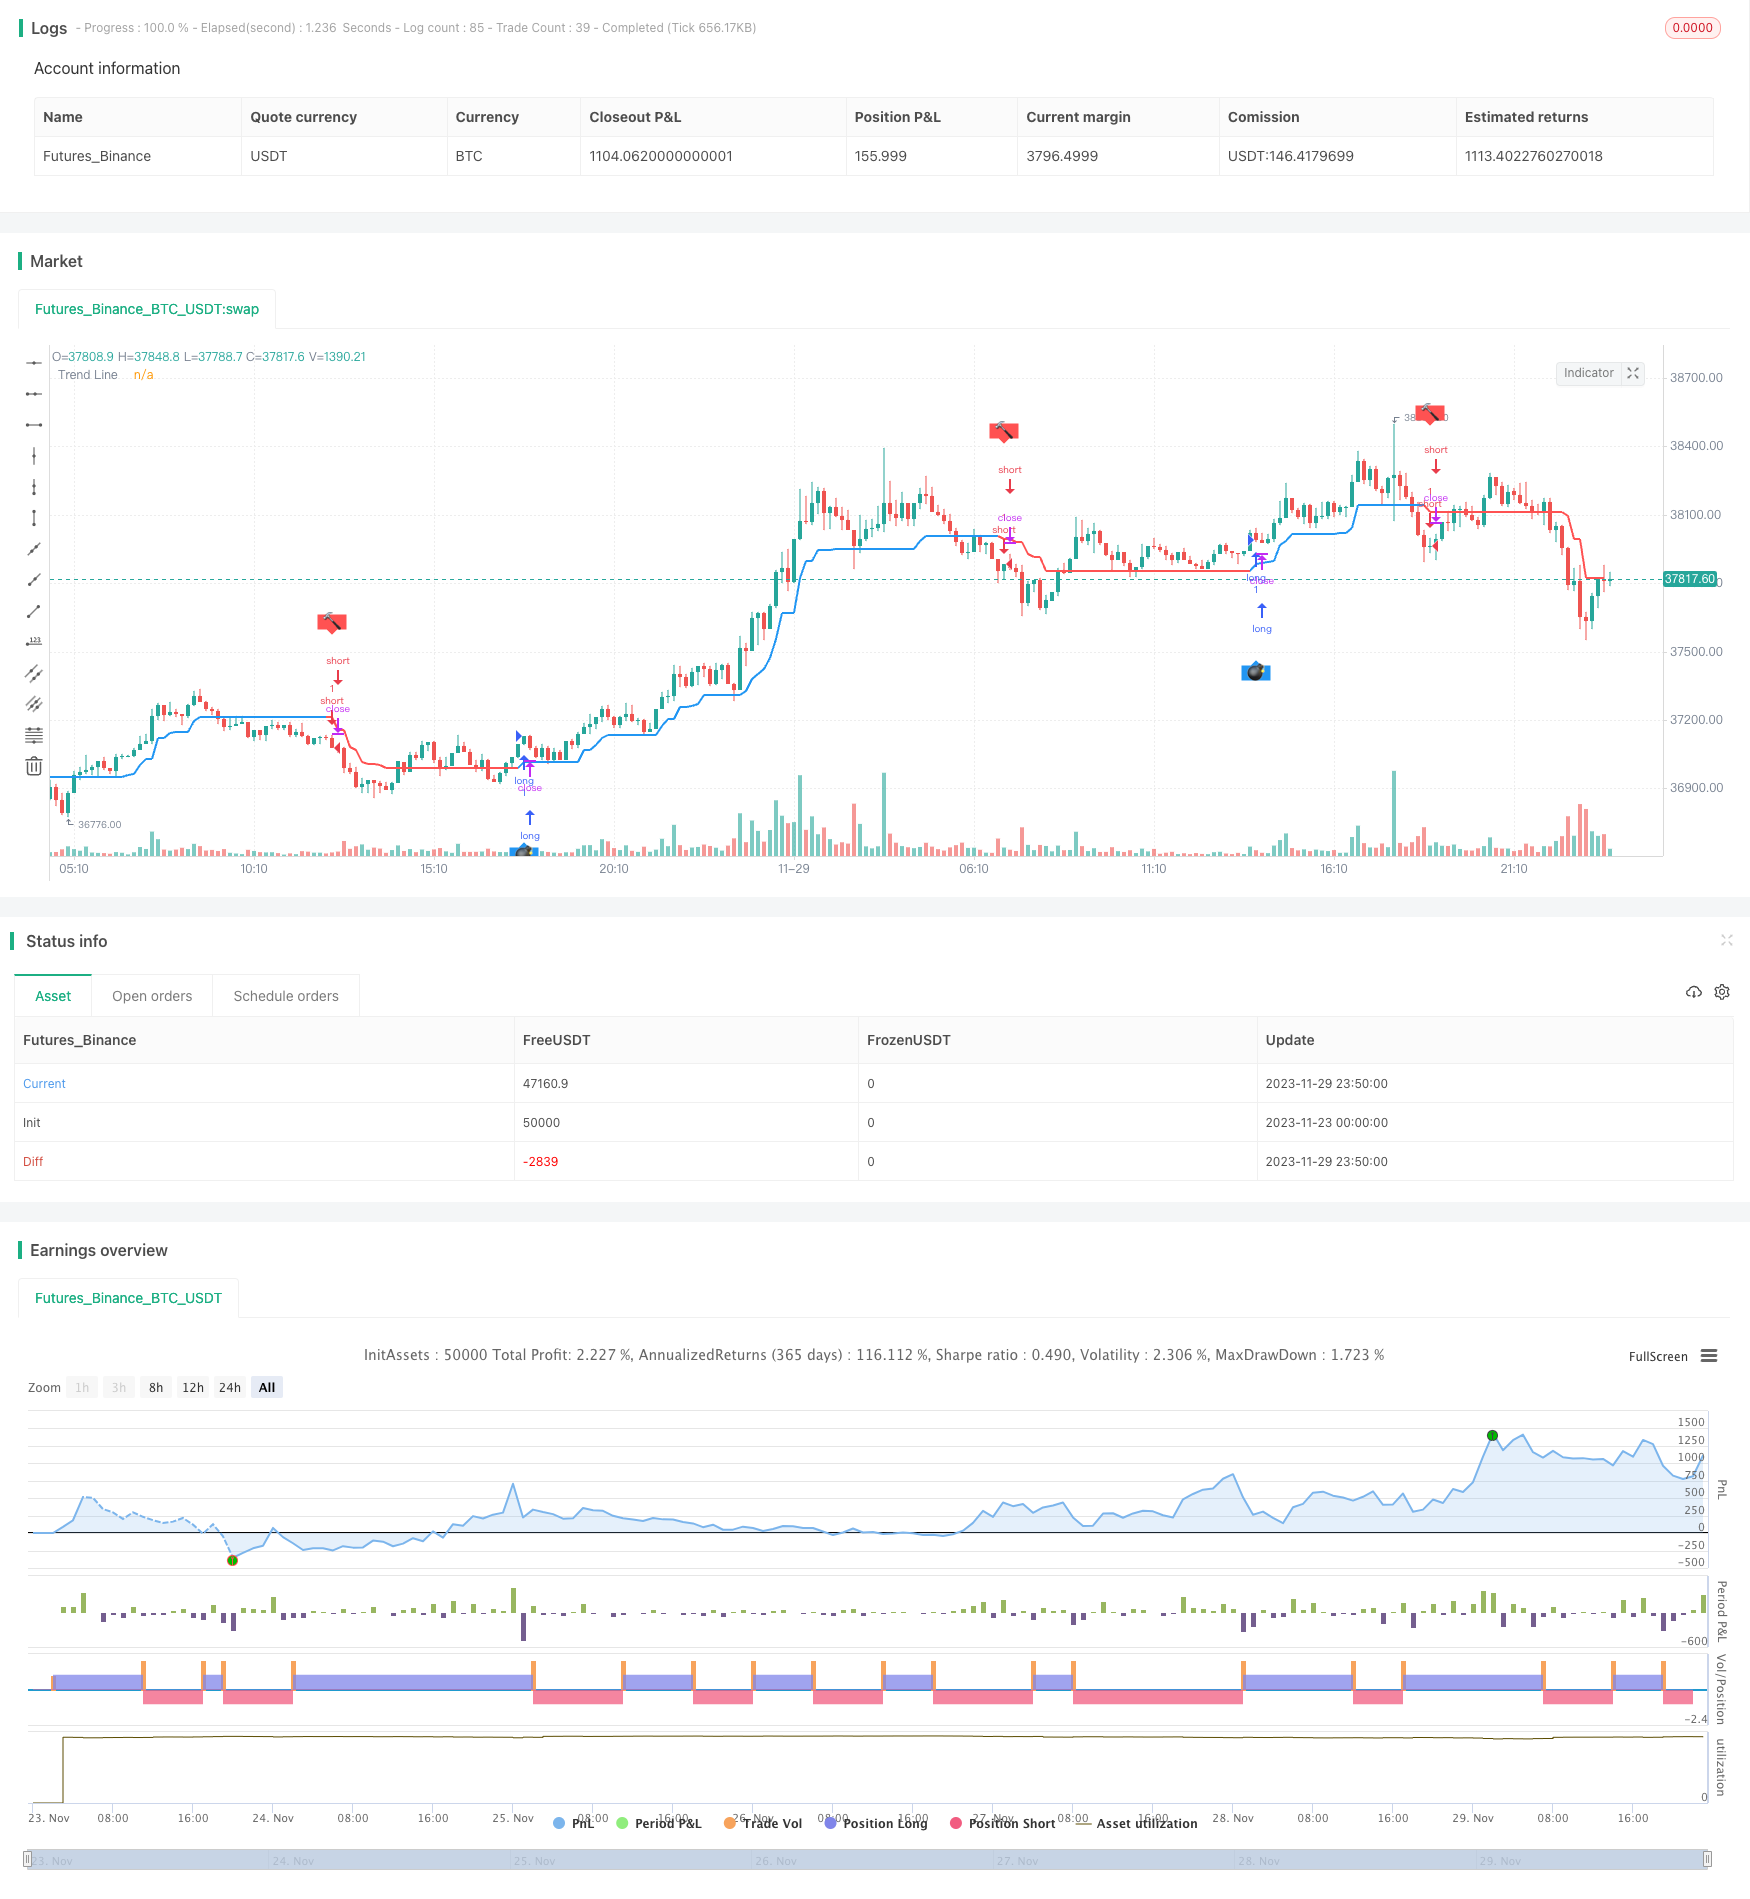
トラッキングライン戦略は,ブリン帯の指標と平均実際の波動範囲 ((ATR)) をベースにしたトレンド追跡戦略である.これは,動的にトレンド判断ラインを調整し,ブリン帯を突破すると上向きに調整し,ブリン帯を突破すると下向きに調整し,結果的にトレンドの判断と追跡を実現する.
戦略原則
この戦略は,ブリン帯の上下軌道と平均的な実際の波動範囲を計算し,次に,価格がブリン帯の上下軌道に突破するかどうかを判断する.
価格が軌道上を突破する時,ATRフィルタをオンにすると,トレンド判断線を最低価格に設定しATRを減算する.ATRフィルタをオンにしない場合は,直接最低価格に設定する.
価格が下落すると,ATRフィルタをオンにすると,トレンド判断線を最高価格とATRに設定します.ATRフィルタをオンにしない場合は,直接最高価格に設定します.
このように,トレンド判断線は,価格がブリンを突破して下落する方向に動的に調整され,トレンドの判断が可能になります.
現在のトレンド判断線が前のトレンド判断線より高いときは,現在上昇傾向にあることを示し,現在のトレンド判断線が前のトレンド判断線より低いときは,現在下落傾向にあることを示している.
この戦略は,トレンドを判断して,多空操作を行うことができます.
優位分析
- 動的にトレンド判断線を調整し,価格トレンドを柔軟に捉える
- ブリン帯の指標と組み合わせると,価格突破時にトレンド転換を判断できます.
- ATRパラメータの導入により,部分的な偽突破信号をフィルタリングできる
リスク分析
- ブリン帯のパラメータの不適切な選択は,頻繁に偽突破を引き起こす可能性があります.
- ATRパラメータが大きすぎると,トレンド転換のチャンスを逃す可能性があります.
- 極端な状況からの損失を防ぐために,損失停止を考える必要がある
パラメータの調整,ストップを導入することで一部のリスクを回避することができる。また,他の指標と組み合わせてフィルタリングを行い,突破の有効性を高めることができる。
最適化の方向
- ブリン帯とATRのパラメータを最適化して,最適の配置を探す
- 偽の突破をフィルターするために他の指標を追加します.
- 特定の取引品種を対象としたブリン帯周期とATR周期の選択
要約する
トラッキングライン戦略は,波動的な状況下での価格トレンドを捕捉することに専念し,効果的なトレンド追跡戦略です.パラメータの調整と最適化により,良い収益を得ることができます.しかし,リスク制御の停止と偽突破の防止も考慮する必要があります.この戦略を他の指標または戦略の組み合わせで使用することは,収益率をさらに向上させることができます.
/*backtest
start: 2023-11-23 00:00:00
end: 2023-11-30 00:00:00
period: 10m
basePeriod: 1m
exchanges: [{"eid":"Futures_Binance","currency":"BTC_USDT"}]
*/

// © Dreadblitz
//@version=4
//
// ▒▒▒▒▒▒▒▒▒▒▒▒▒▒▒▒▒▒▒▒▒▒▒▒▒▒▒▒▒▒▒▒▒▒▒▒▒▒▒▒▒▒▒▒▒▒▒▒▒▒▒▒▒▒▒▒▒▒▒▒▒▒▒▒▒▒▒▒▒▒▒▒▒▒▒▒▒▒▒▒▒▒▒▒▒▒▒▒▒▒▒▒▒▒▒▒▒▒▒▒▒▒▒▒▒▒▒▒▒▒▒▒▒▒ //

strategy(title = " Strategy Follow Line Indicator ",
         shorttitle = "S-FLI",
         overlay = true,
         precision = 8,
         calc_on_order_fills = true,
         calc_on_every_tick = true,
         backtest_fill_limits_assumption = 0,
         default_qty_type = strategy.fixed,
         default_qty_value = 2,
         initial_capital = 10000,
         pyramiding=1,
         currency = currency.USD,
         linktoseries = true)

//
// ▒▒▒▒▒▒▒▒▒▒▒▒▒▒▒▒▒▒▒▒▒▒▒▒▒▒▒▒▒▒▒▒▒▒▒▒▒▒▒▒▒▒▒▒▒▒▒▒▒▒▒▒▒▒▒▒▒▒▒▒▒▒▒▒▒▒▒▒▒▒▒▒▒▒▒▒▒▒▒▒▒▒▒▒▒▒▒▒▒▒▒▒▒▒▒▒▒▒▒▒▒▒▒▒▒▒▒▒▒▒▒▒▒▒ //

backTestSectionFrom = input(title = "═══════════════ From ═══════════════", defval = true, type = input.bool)

FromMonth         = input(defval = 1, title = "Month", minval = 1)
FromDay           = input(defval = 1, title = "Day", minval = 1)
FromYear          = input(defval = 2014, title = "Year", minval = 2000)

backTestSectionTo = input(title = "════════════════ To ════════════════", defval = true, type = input.bool)
ToMonth           = input(defval = 31, title = "Month", minval = 1)
ToDay             = input(defval = 12, title = "Day", minval = 1)
ToYear            = input(defval = 9999, title = "Year", minval = 2000)

Config            = input(title = "══════════════ Config ══════════════", defval = true, type = input.bool)
BBperiod          = input(defval = 21,     title = "BB Period",    type = input.integer, minval = 1)
BBdeviations      = input(defval = 1.00,     title = "BB Deviations",    type = input.float, minval = 0.1, step=0.05)
UseATRfilter      = input(defval = true, title = "ATR Filter",  type = input.bool)
ATRperiod         = input(defval = 5,     title = "ATR Period",    type = input.integer, minval = 1)
hl                = input(defval = false, title = "Hide Labels",  type = input.bool)


backTestPeriod() => true

//
//
// ▒▒▒▒▒▒▒▒▒▒▒▒▒▒▒▒▒▒▒▒▒▒▒▒▒▒▒▒▒▒▒▒▒▒▒▒▒▒▒▒▒▒▒▒▒▒▒▒▒▒▒▒▒▒▒▒▒▒▒▒▒▒▒▒▒▒▒▒▒▒▒▒▒▒▒▒▒▒▒▒▒▒▒▒▒▒▒▒▒▒▒▒▒▒▒▒▒▒▒▒▒▒▒▒▒▒▒▒▒▒▒▒▒▒ //

BBUpper=sma (close,BBperiod)+stdev(close, BBperiod)*BBdeviations
BBLower=sma (close,BBperiod)-stdev(close, BBperiod)*BBdeviations
//
TrendLine = 0.0
iTrend = 0.0
buy = 0.0
sell = 0.0
//
BBSignal = close>BBUpper? 1 : close<BBLower? -1 : 0
//
if BBSignal == 1 and UseATRfilter == 1
    TrendLine:=low-atr(ATRperiod)
    if TrendLine<TrendLine[1]
        TrendLine:=TrendLine[1]
if BBSignal == -1 and UseATRfilter == 1
    TrendLine:=high+atr(ATRperiod)
    if TrendLine>TrendLine[1]
        TrendLine:=TrendLine[1]
if BBSignal == 0 and UseATRfilter == 1
    TrendLine:=TrendLine[1]
//
if BBSignal == 1 and UseATRfilter == 0
    TrendLine:=low
    if TrendLine<TrendLine[1]
        TrendLine:=TrendLine[1]
if BBSignal == -1 and UseATRfilter == 0
    TrendLine:=high
    if TrendLine>TrendLine[1]
        TrendLine:=TrendLine[1]
if BBSignal == 0 and UseATRfilter == 0
    TrendLine:=TrendLine[1]
//
iTrend:=iTrend[1]
if TrendLine>TrendLine[1]
    iTrend:=1
if TrendLine<TrendLine[1]
    iTrend:=-1
//
buy:=iTrend[1]==-1 and iTrend==1 ? 1 : na
sell:=iTrend[1]==1 and iTrend==-1? 1 : na
//
plot(TrendLine, color=iTrend > 0?color.blue:color.red ,style=plot.style_line,linewidth=2,transp=0,title="Trend Line")
plotshape(buy == 1 and hl == false? TrendLine-atr(8) :na, text='💣', style= shape.labelup, location=location.absolute, color=color.blue, textcolor=color.white, offset=0, transp=0,size=size.auto)
plotshape(sell == 1 and hl == false ?TrendLine+atr(8):na, text='🔨', style=shape.labeldown, location=location.absolute, color=color.red, textcolor=color.white, offset=0, transp=0,size=size.auto)

// Strategy Entry
if (backTestPeriod())
    strategy.entry("long", true, 1, when = buy == 1)
    strategy.entry("short", false, 1, when = sell == 1)