ダイナミック・MA・クロスオーバー・トレンド
作者: リン・ハーンチャオチャン開催日:2023年12月19日 11:49:30タグ:

概要
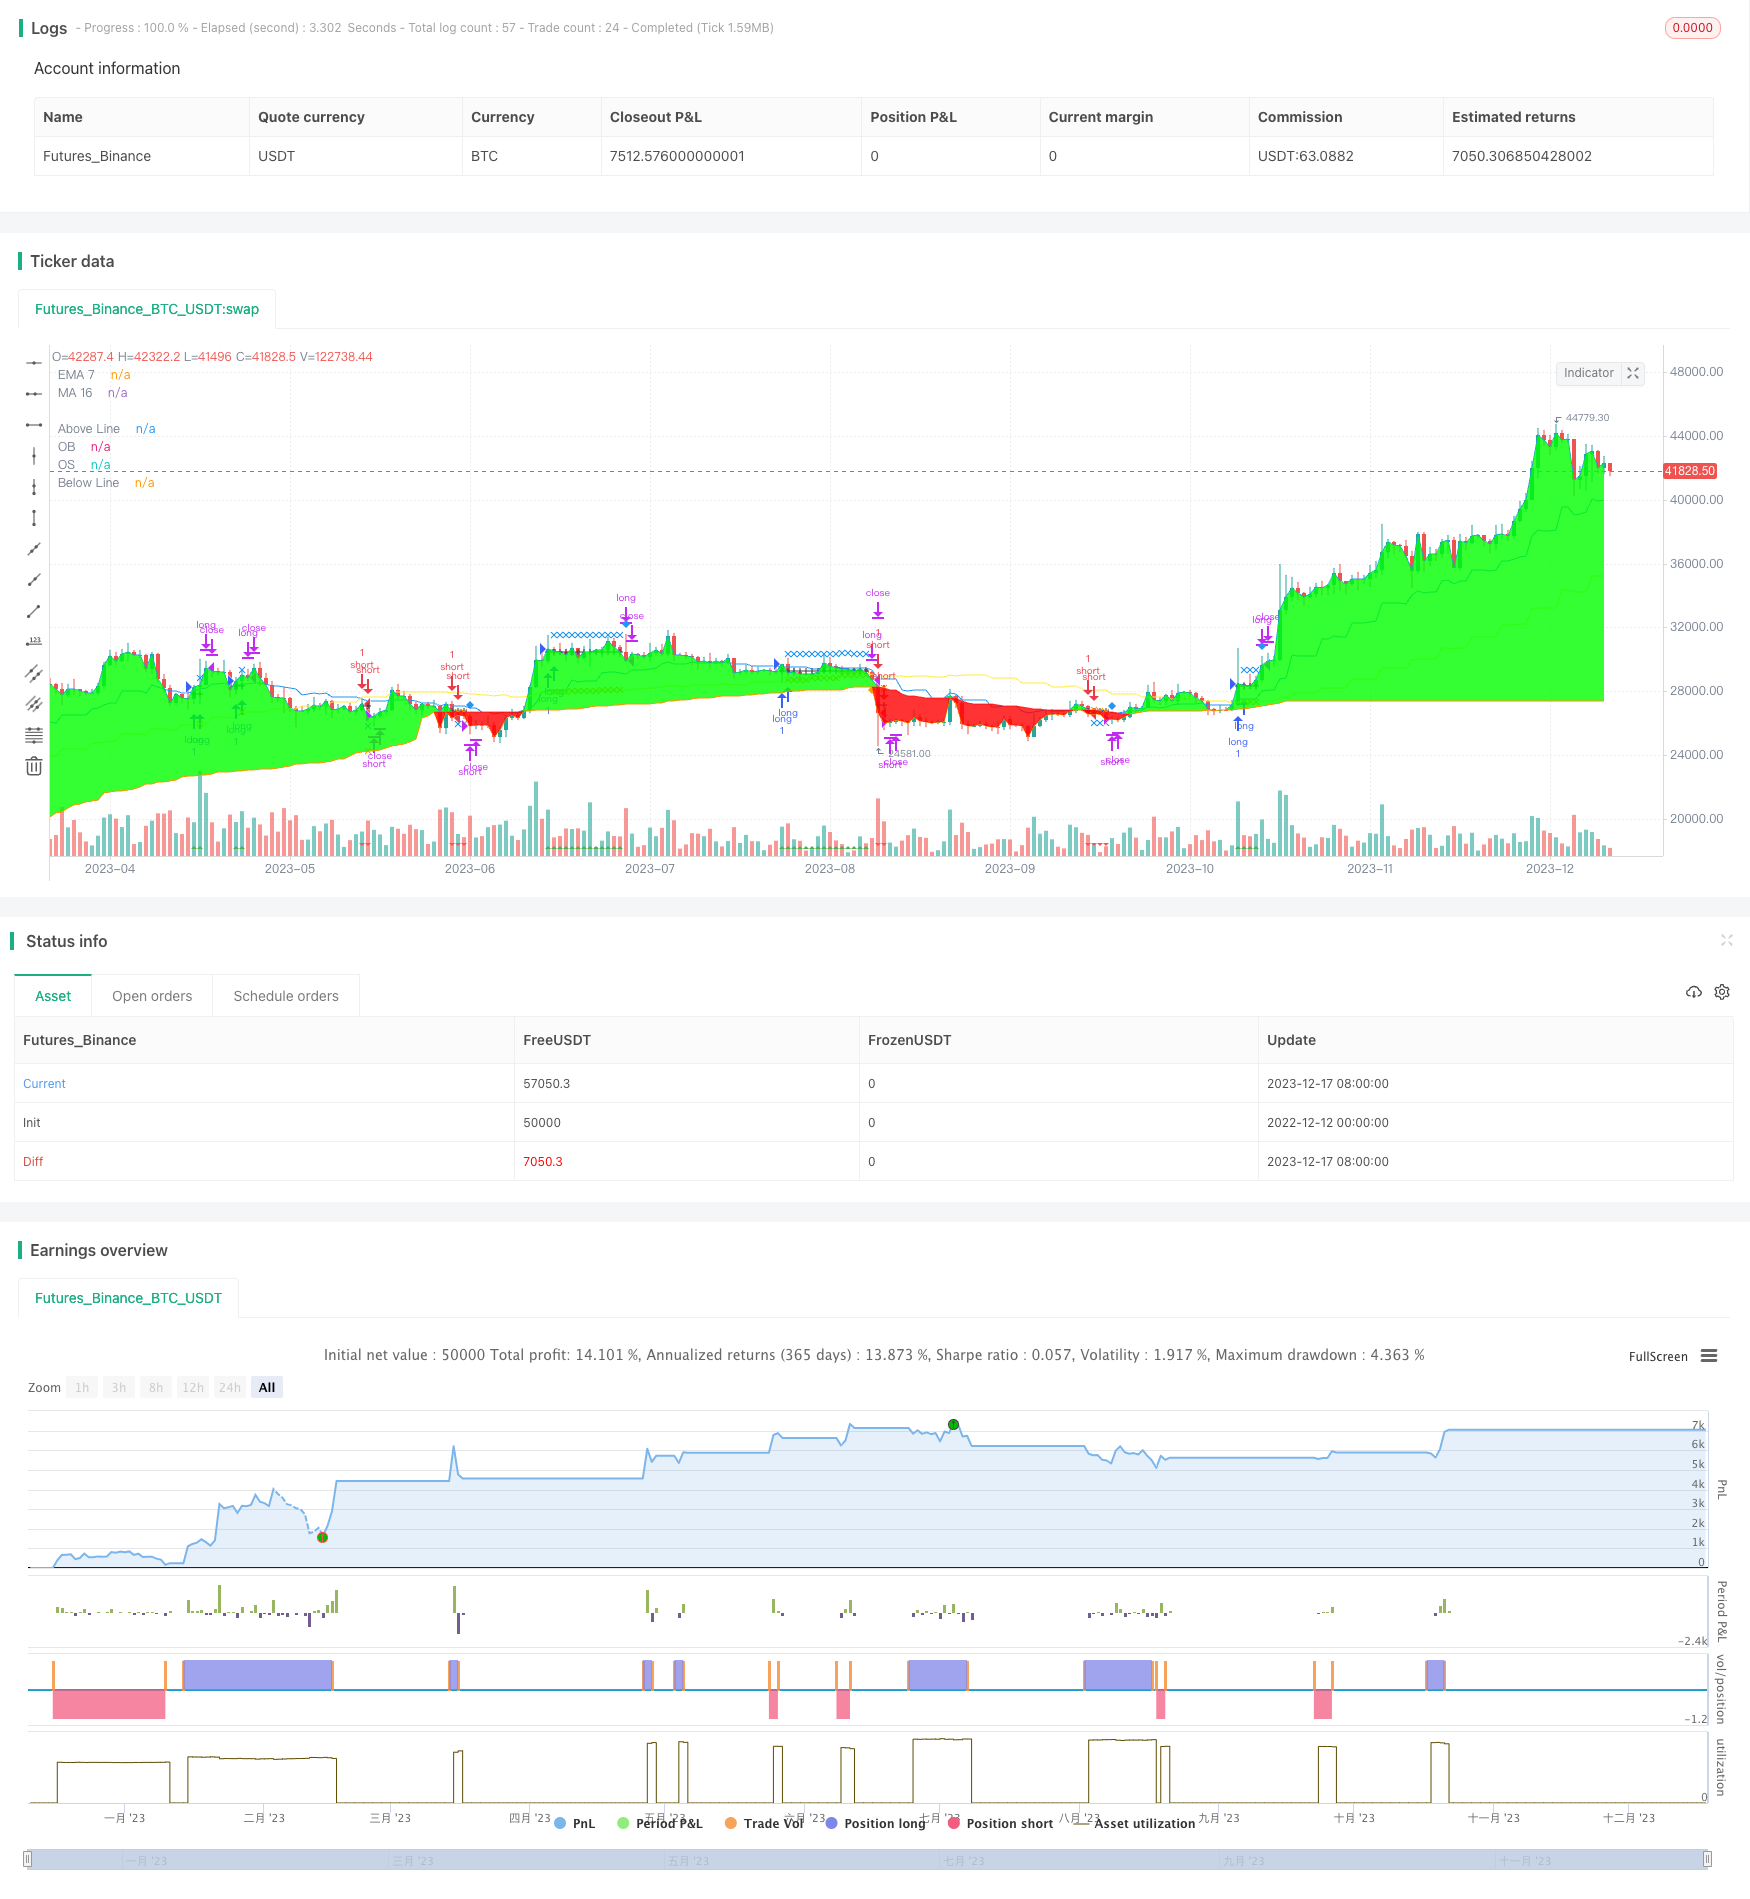
この戦略は,ダイナミックレジスタンスの/サポート帯とMA線のクロスオーバーをエントリー信号として利用し,ストップの後にトレンドを採用し,利益を固定します.
戦略の論理
-
動的レジスタンスとサポートレベルを百分位統計を用いて計算し,潜在的な逆転ゾーンを特定する.
-
価格が逆転ゾーンに突入すると,高速MAが遅いMAを超えて/下を通過して取引信号を生成するかどうかを確認します.
-
入力後,トレーリングストップメカニズムを起動し 動的に利益をロックして 傾向を追います
-
価格が既定のストップ・ロストや 収益のレベルに達すると ポジションを閉じる
利点
-
ダイナミックバンドは 潜在的逆転領域を特定し 入力精度を向上させるのに役立ちます
-
MAクロスオーバーと百分位チャンネルを組み合わせることで 誤った信号を避ける.
-
トレイリングストップは 利益を効果的に固定し 過剰な引き上げを防ぐ
-
パーソナライズ可能なパラメータは,異なる市場環境に適しています.
リスク
-
トレンドではない市場では 誤った信号が発生する可能性があります
-
パラメーターの調整が不適切で 攻撃的なエントリです
-
バックテストデータは十分な市場サイクルをカバーすべきである.
-
ギャップを防ぐために,ライブ取引でより広いストップを考慮してください.
強化
-
異なる MA 期間の組み合わせを試験する.
-
ダイナミックバンドのパラメータを調整することで逆転識別を最適化する.
-
異なるトライリングストップパラメータによる株式曲線への影響を評価する.
-
信頼性を高めるためにフィルターを追加してみてください.
結論
この戦略の全体的な論理は明確である.シグナルをフィルターするために動的帯を使用し,MAクロスオーバーによってトレンド方向を判断し,トレーリングストップメカニズムでリスクを効果的に制御する.パラメータチューニングによるさらなる最適化は,生産のための戦略パフォーマンスを継続的に改善することができます.
/*backtest
start: 2022-12-12 00:00:00
end: 2023-12-18 00:00:00
period: 1d
basePeriod: 1h
exchanges: [{"eid":"Futures_Binance","currency":"BTC_USDT"}]
*/

// This source code is subject to the terms of the Mozilla Public License 2.0 at https://mozilla.org/MPL/2.0/
// © allanster

//@version=4

strategy("MA-EMA Crossover LT", shorttitle="MA-EMA XO", overlay=true)


//==================== STRATEGY CODE ======================

tradeType = input("BOTH", title="Trade Type ", options=["LONG", "SHORT", "BOTH"])

// === BACKTEST RANGE ===
FromMonth = 01//input(defval=01, title="From Month", minval=1)
FromDay = 01//input(defval=01, title="From Day", minval=1)
FromYear = input(defval=2017, title="From Year", minval=2000)
ToMonth = 12//input(defval=12, title="To Month", minval=1)
ToDay = 31//input(defval=31, title="To Day", minval=1)
ToYear = input(defval=9999, title="To Year", minval=2000)

testPeriod() =>
    time > timestamp(FromYear, FromMonth, FromDay, 00, 00) and
       time < timestamp(ToYear, ToMonth, ToDay, 23, 59)

stopLossPercent = input(1.00, "Stop Loss Percent")
profitPercent_long = input(3.50, "Profit Percent LONG")
profitPercent_short = input(3.0, "Profit Percent SHORT")

atr_multi_PT = input(1.50, "ATR Multiple for PT")
atr_multi_SL = input(1.50, "ATR Multiple for SL")
//////////////////////////////

isLongOpen = false
isShortOpen = false

//Order open on previous ticker?
isLongOpen := nz(isLongOpen[1])
isShortOpen := nz(isShortOpen[1])

/////////////////////
//Trailing and Profit variables
trigger = 0.0
trigger := na

profitTrigger = 0.0
profitTrigger := na

//obtain values from last ticker
entryPrice = 0.0
entryPrice := nz(entryPrice[1])

stopLossLevel = 0.0
stopLossLevel := nz(stopLossLevel[1])

profitPriceLevel = 0.0
profitPriceLevel := nz(profitPriceLevel[1])


//If in active trade, lets load with current value
if isLongOpen
    profitTrigger := profitPriceLevel ? high : na
    trigger := stopLossLevel ? ohlc4 : na
    trigger
if isShortOpen
    profitTrigger := profitPriceLevel ? low : na
    trigger := stopLossLevel ? ohlc4 : na
    trigger

isStopLoss = isLongOpen ? trigger < stopLossLevel :
   isShortOpen ? trigger > stopLossLevel : na
isProfitCatch = isLongOpen ? profitTrigger > profitPriceLevel :
   isShortOpen ? profitTrigger < profitPriceLevel : na

//===================      Optional Entry Condition    ============
src    = close
len = input(defval = 128, title = "DZ Length", type = input.integer, minval = 1)
// use_dz = input(false, title="Use Dynamic Zone")
pcntAbove = input(defval = 40, title = "Hi is Above X% of Sample", type = input.float, minval = 0, maxval = 100, step = 1.0)
pcntBelow = input(defval = 60, title = "Lo is Below X% of Sample", type = input.float, minval = 0, maxval = 100, step = 1.0)

smplAbove = percentile_nearest_rank(src, len, pcntAbove)
smplBelow = percentile_nearest_rank(src, len, 100 - pcntBelow)

above     = plot(src > smplAbove ? src : smplAbove, title = "Above Line", color = na)
probOB    = plot(smplAbove, title = "OB", color = color.green)
probOS    = plot(smplBelow, title = "OS", color = color.red)
below     = plot(src < smplBelow ? src : smplBelow, title = "Below Line", color = na)
fill(above,  probOB, color = #00FF00, transp = 80)
fill(below,  probOS, color = #FF0000, transp = 80)

// long_dz = close > smplAbove
// short_dz = close < smplBelow


//==============           Entry Conditions        =====================
timeframe = input("5D", title="MA16 Resolution", type=input.resolution)
_ma = sma(hlc3, 16)
ma=security(syminfo.tickerid, timeframe, _ma, barmerge.gaps_off, barmerge.lookahead_on)

_ema=ema(hlc3,7)
ema=security(syminfo.tickerid, timeframe, _ema, barmerge.gaps_off, barmerge.lookahead_on)


long = ma[1] > ema[1] ? crossover(ema, ma) : abs(ma - ema)/ma > 0.025 ? crossover(close, ema) : false
short = ma[1] < ema[1] ? crossunder(ema,ma) : abs(ma - ema)/ma > 0.025 ? crossunder(close, ema): false //:crossunder(close, ema)

longEntry = (tradeType == "LONG" or tradeType == "BOTH") and long
shortEntry = (tradeType == "SHORT" or tradeType == "BOTH") and short

//Upon Entry, do this.
if longEntry or shortEntry
    entryPrice := ohlc4
    entryPrice

//set price points for new orders
use_dz_sl = input(true, title="Use DZ SL")
if isLongOpen
    stopLossLevel := use_dz_sl? max(smplAbove, ma) : ema - 0.25*atr_multi_PT* atr(32) //ma
    profitTrail = ma + atr_multi_PT* atr(32)
    profitPriceLevel :=  max( (1 + 0.01 * profitPercent_long) * entryPrice, profitTrail)
    profitPriceLevel
if isShortOpen
    stopLossLevel :=  use_dz_sl? min(smplBelow, ma) : ema + 0.25*atr_multi_PT* atr(32) //ma
    profitTrail = ma - atr_multi_PT* atr(32)
    profitPriceLevel := min( (1 - 0.01 * profitPercent_short) * entryPrice, profitTrail)
    profitPriceLevel

shortExit = isShortOpen[1] and (isStopLoss or isProfitCatch or longEntry)
longExit = isLongOpen[1] and (isStopLoss or isProfitCatch or shortEntry)


if (longExit or shortExit) and not(longEntry or shortEntry)
    trigger := na
    profitTrigger := na
    entryPrice := na
    stopLossLevel := na
    profitPriceLevel := na
    // highest := na
    // lowest := na
    // lowest

if testPeriod() and (tradeType == "LONG" or tradeType == "BOTH")
    strategy.entry("long", strategy.long, when=longEntry)
    strategy.close("long", when=longExit)

if testPeriod() and (tradeType == "SHORT" or tradeType == "BOTH")
    strategy.entry("short", strategy.short, when=shortEntry)
    strategy.close("short", when=shortExit)


//If the value changed to invoke a buy, lets set it before we leave
isLongOpen := longEntry ? true : longExit == true ? false : isLongOpen
isShortOpen := shortEntry ? true : shortExit == true ? false : isShortOpen


plotshape(isShortOpen, title="Short Open", color=color.red, style=shape.triangledown, location=location.bottom)
plotshape(isLongOpen, title="Long Open", color=color.green, style=shape.triangleup, location=location.bottom)

plotshape(entryPrice ? entryPrice : na, title="Entry Level", color=color.black, style=shape.cross, location=location.absolute)
plotshape(stopLossLevel ? stopLossLevel : na, title="Stop Loss Level", color=color.orange, style=shape.xcross, location=location.absolute)
plotshape(profitPriceLevel ? profitPriceLevel : na, title="Profit Level", color=color.blue, style=shape.xcross, location=location.absolute)
plotshape(profitTrigger[1] ? isProfitCatch : na, title="Profit Exit Triggered", style=shape.diamond, location=location.abovebar, color=color.blue, size=size.small)
plotshape(trigger[1] ? isStopLoss : na, title="Stop Loss Triggered", style=shape.diamond, location=location.belowbar, color=color.orange, size=size.small)

plot(ma, title="MA 16", color=color.yellow)
plot(ema, title="EMA 7", color=color.blue)
- 方向性動き指数 双方向取引戦略
- ボリンジャー・バンド・ブレークアウト・トレード戦略
- ラグエール RSI トレーディング戦略
- ダイナミック・リエントリー 購入のみの戦略
- 岩のように固体VIP量子戦略
- ゴールデンクロス最適化移動平均クロスオーバー取引戦略
- 移動平均を横切る戦略
- LazyBear をベースにした波動トレンド・トレーディング・戦略
- 8日間の延長走行戦略
- 移動平均回帰戦略
- ストキャスティック移動平均値戦略
- 動向平均戦略によるボリンガー帯を横断するモメンタム振動
- RSI ボリンジャー・バンド 短期取引戦略
- 超トレンド追跡ストップ損失戦略
- 日中戦略をフォローするMACDトレンド
- 二重因数平均逆転追跡戦略
- トレンドトラッキング戦略 適応型トレーリングストロスの多因子モデルに基づく
- 複数の指標を組み合わせた適応傾向戦略
- キャンドルスタイク・パターンの取引戦略
- SMA オフセット変動取引戦略