フラクタル・ブレークアウト戦略
作者: リン・ハーンチャオチャン開催日:2023年12月19日15時32分57秒タグ:

概要
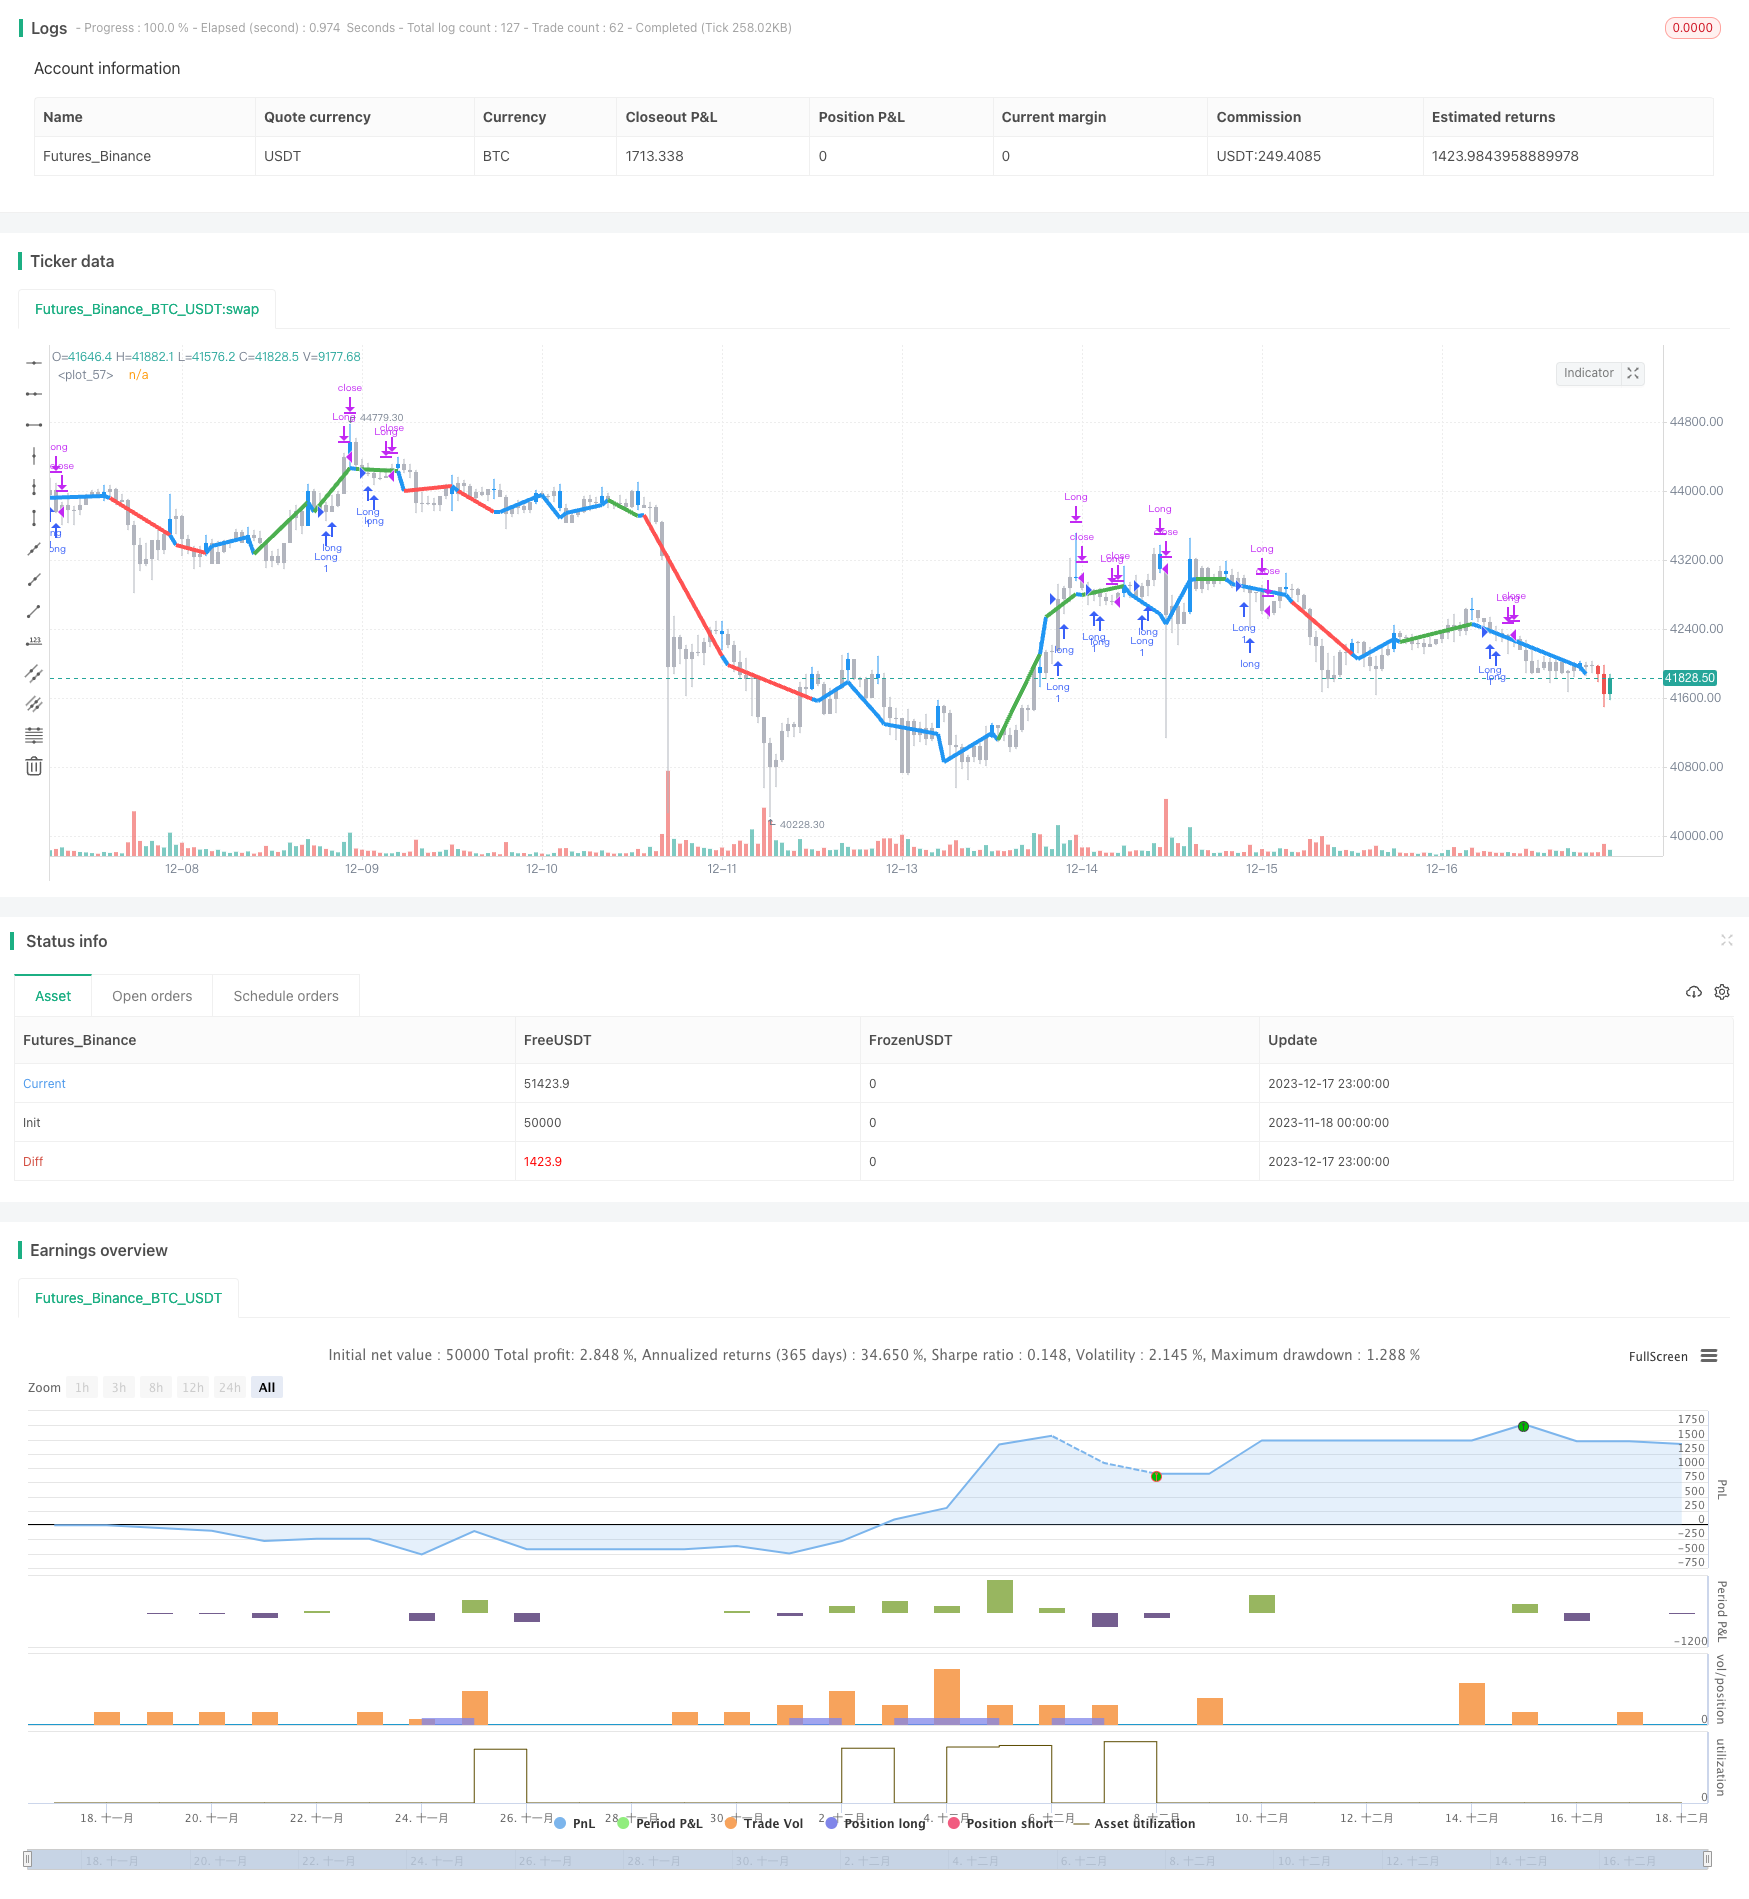
このトレンドをフォローするロングライントラッキング戦略は,価格フラクタルに基づいてトレンドを判断するものです. 最新のフラクタルポイントの突破に基づいてポジションを開くことを決定します. 同時に,最後のNのフラクタルポイントの平均価格を計算してトレンド方向を判断し,トレンドが変化するとポジションを閉じます.
原則
-
価格のフラクタルポイントを計算します.フラクタルポイントは,前2日と次の2日の最高価格よりも高い今日の最高価格として定義されます.
-
最後のフラクタルポイントの価格を抵抗として記録します
-
閉じる価格が最後のフラクタルポイントを突破すると,レジスタンスが突破され,ロングポジションが確立されたと考えられる.
-
平均価格が上昇すると上昇傾向であり,落ちると下落傾向になります.
-
ローングポジション中に平均フラクタルポイント価格が下がると,ポジションを閉じる.
利点分析
このフラクタルベースのトレンド判断戦略の最大の利点は,市場の騒音を効果的にフィルタリングし,長期的なトレンド方向性を決定することが可能である.単純な移動平均線や他の指標と比較して,突然の異常変動に強い抵抗力がある.
さらに,この戦略のポジションの開設と閉じる基準は非常に明確で,頻繁な取引を避ける.また,長期保有に特に適しています.
リスク分析
この戦略の最大のリスクは,フラクタルポイントそのものの確率的性質にあります.フラクタルは価格が確実に逆転するかどうかを完全に予測することはできません.つまり,誤った判断の可能性は依然として存在します.誤った判断が発生すると,損失のリスクに直面します.
さらに,フラクタルポイントを判断する時間帯は長く,高周波取引に適応できない.短期的な取引を追求する場合は,この戦略は適切ではない可能性があります.
オプティマイゼーションの方向性
フラクタル点の誤判の可能性を考えると,次の方法で最適化することができます:
-
ボリンジャー帯,移動平均等などの他の指標と組み合わせることで,フラクタル点のみをベースとした判断を避ける.
-
フラクタルポイントのパラメータを調整し,判定前後の期間数など,フラクタルポイントの判定を最適化します.
-
ストップ・ロスの戦略を追加して,損失が一定程度拡大するときに損失を停止します.
概要
フラクタルブレイクアウト戦略は,長期的傾向を全体的に判断するのに非常に適しており,長期投資者によって使用するのに非常に適しています. 判断の正確性を保証する前提で,パラメータを適切に調整し,他のフィルタリング指標を追加する限り,私たちはこの戦略を大幅に最適化し,定量決定の重要な部分にすることができます.
/*backtest
start: 2023-11-18 00:00:00
end: 2023-12-18 00:00:00
period: 1h
basePeriod: 15m
exchanges: [{"eid":"Futures_Binance","currency":"BTC_USDT"}]
*/

//@version=2
strategy("Fractal Breakout Strategy (by ChartArt)", shorttitle="CA_-_Fractal_Breakout_Strat", overlay=true)

// ChartArt's Fractal Breakout Strategy
//
// Version 1.0
// Idea by ChartArt on April 24, 2016.
//
// This long only strategy determines the last fractal top
// and enters a trade when the price breaks above the last
// fractal top. The strategy also calculates the average
// price of the last 2 (or 3) fractal tops to get the trend.
//
// The strategy exits the long trade when the average of the
// fractal tops is falling (when the trend is lower highs).
// And the user can manually set a delay of this exit.
//
// In addition the fractals tops can be colored in blue
// and a line can be drawn based on the fractal tops.
// This fractal top line is colored by the fractal trend.
//
// List of my work:
// https://www.tradingview.com/u/ChartArt/
//
//  __             __  ___       __  ___
// /  ` |__|  /\  |__)  |   /\  |__)  |
// \__, |  | /~~\ |  \  |  /~~\ |  \  |
//
//


// input

n_time = input(title='Always exit each trade after this amount of bars later (Most important strategy setting)', defval=3)
price = input(hl2,title='Price type to determine the last fractal top and the fractal breakout, the default is (high+low)/2')


// fractal calculation

fractal_top = high[2] > high[3] and high[2] > high[4] and high[2] > high[1] and high[2] > high[0]
fractal_price = valuewhen(fractal_top, price, 1)
use_longer_average = input(true,title='Use Fractal price average of the last 3 fractals instead of the last 2 fractals?')
fractal_average = use_longer_average?(fractal_price[1] + fractal_price[2] + fractal_price[3] ) / 3 : (fractal_price[1] + fractal_price[2]) / 2
fractal_trend = fractal_average[0] > fractal_average[1]
no_repainting = input(true,title='Use the price of the last bar to prevent repainting?')
fractal_breakout = no_repainting?price[1] > fractal_price[0]:price[0] > fractal_price[0]


// highlight fractal tops

show_highlight = input(true,title='Highlight fractal tops in blue and color all other bars in gray?')
highlight = fractal_top?blue:silver
barcolor(show_highlight?highlight:na,offset=-2)
show_fractal_top_line = input(true,title='Draw a colored line based on the fractal tops?')
fractal_top_line = change(fractal_top) != 0 ? price : na
fractal_top_line_color = change(fractal_price) > 0 and fractal_breakout == true ? green : change(fractal_price) < 0 and fractal_breakout == false ? red : blue
plot(show_fractal_top_line?fractal_top_line:na,offset=-2,color=fractal_top_line_color,linewidth=4)


// strategy

trade_entry = fractal_trend and fractal_breakout
trade_exit = fractal_trend[n_time] and fractal_trend == false

if (trade_entry)
    strategy.entry('Long', strategy.long)

if (trade_exit)
    strategy.close('Long')
- ユニバーサル・スナイパー戦略
- 二重指標ハイブリッド量的な取引戦略
- ボリンジャー・バンドス・モメンタム・ブレイクアウト戦略
- ボリンジャー・バンド 移動平均に基づく短期逆転量的な戦略
- グラデントMACD量子戦略
- 双方向の迅速量的な逆転取引戦略
- ハイキン・アシとカウフマン 適応型移動平均取引戦略
- モメントブレイク・トレード戦略
- イチモク移動平均クロスオーバー戦略
- 動力と取引量戦略
- ビル・ウィリアムズ 素晴らしいオシレーター取引戦略
- 波動性 有限量要素戦略
- このBISTは4段階の定量化買収戦略を
- Kifierの隠されたMFI/STOCHダイバージェンス/トレンドブレイカー取引戦略
- MACD量的な取引戦略
- 動向平均の二重トレンド追跡戦略
- 動向を追跡する手段の逆転戦略
- 方向性動き指数 双方向取引戦略
- ボリンジャー・バンド・ブレークアウト・トレード戦略
- ラグエール RSI トレーディング戦略