モメントブレイク・トレード戦略
作者: リン・ハーンチャオチャン,日付: 2023-12-19 15:46:38タグ:

概要
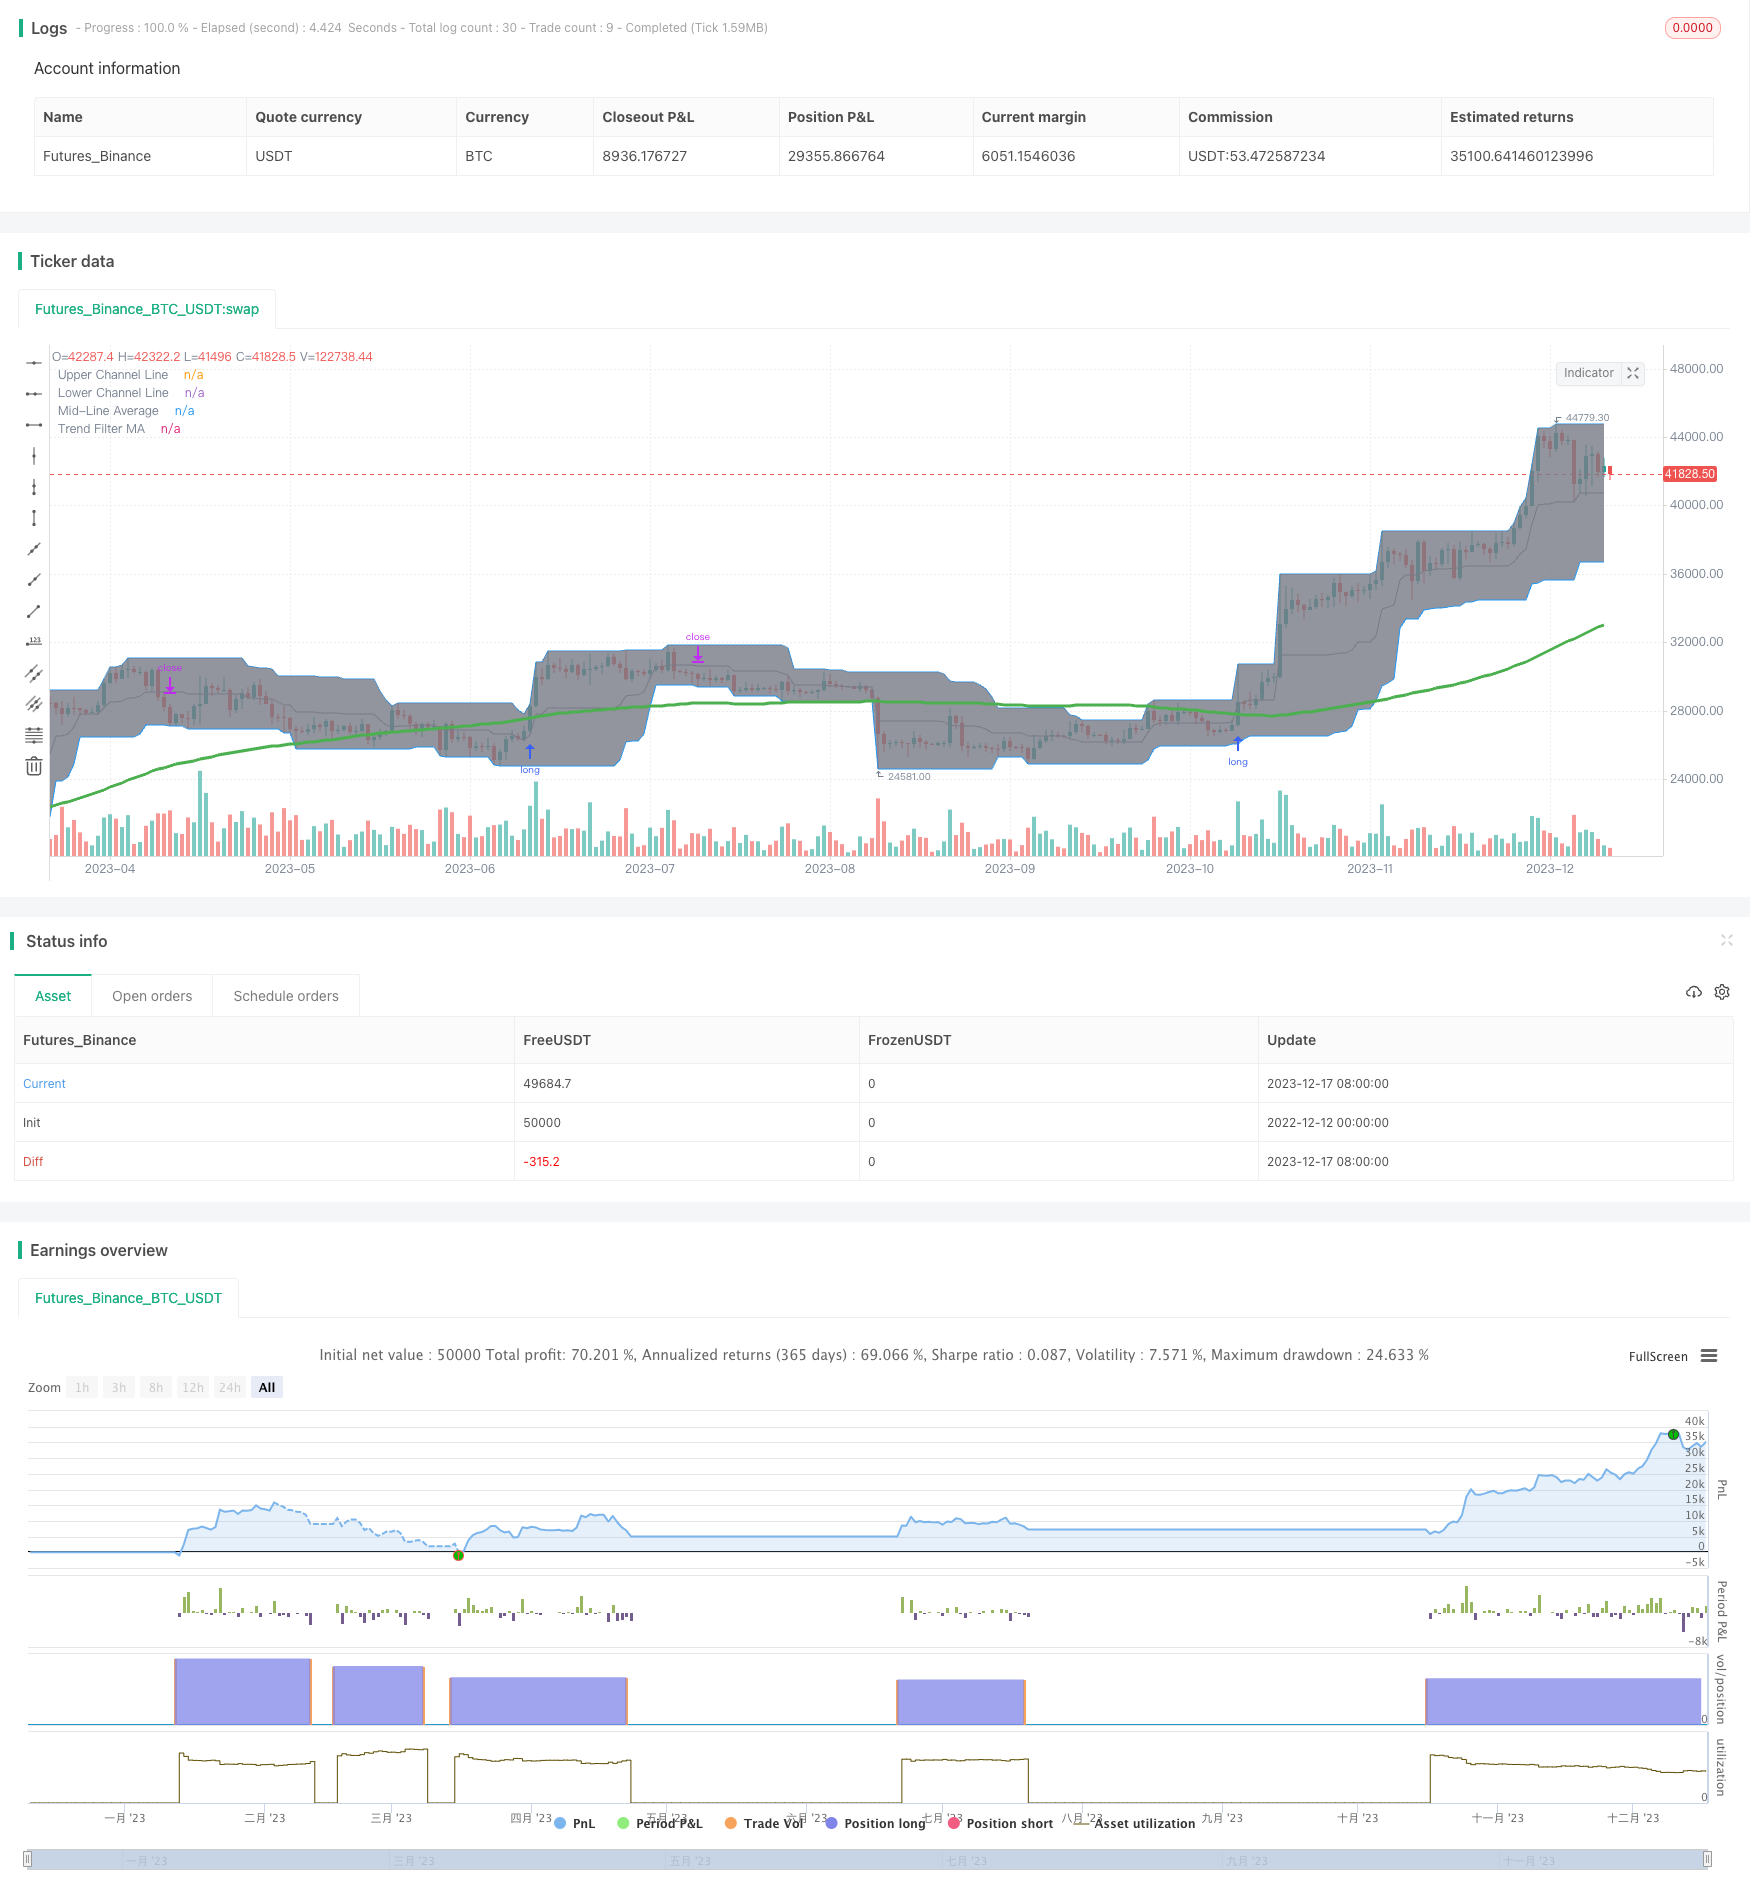
モメントブレイアウト・トレーディング戦略は,主要なサポート/レジスタンスレベルを超えた価格ブレイクを検出することによってトレード信号を生成するトレンドフォローする戦略である.この戦略は,ドンチアン・チャネル指標を使用して,主要なサポート/レジスタンスレベルを動的に特定し,誤った取引を避けるために移動平均値でシグナルをさらにフィルタリングする.
戦略の論理
この戦略のコア指標はドンキアン・チャネルである.ドンキアン・チャネルは,設定された期間中の最高価格,最低価格,ミッドライン価格で構成される.チャネルの上部と下部帯は,バックバック期間に最も高い価格と最低価格を相応に接続する.価格が上部帯を超えると長い信号が生成され,下部帯を下部に突破するとショート信号が生成され,市場の勢力の変化を反映する.
移動平均は,トレンド方向を測定するために使用されます. 統合を避けるため,移動平均以上の価格の購入信号のみが取りられます.
具体的には,エントリー条件は,価格がドンキアンチャネル上部帯を超えて突破し,移動平均値を超えて閉じる.出口条件は,価格がドンキアンチャネル下部帯を下回る.
ストップ・ロスはドンキアン・チャネル下部帯をたどり ストップがトレンドとともに上昇することを保証します
利点分析
この戦略は,トレンドの方向性と勢いを判断するための2つの指標を効果的に組み合わせ,誤ったブレイクアウト信号から誤った取引を避ける.一方,トレーリングストップは,トレンドの後に利益を最大化する戦略を可能にします.
具体的には以下のような利点があります
-
ドンチアン・チャネルは動的に主要なサポート/レジスタンスレベルを決定し,トレンドターニングポイントを特定します.
-
移動平均は統合をフィルタリングし,不必要なフラッシュを避けます
-
ドンチアン運河の下部帯を追いかけることで 利益は最大化できます
-
合理的なパラメータは,様々な市場環境で柔軟性を提供します.
リスク分析
主なリスクは:
-
失敗したブレイクリスク - 価格がブレイク後の勢いを上位帯以上維持できない.
-
トレンド逆転リスク - トレーリングストップ損失に達する前に価格が逆転する.
-
パラメータ最適化リスク - 非効率なパラメータは過剰取引または不十分な信号につながる.
減量するために 音量確認,移動平均調整,合理的な停止距離などの要因を考慮する必要があります
増進 の 機会
さらに最適化:
-
ボリュームフィルターを追加して 高いモメントブレイクを保証します
-
移動平均周期を計測器の特性に最適化する.
-
価格変動の動態に基づいた適応型ストップロスのメカニズム
-
初期ストップアウト後に再入るメカニズムで,追加のトレンド再開動きを捕捉します.
-
製品ニュアンスによってパラメータを特定するための多市場試験を強要する.
結論
モメントブレイアウト・トレーディング戦略は,トレンドとモメント強さを効果的に測定するための指標を組み合わせ,盲目エントリーに関するトレンドシステムで直面する一般的な問題を回避する.合理的に最適化されたパラメータ,適応メカニズム,およびさまざまな環境および製品における堅牢なテストにより,これは汎用的で実践的なブレイアウトシステムです.
/*backtest
start: 2022-12-12 00:00:00
end: 2023-12-18 00:00:00
period: 1d
basePeriod: 1h
exchanges: [{"eid":"Futures_Binance","currency":"BTC_USDT"}]
*/

//@version=4

// Revision:        1
// Author:          @millerrh
// Strategy:
//      Entry: Buy when Donchian Channel breaks out
//      Exit: Trail a stop with the lower Donchian Channel band
// Conditions/Variables:
//    1. Can add a filter to only take setups that are above a user-defined moving average (helps avoid trading counter trend)
//    2. Manually configure which dates to back test
//    3. User-Configurable DC Channel length


// === CALL STRATEGY/STUDY, PROGRAMATICALLY ENTER STRATEGY PARAMETERS HERE SO YOU DON'T HAVE TO CHANGE THEM EVERY TIME YOU RUN A TEST ===
// (STRATEGY ONLY) - Comment out srategy() when in a study()
strategy("Donchian Breakout", overlay=true, initial_capital=10000, currency='USD',
   default_qty_type=strategy.percent_of_equity, default_qty_value=100, commission_type=strategy.commission.percent, commission_value=0.1)
// (STUDY ONLY) - Comment out study() when in a strategy()
//study("Donchian Breakout", overlay=true)


// === BACKTEST RANGE ===
From_Year  = input(defval = 2019, title = "From Year")
From_Month = input(defval = 1, title = "From Month", minval = 1, maxval = 12)
From_Day   = input(defval = 1, title = "From Day", minval = 1, maxval = 31)
To_Year    = input(defval = 9999, title = "To Year")
To_Month   = input(defval = 1, title = "To Month", minval = 1, maxval = 12)
To_Day     = input(defval = 1, title = "To Day", minval = 1, maxval = 31)
Start  = timestamp(From_Year, From_Month, From_Day, 00, 00)  // backtest start window
Finish = timestamp(To_Year, To_Month, To_Day, 23, 59)        // backtest finish window

// == INPUTS ==
trigInput = input(title = "Execute Trades On...", defval = "Wick", options=["Wick","Close"]) // Useful for comparing standing stop orders vs. waiting for candle closes prior to action
stopTrail = input(title = "Trail Stops On...", defval = "ATR", options = ["ATR","Bottom of DC Channel","Midline of DC Channel","Tightest of ATR/Bot DC Channel"])
dcPeriod = input(title="DC period", type=input.integer, defval=20)

// === PLOT THE DONCHIAN CHANNEL ===
// Logic
dcUpper = highest(high, dcPeriod)
dcLower = lowest(low, dcPeriod)
dcMid = avg(dcUpper, dcLower)

// Plotting
dcUplot = plot(dcUpper, color=color.blue, linewidth=1, title="Upper Channel Line")
dcLplot = plot(dcLower, color=color.blue, linewidth=1, title="Lower Channel Line")
dcMidPlot = plot(dcMid, color=color.gray, linewidth=1, title="Mid-Line Average")
fill(dcUplot, dcLplot, color=color.gray, transp=90)

// == FILTERING ==
// Inputs
useMaFilter = input(title = "Use MA for Filtering?", type = input.bool, defval = true)
maType = input(defval="SMA", options=["EMA", "SMA"], title = "MA Type For Filtering")
maLength   = input(defval = 100, title = "MA Period for Filtering", minval = 1)

// Declare function to be able to swap out EMA/SMA
ma(maType, src, length) =>
    maType == "EMA" ? ema(src, length) : sma(src, length) //Ternary Operator (if maType equals EMA, then do ema calc, else do sma calc)
maFilter = ma(maType, close, maLength)
plot(maFilter, title = "Trend Filter MA", color = color.green, linewidth = 3, style = plot.style_line, transp = 50)

// Check to see if the useMaFilter check box is checked, this then inputs this conditional "maFilterCheck" variable into the strategy entry
maFilterCheck = if useMaFilter == true
    maFilter
else
    0

// == ENTRY AND EXIT CRITERIA ==
// Trigger stop based on candle close or High/Low (i.e. Wick) - If doing daily timeframe, can do candle close.  Intraday should use wick.
trigResistance = trigInput == "Close" ? close : trigInput == "Wick" ? high : na
trigSupport = trigInput == "Close" ? close : trigInput == "Wick" ? low : na
buySignal = trigResistance >= dcUpper[1] // The [1] looks at the previous bar's value as it didn't seem to be triggering correctly without it (likely) DC moves with each bar
sellSignal = trigSupport <= dcLower[1]

buy = buySignal and dcUpper[1] > maFilterCheck // All these conditions need to be met to buy


// (STRATEGY ONLY) Comment out for Study
// This string of code enters and exits at the close
if (trigInput == "Close")
    strategy.entry("Long", strategy.long, when = buy)
    strategy.close("Long", when = sellSignal)

// This string of code enters and exits at the wick (i.e. with pre-set stops)
if (trigInput == "Wick")
    strategy.entry("Long", strategy.long, stop = dcUpper[1], when = time > Start and time < Finish and dcUpper[1] > maFilterCheck)
    strategy.exit("Exit Long", from_entry = "Long", stop = dcLower[1])
- 二重追跡の亀取引戦略
- イチモク・キンコ・ヒョー ベースBTC取引戦略
- AO指標に基づく傾向 戦略をフォローする
- ユニバーサル・スナイパー戦略
- 二重指標ハイブリッド量的な取引戦略
- ボリンジャー・バンドス・モメンタム・ブレイクアウト戦略
- ボリンジャー・バンド 移動平均に基づく短期逆転量的な戦略
- グラデントMACD量子戦略
- 双方向の迅速量的な逆転取引戦略
- ハイキン・アシとカウフマン 適応型移動平均取引戦略
- イチモク移動平均クロスオーバー戦略
- 動力と取引量戦略
- フラクタル・ブレークアウト戦略
- ビル・ウィリアムズ 素晴らしいオシレーター取引戦略
- 波動性 有限量要素戦略
- このBISTは4段階の定量化買収戦略を
- Kifierの隠されたMFI/STOCHダイバージェンス/トレンドブレイカー取引戦略
- MACD量的な取引戦略
- 動向平均の二重トレンド追跡戦略
- 動向を追跡する手段の逆転戦略