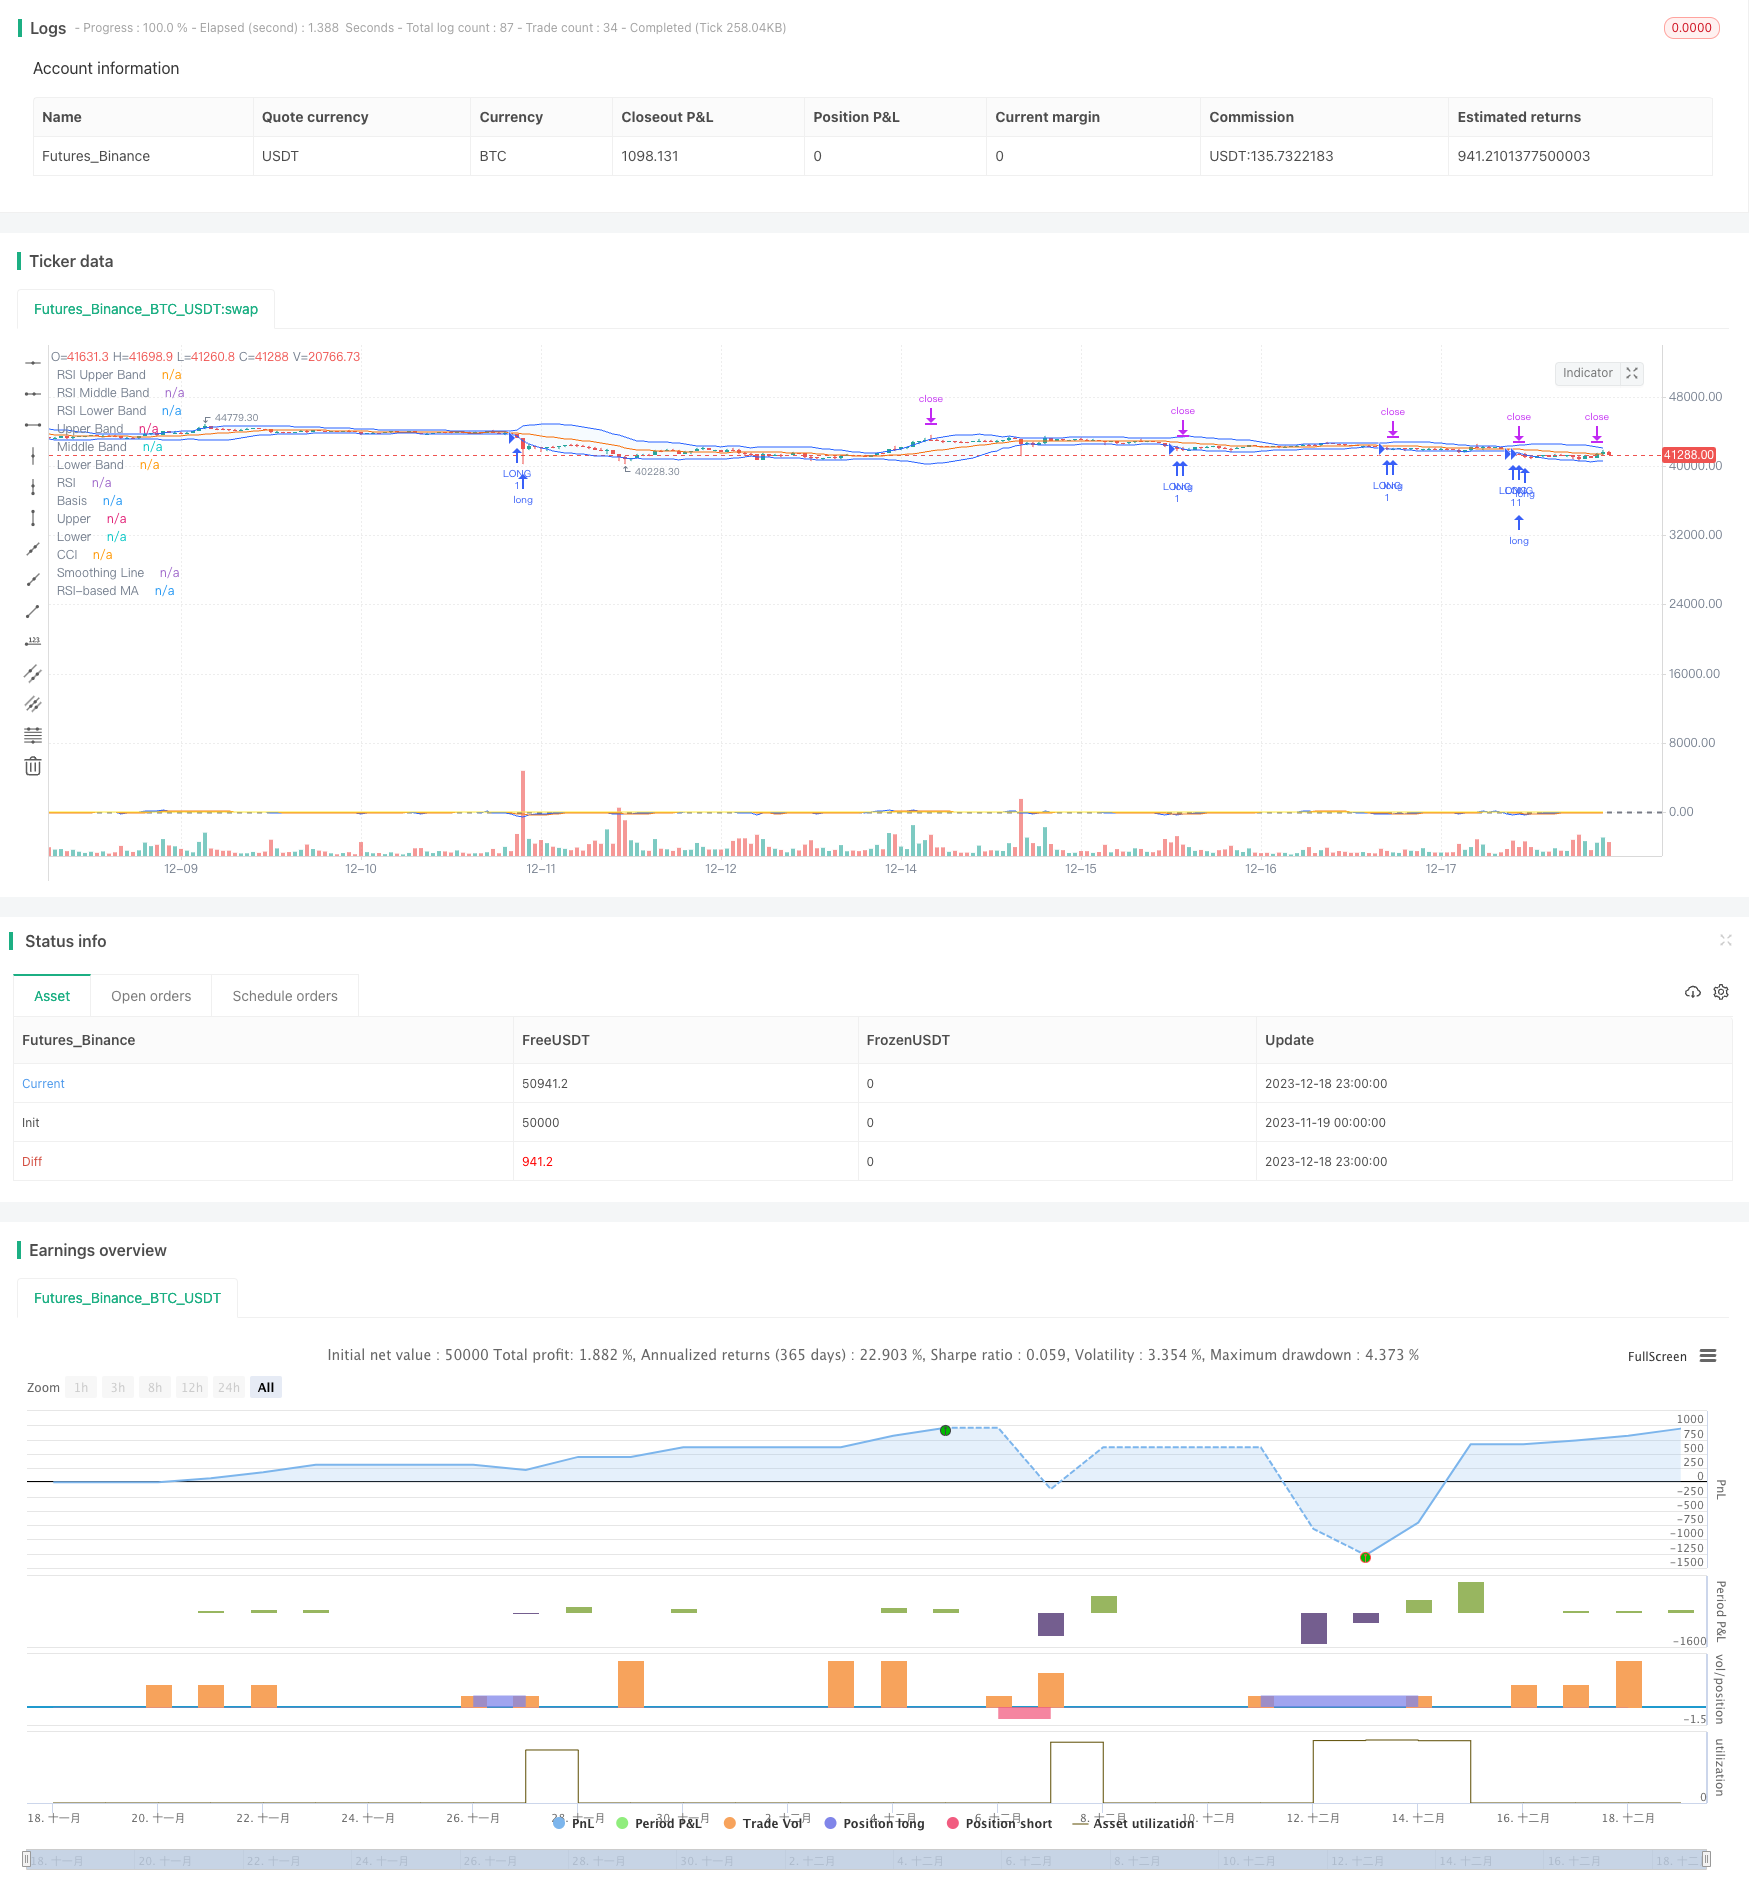
定量戦略:ボリンジャー帯 RSI CCIクロスオーバー戦略
作者: リン・ハーンチャオチャン, 日時: 2023-12-20 16:24:49タグ:

概要
この戦略は,ボリンジャーバンド,相対強度指数 (RSI) とコモディティチャネル指数 (CCI) を組み合わせてクロスオーバー信号を見つけ,買い売り信号を生成する.この戦略は,市場で買い過ぎと売り過ぎのシナリオを特定し,より良い投資リターンのために inflection ポイントでポジションを取ることを目的としています.
戦略の論理
ボリンジャー・バンド
ボリンジャー帯は,中帯,上帯,下帯からなる.中帯は通常20日間の移動平均線である.上帯は中帯の上から2つの標準偏差である.下帯は下から2つの標準偏差である.下帯近くの価格は過売り状態を示す可能性がある.上帯近くの価格は過買い状態を示す可能性がある.
RSI
RSIは,指向的な価格動きの上下速度を測定する.これは70を超える過買いと30以下の過売りを示します.RSIが70を超える値から落ちると,それは売り信号である.RSIが30以下の値から反転すると,それは買い信号である.
CCI
CCIは,価格が平均価格からどの程度移動したか測定する. +100以上の値が過剰購入状態を意味する. -100以下の値が過剰販売状態を意味する. CCIは極端な価格レベルを反映する.
クロスオーバー信号
この戦略は,ボリンガー帯を使用して短期間の過剰購入/過剰販売レベル,RSIを使用して上昇/下落の勢いを測定し,CCIを使用して価格極端を特定します.すべての3つの指標がフラッシュで購入/売却信号を発信すると,戦略は取引注文を発行します.
利点
- 複数の指標を組み合わせることで 信号の正確性が向上し 誤った信号は減少します
- ターニングポイントで逆転の機会を捉える
- パーソナライズ可能なパラメータは,異なる市場状況に適応する
- 滑らかなCCIフィルターはノイズを軽減し安定性を向上させる
リスク と 解決策
- この3つの指標は,誤った信号を生成し,損失を引き起こす可能性があります.パラメータを緩めるか,他のフィルターを追加することができます.
- CCIは不安定な市場と戦っています 移動平均値や波動指数で置き換えることができます
- 利益を取ることなく ストップ・ロスを追加して 利益を得ることができます
最適化 の 機会
- 最適な設定を見つけるためにより多くのパラメータ組み合わせをテストする
- パラメータを自動調整する機械学習を導入
- 利益目標を持つ利益増やす戦略
- MACD,KDのようなより多くの指標を組み込む 信号を検証するために
結論
この戦略は,ボリンジャーバンド,RSI,CCIインジケーターを用いて市場全体的な状況を分析する.クロスオーバー信号を通じて,市場の逆転を取引するための曲線点を特定する.パラメータチューニング,利益採取メカニズムなどのさらなる最適化により,さまざまな市場環境のための強力な反トレンド戦略である.
/*backtest
start: 2023-11-19 00:00:00
end: 2023-12-19 00:00:00
period: 1h
basePeriod: 15m
exchanges: [{"eid":"Futures_Binance","currency":"BTC_USDT"}]
*/

//@version=5
strategy(shorttitle="BBRSIstr", title="Bollinger Bands", overlay=true)
length = input.int(20, minval=1)
maType = input.string("SMA", "Basis MA Type", options = ["SMA", "EMA", "SMMA (RMA)", "WMA", "VWMA"])
src = input(close, title="Source")
mult = input.float(2.0, minval=0.001, maxval=50, title="StdDev")

ma(source, length, _type) =>
    switch _type
        "SMA" => ta.sma(source, length)
        "EMA" => ta.ema(source, length)
        "SMMA (RMA)" => ta.rma(source, length)
        "WMA" => ta.wma(source, length)
        "VWMA" => ta.vwma(source, length)

basis = ma(src, length, maType)
dev = mult * ta.stdev(src, length)
upper = basis + dev
lower = basis - dev
offset = input.int(0, "Offset", minval = -500, maxval = 500)
plot(basis, "Basis", color=#FF6D00, offset = offset)
p1 = plot(upper, "Upper", color=#2962FF, offset = offset)
p2 = plot(lower, "Lower", color=#2962FF, offset = offset)
fill(p1, p2, title = "Background", color=color.rgb(33, 150, 243, 95))

//RSI
rsiLengthInput = input.int(14, minval=1, title="RSI Length", group="RSI Settings")
rsiSourceInput = input.source(close, "Source", group="RSI Settings")
maTypeInput = input.string("SMA", title="MA Type", options=["SMA", "Bollinger Bands", "EMA", "SMMA (RMA)", "WMA", "VWMA"], group="MA Settings")
maLengthInput = input.int(14, title="MA Length", group="MA Settings")
bbMultInput = input.float(2.0, minval=0.001, maxval=50, title="BB StdDev", group="MA Settings")
showDivergence = input.bool(false, title="Show Divergence", group="RSI Settings")

up = ta.rma(math.max(ta.change(rsiSourceInput), 0), rsiLengthInput)
down = ta.rma(-math.min(ta.change(rsiSourceInput), 0), rsiLengthInput)
rsi = down == 0 ? 100 : up == 0 ? 0 : 100 - (100 / (1 + up / down))
rsiMA = ma(rsi, maLengthInput, maTypeInput)
isBB = maTypeInput == "Bollinger Bands"

rsiPlot = plot(rsi, "RSI", color=#7E57C2)
plot(rsiMA, "RSI-based MA", color=color.yellow)
rsiUpperBand = hline(70, "RSI Upper Band", color=#787B86)
midline = hline(50, "RSI Middle Band", color=color.new(#787B86, 50))
rsiLowerBand = hline(30, "RSI Lower Band", color=#787B86)
fill(rsiUpperBand, rsiLowerBand, color=color.rgb(126, 87, 194, 90), title="RSI Background Fill")

//cci
ma = ta.sma(src, length)
cci = (src - ma) / (0.015 * ta.dev(src, length))
plot(cci, "CCI", color=#2962FF)
band1 = hline(100, "Upper Band", color=#787B86, linestyle=hline.style_dashed)
hline(0, "Middle Band", color=color.new(#787B86, 50))
band0 = hline(-100, "Lower Band", color=#787B86, linestyle=hline.style_dashed)
fill(band1, band0, color=color.rgb(33, 150, 243, 90), title="Background")

typeMA = input.string(title = "Method", defval = "SMA", options=["SMA", "EMA", "SMMA (RMA)", "WMA", "VWMA"], group="Smoothing")
smoothingLength = input.int(title = "Length", defval = 5, minval = 1, maxval = 100, group="Smoothing")

smoothingLine = ma(cci, smoothingLength, typeMA)
plot(smoothingLine, title="Smoothing Line", color=#f37f20, display=display.none)


longCBB= close < lower
shortCBB = close>upper
longBRSI = rsi < 33
shortBRSI = rsi > 70
longcci = cci < -215
shortcci = cci > 250

strategy.entry("LONG", strategy.long, when = longCBB and longBRSI and longcci)
strategy.exit("Exit ", profit = 600)
strategy.entry("SHORT", strategy.short, when = shortCBB and shortBRSI and shortcci)
strategy.exit("Exit ", profit = 600)
もっと
- インタラクティブなモデルベースのキャンドルスティック取引戦略
- DEMA MACD 組み合わせ戦略
- イチモク・イイン・ヤング キャンドルスタイク ブレイク戦略
- 流動性に基づくトレンド戦略 - 流動トレンド指針に基づく量取引戦略
- EMAのクロスオーバー戦略
- SMA RSI & 突然の買い売る戦略
- 2つの要素による量的な逆転追跡戦略
- エーラーズ 瞬間のトレンドライン戦略
- 双重EMAのゴールデンクロスブレークスルー戦略
- トールとベアパワー 移動平均取引戦略
- VWAPの脱出追跡戦略
- モメント・リバーサル・トレーディング・戦略
- モメント トラッキング トレーディング戦略
- 複数の重度の移動平均値のトレンド戦略
- ボリンジャー帯とMACDに基づく取引戦略
- マクド・ブルー・レッド・レバレッジ・戦略
- モメントキャプチャチャネル戦略
- 振動逆転戦略をヘッジする
- ボリンジャー帯とRSIに基づく定量的な取引戦略
- 相対量指標戦略