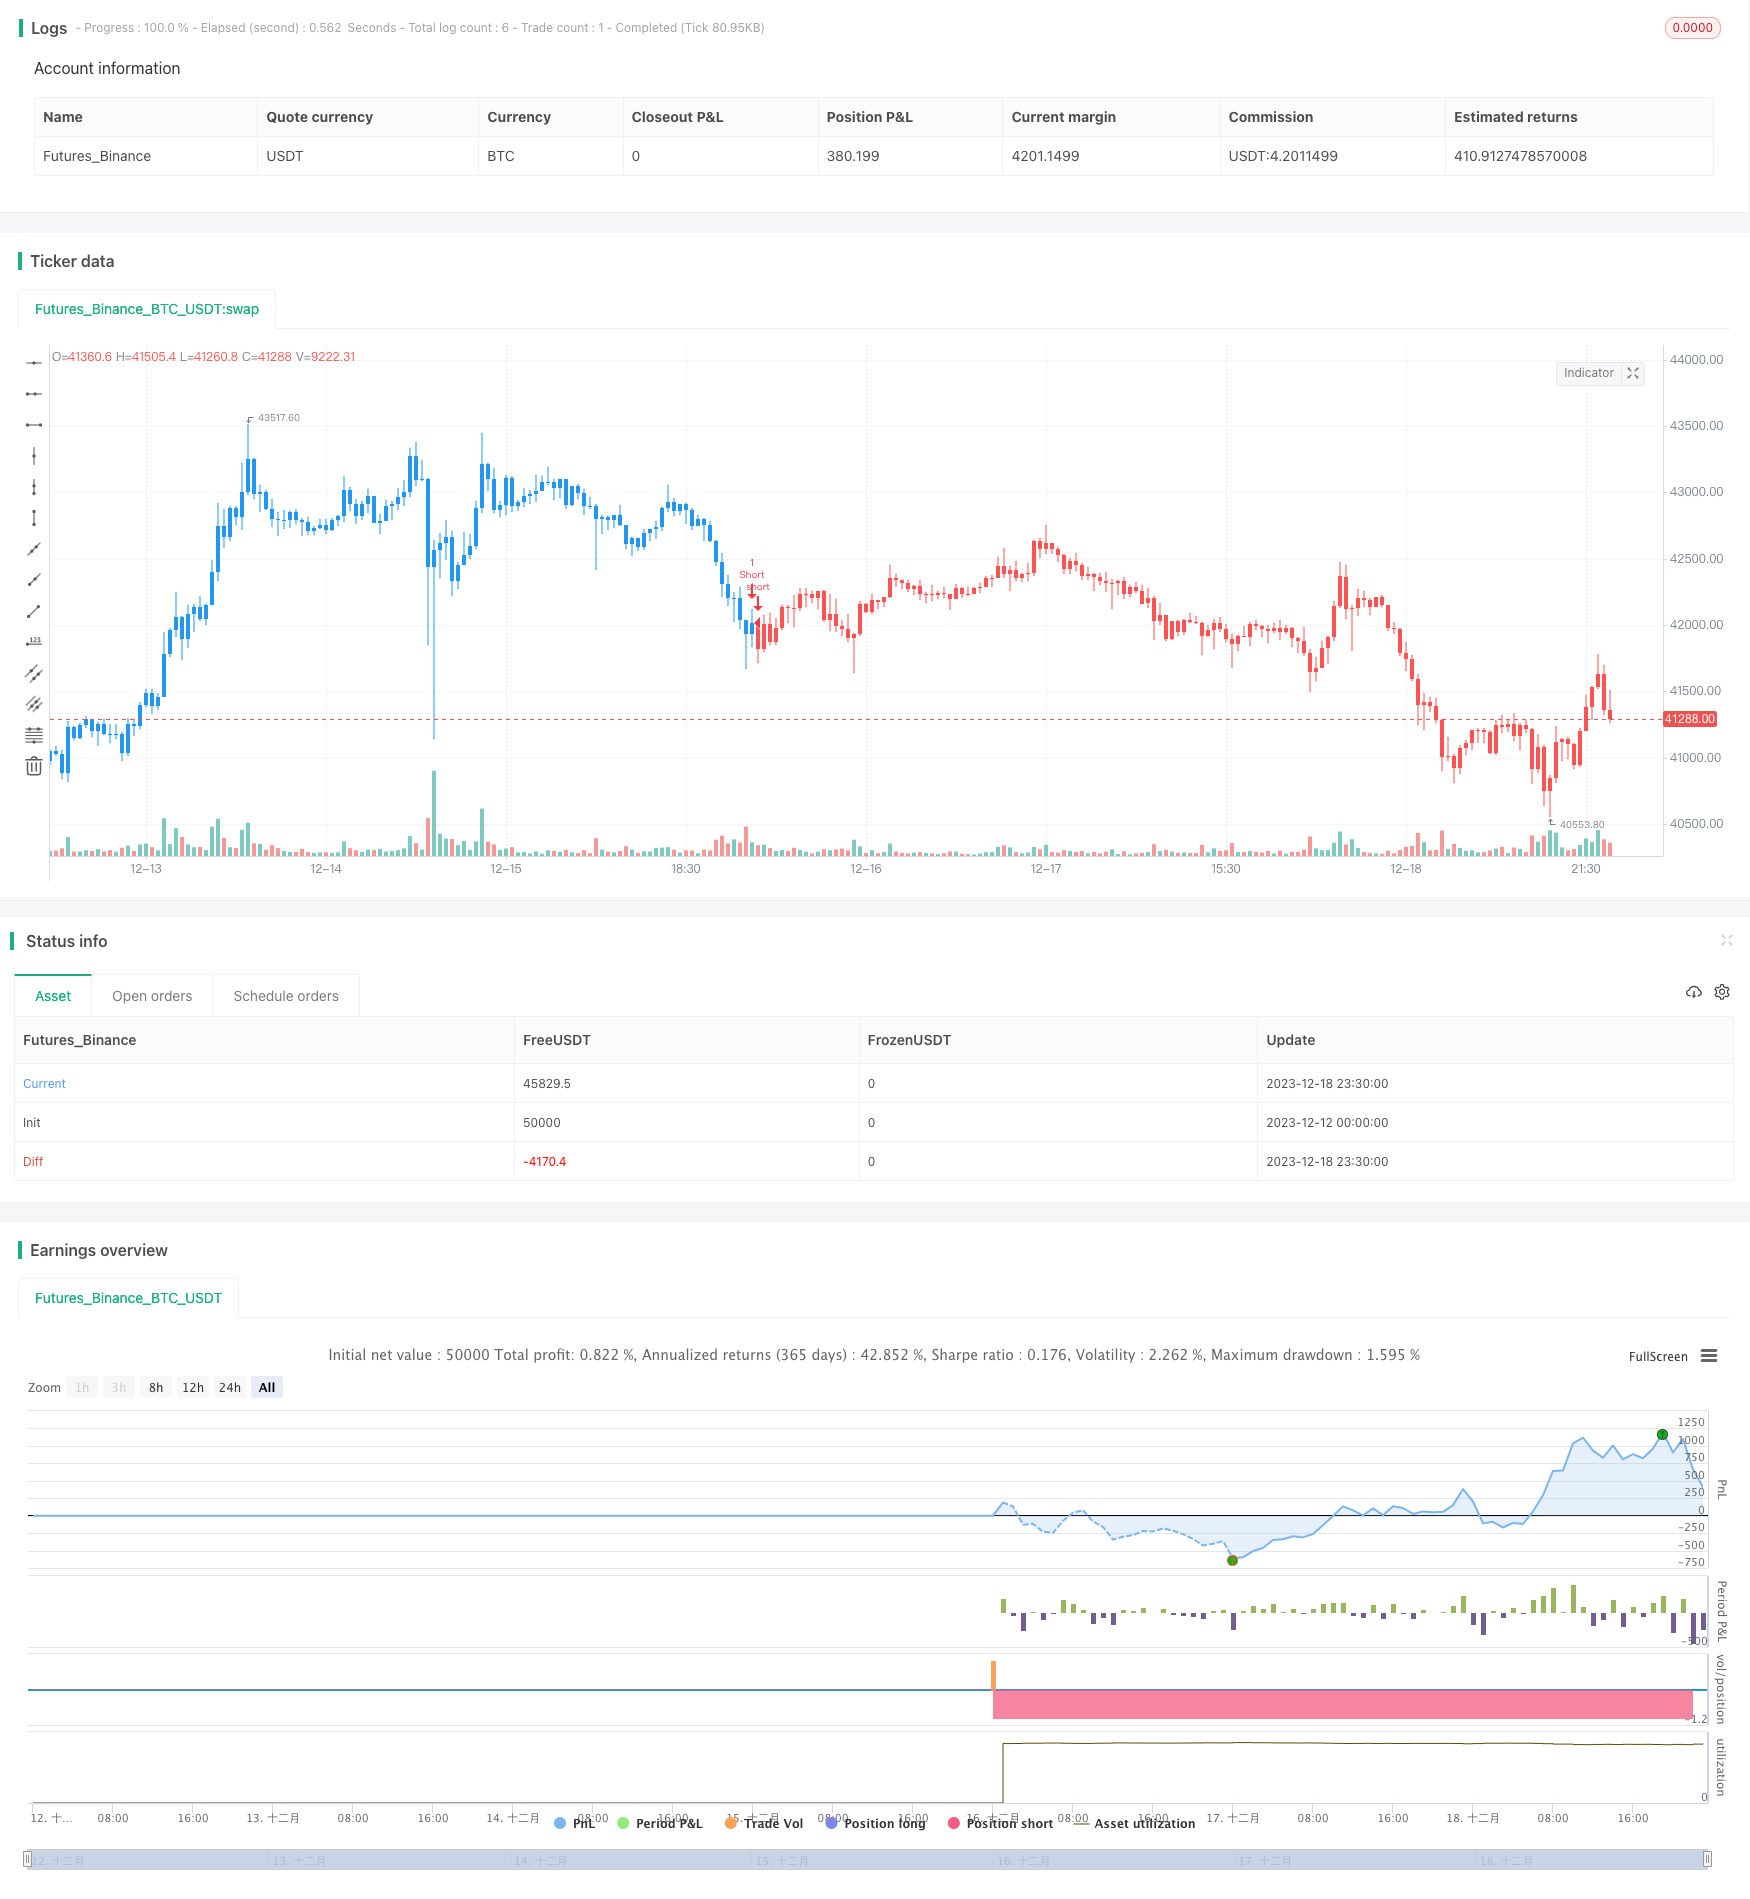
トールとベアパワー 移動平均取引戦略
作者: リン・ハーンチャオチャン開催日:2023年12月20日 16:30:02タグ:

概要
この戦略は,市場における買取・販売圧力を測定するために,ブルとベアパワー移動平均の理論に基づいて,アレキサンダー・エルダー博士によって開発された.この戦略は,一般的にトリプルスクリーン取引システムと併用されるが,単独でも使用することができる.エルダー博士は,市場の価値の合意を反映するために13日指数関数移動平均 (EMA) を使用する.ブルパワーとは,買い手の価格を価値の合意よりも高く動かす能力を反映する.ベアパワーとは,売り手の価格を平均価値の合意を下回る能力を反映する.
ブールパワーとは,日高から13日間のEMAを引く.ベアパワーとは,日低から13日間のEMAを引く.
戦略の論理
この戦略は,アレキサンダー・エルダー博士の牛と熊の力の理論に基づいています.牛と熊の力の指標を計算することによって,市場の動向と力を判断します.具体的には,牛の力の指標は,最も高い価格から13日間のEMAを引いて計算される買い手の力を反映しています.熊の力の指標は,最も低い価格から13日間のEMAを引いて計算される売り手の力を反映しています.牛の力が一定の
コードでは,高値,低値,13日間のEMAを使用して牛と熊のパワー指標を計算します.指標が起動すると対応するロングまたはショートポジションが開かれるようにトリガースロージールを設定します.同時に,ストップロスを設定し,ポジションを管理するために利益ロジックを使用します.全体として,この戦略は,取引のための市場のトレンドの強さを決定するために,買い手と売り手の相対力を比較します.
利点分析
この戦略の利点は以下の通りです.
- 市場動向を判断し,購入力と販売力を利用してバックテストする
- 判断しやすい明確な買い物・売却信号
- リスクを制御するための信頼性の高いストップ・ロスのメカニズム
- トリプルスクリーン取引システムと組み合わせるとさらにうまく機能します
リスク分析
この戦略によるリスクは以下のとおりです.
- 異なる市場に合わせて調整する必要がある主観的なパラメータ設定
- 牛 と 熊 の 力 の 指標 は 誤解 を もたらす 信号 を 出す こと が でき ます
- 誤ったストップ・ロスは損失を増やす可能性があります.
- 業績は取引手段と時間枠に依存する
対策:
- 異なる市場のためのパラメータを最適化
- 他の指標を使用してフィルターを追加する
- リスクを厳格に制御するためにストップ損失ロジックを最適化
- 適切な取引手段と時間枠を選択する
オプティマイゼーションの方向性
この戦略は,次の側面で最適化できます.
- 異なるタイムフレームのための移動平均パラメータを最適化
- フィルター信号にMACDのような他の指標を追加
- ストップ損失を最適化し,トレイルストップ損失などの利益ロジックを取
- マシン学習を使用してパラメータを自動的に最適化します
- 買い/売るシグナルを予測するためのディープラーニングを組み込む
この戦略は,パラメータ,信号,リスク管理など,より堅牢で信頼性の高いものにするために最適化できる余地があります.
結論
この戦略は,Eldor博士によって開発された買/売力の理論に基づいて,牛と熊のパワー指標を使用して市場動向とパワーを判断する.シグナルルールは比較的シンプルで明確である.利点には,パワーを通じてトレンドを判断し,ストップロスの経由でリスクを制御することが含まれる.また,主観的パラメータや誤解を招く信号などのリスクもあります.パラメータを最適化し,シグナルフィルターと厳格なストップロスを追加することで安定性と収益性を向上させることができます.この戦略は積極的な量子トレーダーに適しています.
/*backtest
start: 2023-12-12 00:00:00
end: 2023-12-19 00:00:00
period: 30m
basePeriod: 15m
exchanges: [{"eid":"Futures_Binance","currency":"BTC_USDT"}]
*/

//@version = 5
////////////////////////////////////////////////////////////
//  Copyright by HPotter v1.0 06/10/2022
// Developed by Dr Alexander Elder, the Elder-ray indicator measures buying
// and selling pressure in the market. The Elder-ray is often used as part
// of the Triple Screen trading system but may also be used on its own.
// Dr Elder uses a 13-day exponential moving average (EMA) to indicate the
// market consensus of value. Bull Power measures the ability of buyers to
// drive prices above the consensus of value. Bear Power reflects the ability
// of sellers to drive prices below the average consensus of value.
// Bull Power is calculated by subtracting the 13-day EMA from the day's High.
// Bear power subtracts the 13-day EMA from the day's Low.
// WARNING:
// - For purpose educate only
// - This script to change bars colors.
////////////////////////////////////////////////////////////
strategy(title="Elder Ray (Bull Power) TP and SL", shorttitle = "Bull Power", overlay = true)
Profit = input.float(7, title='Take Profit %', minval=0.01)
Stop = input.float(7, title='Stop Loss %', minval=0.01)
Length = input.int(14, minval=1)
Trigger = input.float(-200)
reverse = input.bool(true, title="Trade reverse")
xPrice = close
xMA = ta.ema(xPrice,Length)
var DayHigh = high
DayHigh := dayofmonth != dayofmonth[1]? high: math.max(high, nz(DayHigh[1]))
nRes = DayHigh - xMA
pos = 0
pos := nRes < Trigger ? 1:  0
possig = reverse and pos == 1 ? -1 :
          reverse and pos == -1 ? 1 : pos
if (possig == 1) and strategy.position_size == 0
    strategy.entry('Long', strategy.long, comment='Market Long')
    strategy.exit("ExitLong", 'Long', stop=close - close * Stop / 100 , limit = close + close * Profit / 100 , qty_percent = 100)
if (possig == -1) and strategy.position_size == 0
    strategy.entry('Short', strategy.short, comment='Market Long')
    strategy.exit("ExitShort", 'Short', stop=close + close * Stop / 100 , limit = close - close * Profit / 100 , qty_percent = 100)
barcolor(strategy.position_size == -1 ? color.red: strategy.position_size == 1 ? color.green : color.blue )
- 二重指標の定量戦略
- インタラクティブなモデルベースのキャンドルスティック取引戦略
- DEMA MACD 組み合わせ戦略
- イチモク・イイン・ヤング キャンドルスタイク ブレイク戦略
- 流動性に基づくトレンド戦略 - 流動トレンド指針に基づく量取引戦略
- EMAのクロスオーバー戦略
- SMA RSI & 突然の買い売る戦略
- 2つの要素による量的な逆転追跡戦略
- エーラーズ 瞬間のトレンドライン戦略
- 双重EMAのゴールデンクロスブレークスルー戦略
- 定量戦略:ボリンジャー帯 RSI CCIクロスオーバー戦略
- VWAPの脱出追跡戦略
- モメント・リバーサル・トレーディング・戦略
- モメント トラッキング トレーディング戦略
- 複数の重度の移動平均値のトレンド戦略
- ボリンジャー帯とMACDに基づく取引戦略
- マクド・ブルー・レッド・レバレッジ・戦略
- モメントキャプチャチャネル戦略
- 振動逆転戦略をヘッジする
- ボリンジャー帯とRSIに基づく定量的な取引戦略