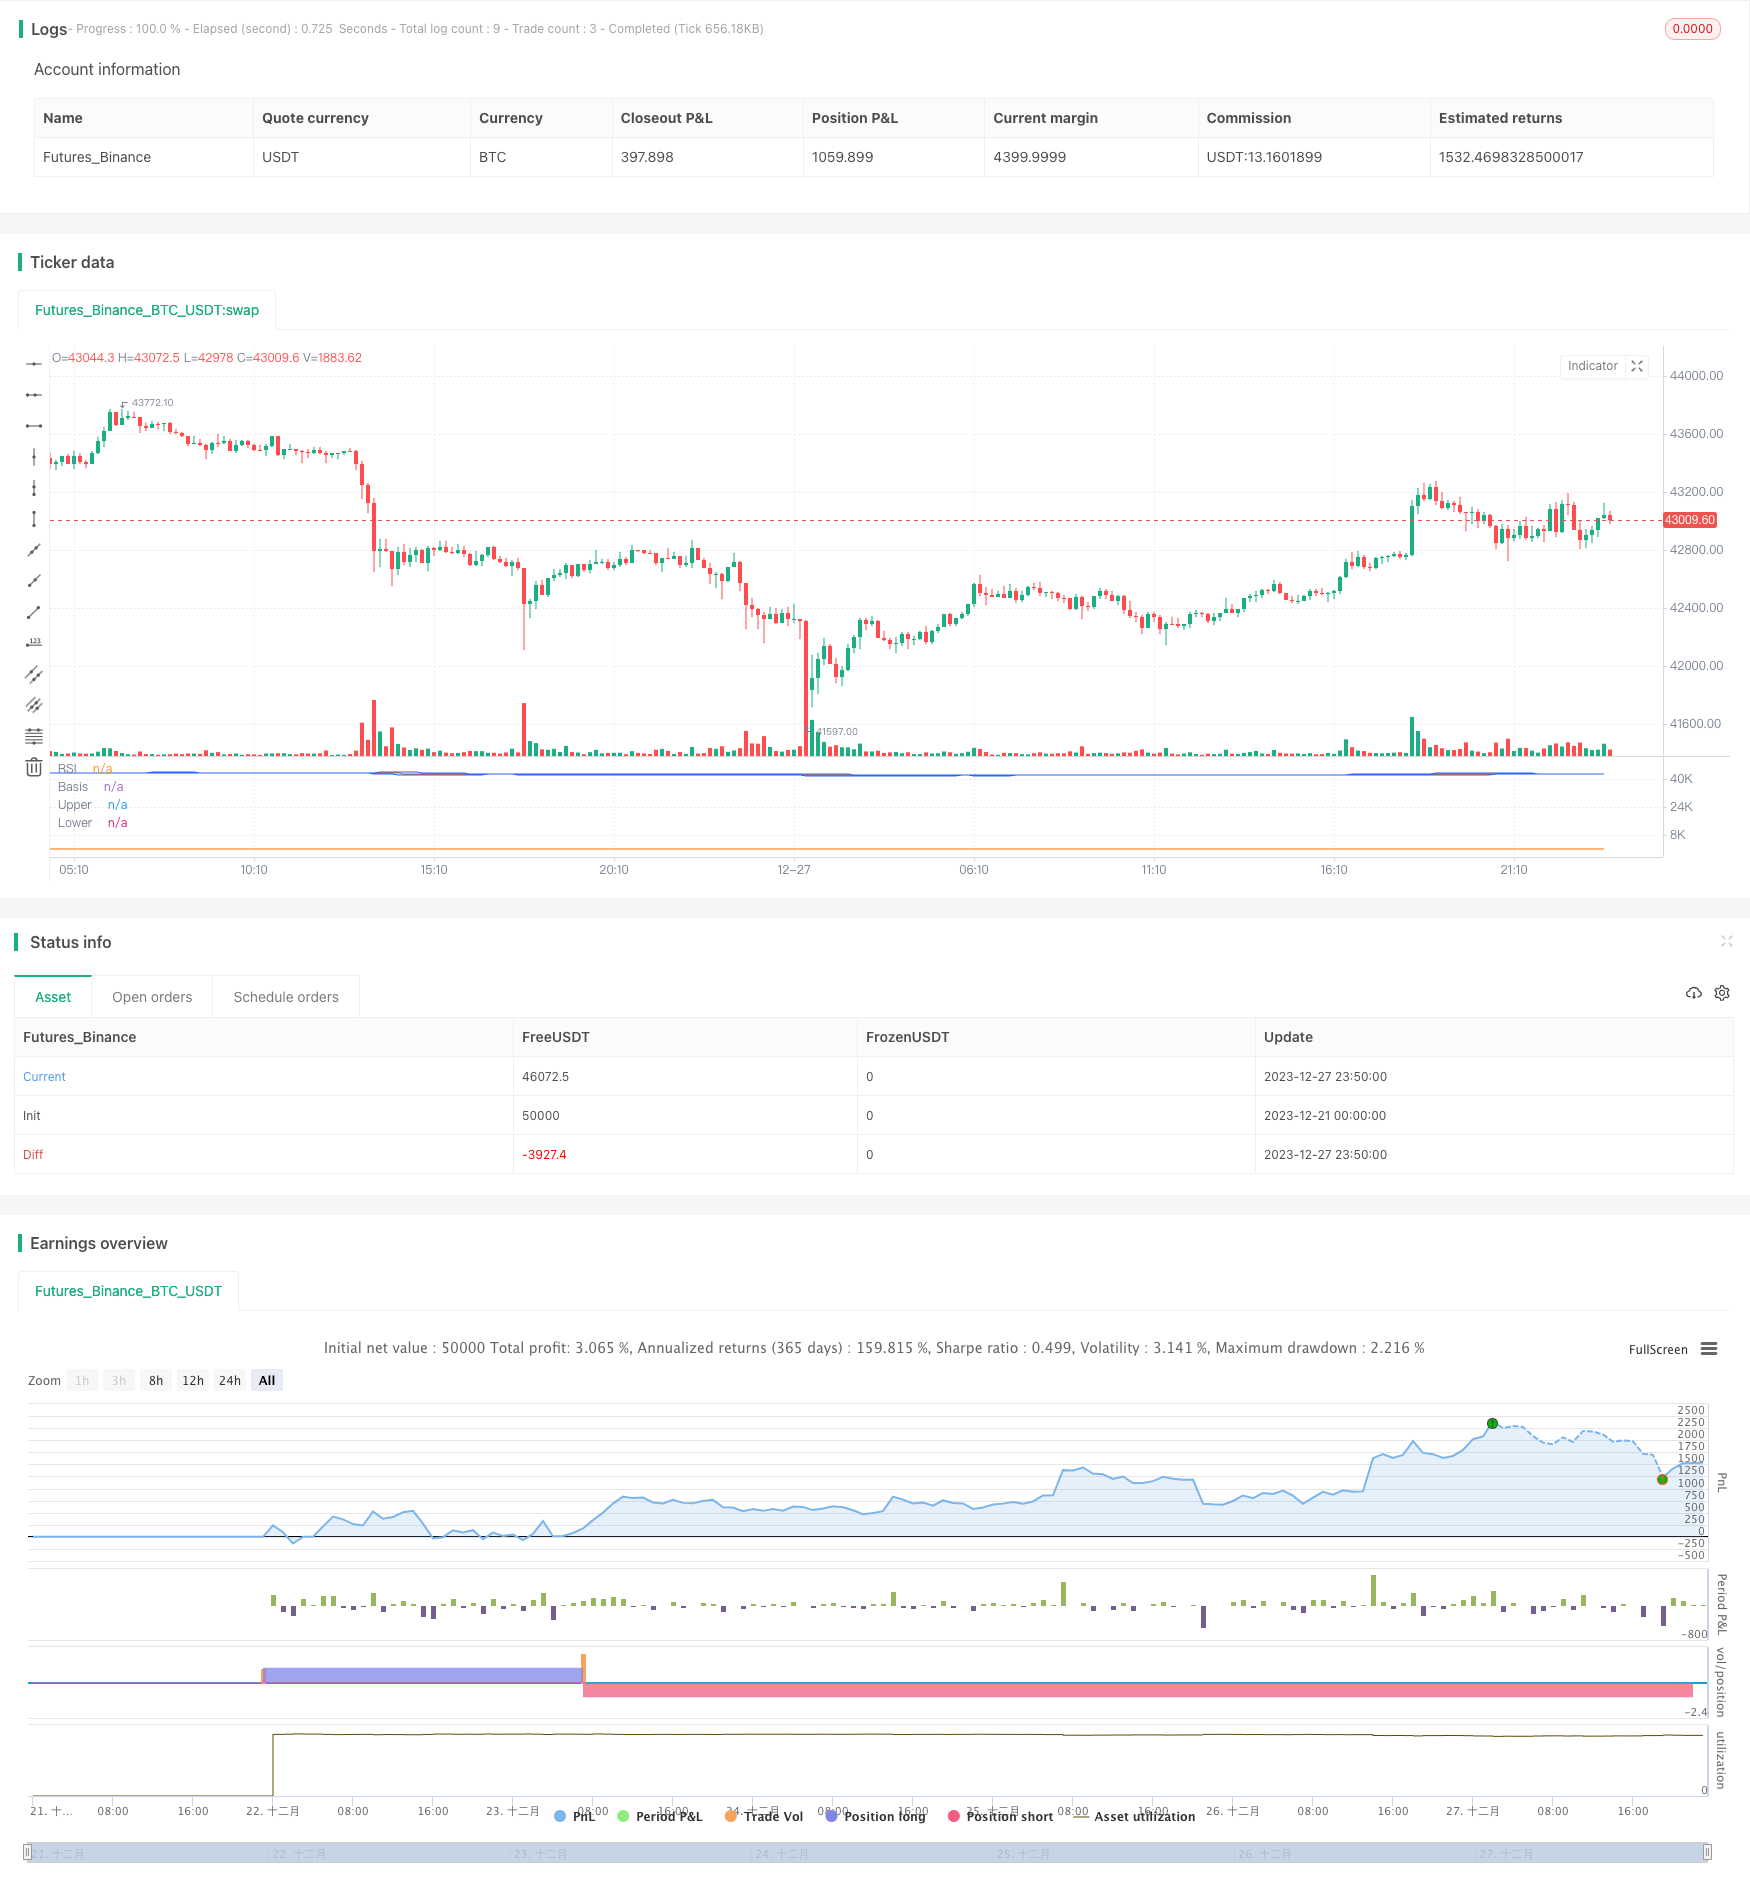
ボリンジャーバンドRSIクロスオーバー戦略

概要
この戦略は,ボーリン帯と相対的に強い指数 (RSI) の技術指標を組み合わせて,RSI指標の金叉または死叉が発生したときに,価格がボーリン帯を上線または下線に触れたり突破したかどうかを判断し,購入と販売のシグナルを発信します.
戦略原則
20周期のSMAをベースラインとして計算し,上線はベースライン+2倍標準差,下線はベースライン-2倍標準差で,ボリン帯を構成する.
14サイクルRSI値を計算すると,RSIが70以上なら超買区,30以下なら超売区となる.
RSI指標が30を下回ったとき,価格が下線より低い場合,買取シグナルを生成する.RSI指標が70を超えたとき,価格が上線より高い場合,売り出しシグナルを生成する.
優位分析
ボリン帯は標準差の範囲を利用して価格の変動と将来の動きを判断し,強い傾向判断能力を持っている.
RSI指標は,超買超売の状況を判断し,ボーリン帯軌道判断と組み合わせて,反転の機会を効果的に発見することができます.
RSI指標は突破シグナルを形成しやすく,ボリン帯と結合すると,シグナルがより正確で信頼できる.
リスク分析
ボリン・ベルトは100%正確ではないので,上下線を突破して運行し続ける可能性がある.
RSI指数は,ボリン帯判断の結果と一致しない偽突破信号を形成することも可能である.
適切なパラメータの調整は非常に重要であり,パラメータの設定を間違えた場合,取引シグナルの頻度が高くなり,または稀に発生する可能性があります.
最適化の方向
異なる周期のパラメータをテストし,最適なパラメータ組み合わせを探します.
KD,MACDなどの他の指標と組み合わせて信号の信頼性を向上させることができる.
分析結果に基づいて,ストップ・ストップ戦略を最適化し,リスクを制御することができる.
要約する
この戦略は,ボーリン帯のトレンド分析とRSI指標の超買超売判断を統合し,取引シグナルを形成する.総じて,戦略の考え方は明確で,実行しやすい,実戦的な価値がある.しかし,一定のリスクも存在し,パラメータの調整と指標の統合に注意し,異なる市場環境に適応するように継続的に最適化する必要があります.
/*backtest
start: 2023-12-21 00:00:00
end: 2023-12-28 00:00:00
period: 10m
basePeriod: 1m
exchanges: [{"eid":"Futures_Binance","currency":"BTC_USDT"}]
*/

//@version=5
strategy("Bollinger Bands and RSI Strategy", overlay=false)

// Define the parameters
length = input.int(20, "Length", minval=1)
src = input(close, "Source")
mult = input.float(2.0, "StdDev", minval=0.001, maxval=50)
rsiLength = input.int(14, "RSI Length", minval=1)
rsiOverbought = input.int(70, "RSI Overbought Level", minval=1, maxval=100)
rsiOversold = input.int(30, "RSI Oversold Level", minval=1, maxval=100)

// Calculate the Bollinger Bands
basis = ta.sma(src, length)
dev = mult * ta.stdev(src, length)
upper = basis + dev
lower = basis - dev

// Plot the Bollinger Bands
plot(basis, "Basis", color=#FF6D00)
p1 = plot(upper, "Upper", color=#2962FF)
p2 = plot(lower, "Lower", color=#2962FF)
fill(p1, p2, color=color.rgb(33, 150, 243, 90), title="Background")

// Calculate the RSI
rsi = ta.rsi(src, rsiLength)

// Plot the RSI
plot(rsi, "RSI", color=#FF6D00)

// Define the entry and exit conditions
longCondition = ta.crossover(rsi, rsiOversold) and src < lower // Use ta.crossover here
if (longCondition)
    strategy.entry("Long", strategy.long)

shortCondition = ta.crossunder(rsi, rsiOverbought) and src > upper // Use ta.crossunder here
if (shortCondition)
    strategy.entry("Short", strategy.short)

// Plot the buy and sell signals
plotshape(longCondition, title="Buy", location=location.belowbar, color=color.green, style=shape.triangleup, size=size.small)
plotshape(shortCondition, title="Sell", location=location.abovebar, color=color.red, style=shape.triangledown, size=size.small)