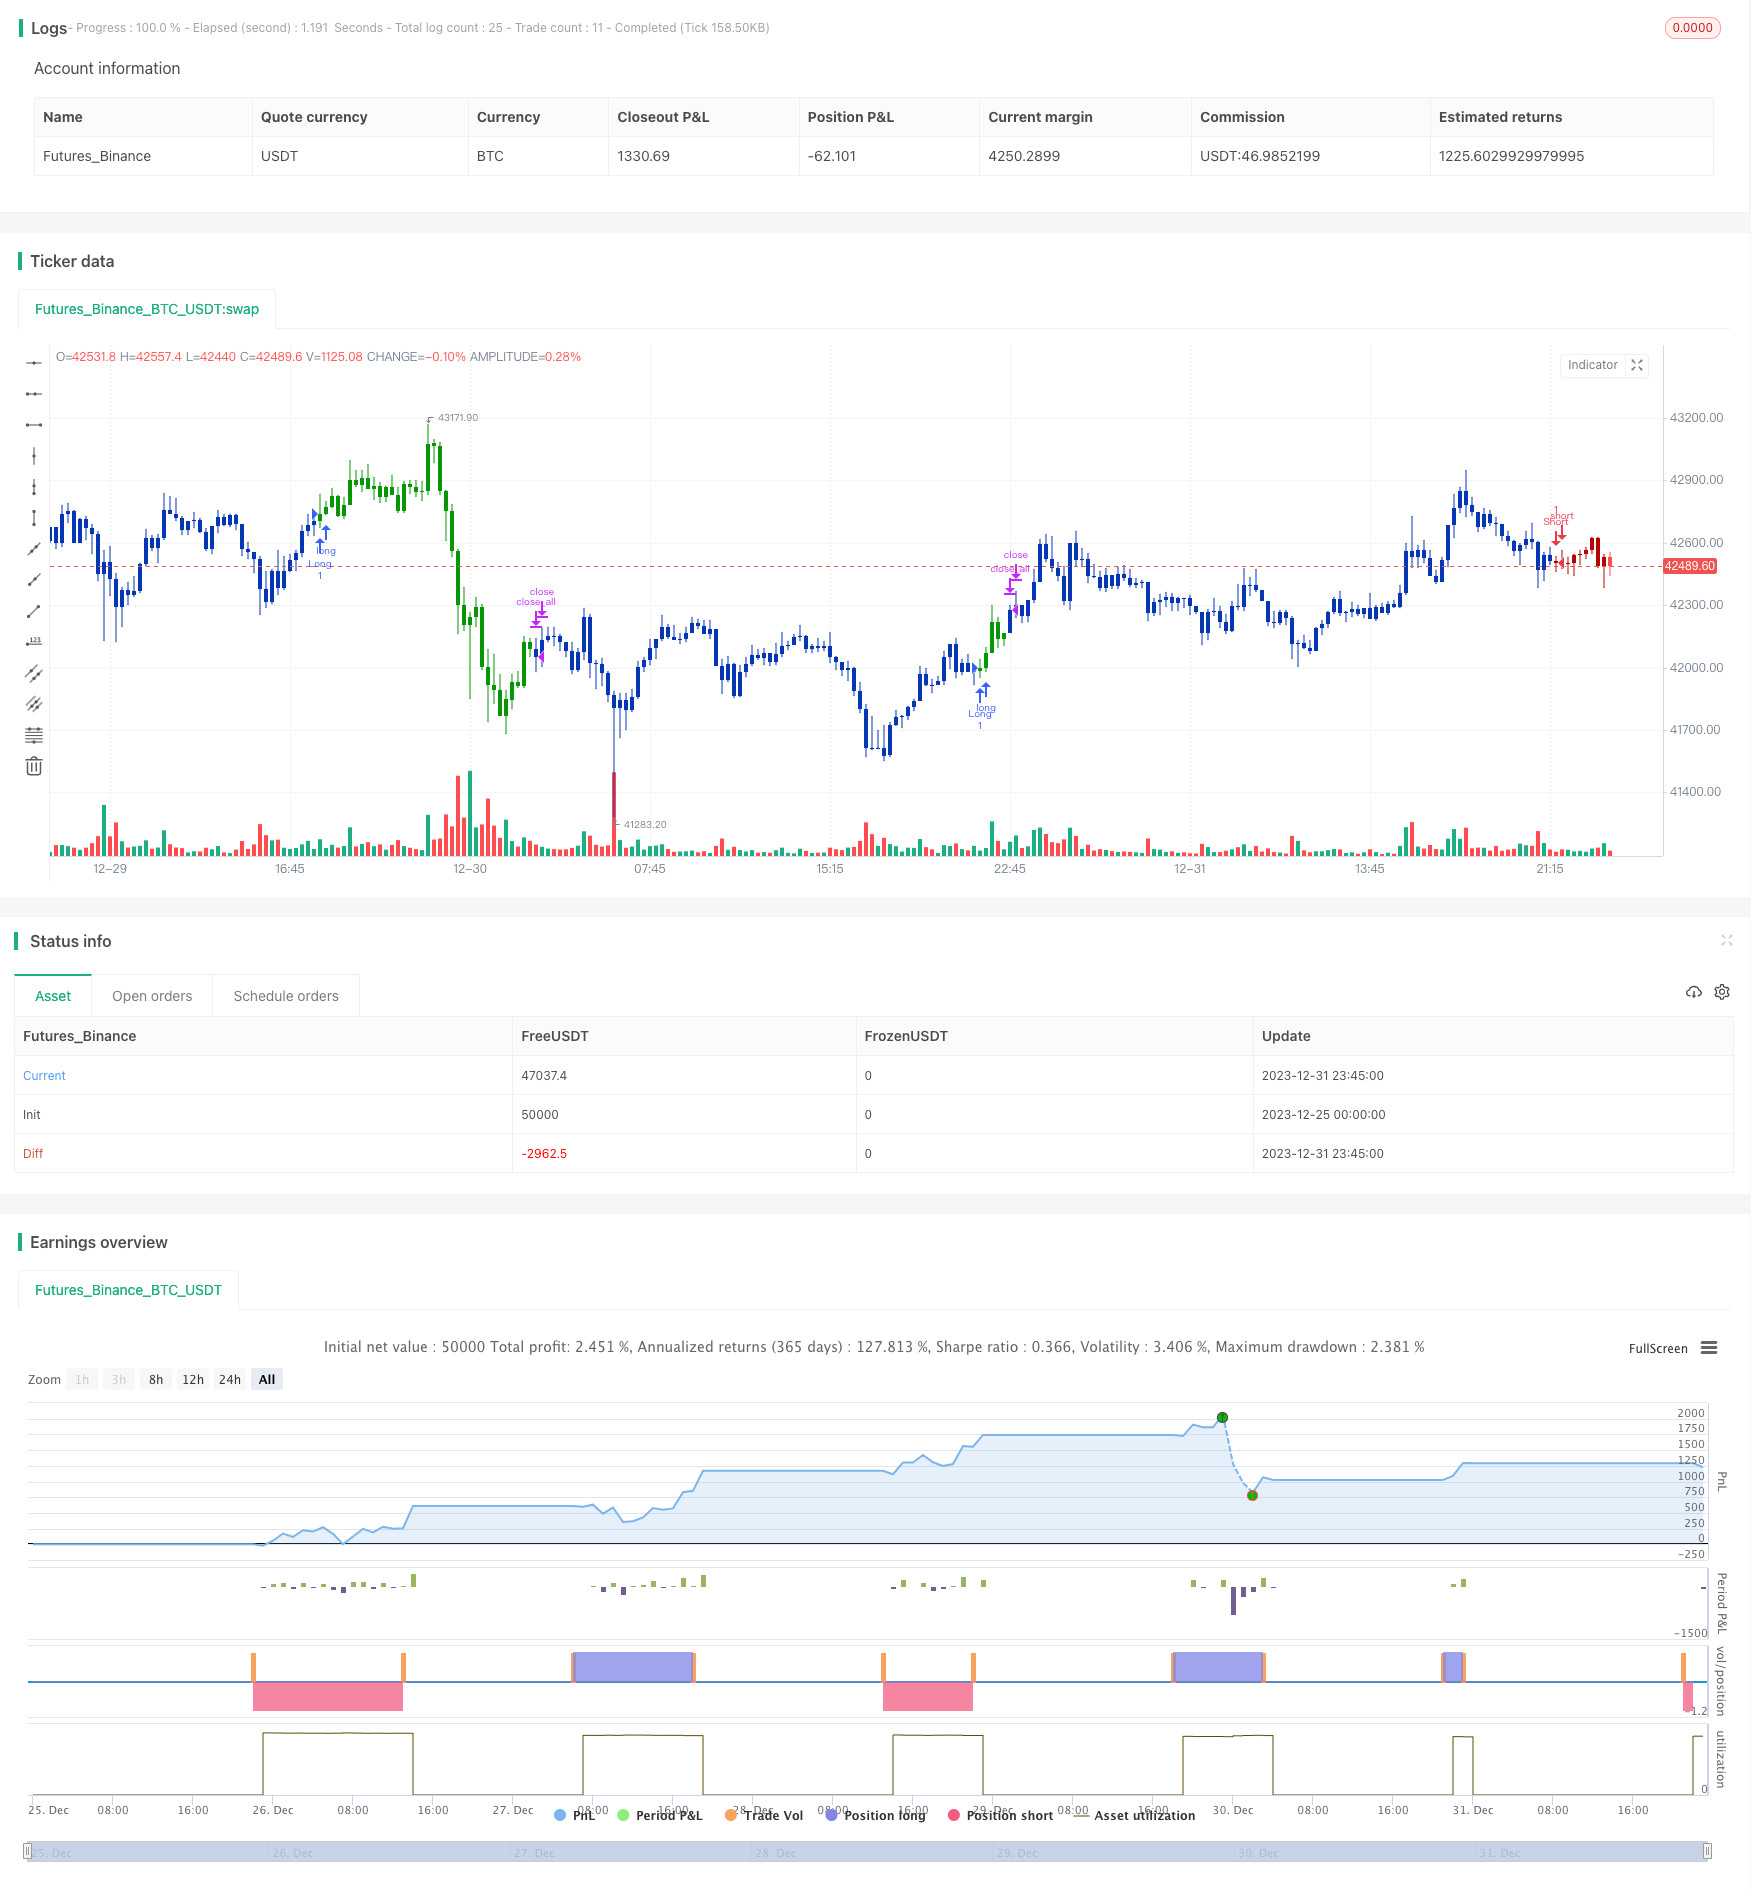
コンボ トレンド トラッキング 戦略
作者: リン・ハーンチャオチャン,日付: 2024-01-02 10:41:30タグ:

概要
コンボトレンド追跡戦略は,トレンドを判断するために二重指標を組み合わせる定量的な取引戦略である.まず,価格逆転シグナルを決定するために123逆転指標を使用し,その後,価格トレンド方向を判断するために方向性トレンドインデックス (DTI) を組み合わせ,二重確認オーダー信号を達成する.
戦略原則
戦略は主に2つの部分から構成されています.
-
123 逆転指数
123 逆転指標の判断原則は以下のとおりである.
-
閉じる価格が2日間連続して上昇し,9日間のスローKラインが50を下回ると,ロングする.
-
閉じる価格が2日間連続して下がり 9日間の速度のK線が50を超えると ショートします
これは価格の逆転のタイミングを把握できます
-
-
方向性傾向指数 (DTI)
DTI指標の判断原理は,一定期間における絶対価格変動の移動平均を計算し,それを平均価格変動で割る.
-
DTIが過買い線より高くなると,現在の傾向は下がる.
-
DTIが過売線を下回ると 上昇傾向になります
-
-
組み合わせ
まず 123 逆転指標を使用して,価格逆転信号が発生するかどうかを判断します.その後,DTI インディケーターと組み合わせて,逆転後の全体的なトレンド方向を決定します.
これは,逆転信号のみに頼ることで引き起こされる誤った逆転の問題を回避し,戦略の安定性と収益性を向上させる.
利点
-
二重指標の確認は,誤った逆転によるリスクを回避する
-
逆転と傾向を組み合わせることで 運用の柔軟性と安定性のバランスをとれる
-
大きなパラメータ最適化スペース,異なる品種に適応するために柔軟に調整することができます
リスク分析
-
DTIパラメータを設定するには経験が必要で,不適切な傾向の方向を誤って判断する
-
逆転は必ずしも新しい傾向を表すのではなく,範囲限定の振動がある可能性があります.
-
単一の損失を制御するために有効なストップ損失が必要
解決策:パラメータ最適化テスト + 合理的なストップ損失 + 他の指標の組み合わせ
最適化方向
-
最適なパラメータ組み合わせを見つけるために DTI パラメータをテストする
-
誤った逆転信号をフィルタリングするために他の指標を使用
-
ストップ・ロスの戦略を最適化し,最適なストップ・ロスのポイントを見つける
概要
コンボトレンド追跡戦略は,価格逆転の重要性を効果的に決定し,123の逆転とDTIの二重確認を通じて新しいトレンド方向を把握し,それによって戦略の収益性を向上させます.しかし,パラメータ設定とストップ損失戦略は,戦略の利益空間を最大化するために継続的なテストと最適化が必要です.全体的に見ると,トレンド取引と逆転取引の利点を組み合わせることで,これは推奨する価値のある定量戦略です.
/*backtest
start: 2023-12-25 00:00:00
end: 2024-01-01 00:00:00
period: 15m
basePeriod: 5m
exchanges: [{"eid":"Futures_Binance","currency":"BTC_USDT"}]
*/

//@version=4
////////////////////////////////////////////////////////////
//  Copyright by HPotter v1.0 19/02/2020
// This is combo strategies for get a cumulative signal.
//
// First strategy
// This System was created from the Book "How I Tripled My Money In The
// Futures Market" by Ulf Jensen, Page 183. This is reverse type of strategies.
// The strategy buys at market, if close price is higher than the previous close
// during 2 days and the meaning of 9-days Stochastic Slow Oscillator is lower than 50.
// The strategy sells at market, if close price is lower than the previous close price
// during 2 days and the meaning of 9-days Stochastic Fast Oscillator is higher than 50.
//
// Second strategy
// This technique was described by William Blau in his book "Momentum,
// Direction and Divergence" (1995). His book focuses on three key aspects
// of trading: momentum, direction and divergence. Blau, who was an electrical
// engineer before becoming a trader, thoroughly examines the relationship between
// price and momentum in step-by-step examples. From this grounding, he then looks
// at the deficiencies in other oscillators and introduces some innovative techniques,
// including a fresh twist on Stochastics. On directional issues, he analyzes the
// intricacies of ADX and offers a unique approach to help define trending and
// non-trending periods.
// Directional Trend Index is an indicator similar to DM+ developed by Welles Wilder.
// The DM+ (a part of Directional Movement System which includes both DM+ and
// DM- indicators) indicator helps determine if a security is "trending." William
// Blau added to it a zeroline, relative to which the indicator is deemed positive or
// negative. A stable uptrend is a period when the DTI value is positive and rising, a
// downtrend when it is negative and falling.
//
// WARNING:
// - For purpose educate only
// - This script to change bars colors.
////////////////////////////////////////////////////////////
Reversal123(Length, KSmoothing, DLength, Level) =>
    vFast = sma(stoch(close, high, low, Length), KSmoothing)
    vSlow = sma(vFast, DLength)
    pos = 0.0
    pos := iff(close[2] < close[1] and close > close[1] and vFast < vSlow and vFast > Level, 1,
	         iff(close[2] > close[1] and close < close[1] and vFast > vSlow and vFast < Level, -1, nz(pos[1], 0)))
	pos

TDI(r,s,u,OS,OB) =>
    pos = 0.0
    xHMU = iff(high - high[1] > 0, high - high[1], 0)
    xLMD = iff(low - low[1] < 0, -(low - low[1]), 0)
    xPrice = xHMU - xLMD
    xPriceAbs = abs(xPrice)
    xuXA = ema(ema(ema(xPrice, r),s),u)
    xuXAAbs = ema(ema(ema(xPriceAbs, r),s),u)
    Val1 = 100 * xuXA
    Val2 = xuXAAbs
    DTI = iff(Val2 != 0, Val1 / Val2, 0)
    pos := iff(DTI > OS, -1,
    	     iff(DTI < OB, 1, nz(pos[1], 0)))
    pos

strategy(title="Combo Backtest 123 Reversal & Directional Trend Index (DTI)", shorttitle="Combo", overlay = true)
Length = input(14, minval=1)
KSmoothing = input(1, minval=1)
DLength = input(3, minval=1)
Level = input(50, minval=1)
//-------------------------
r = input(14, minval=1)
s = input(10, minval=1)
u = input(5, minval=1)
OS = input(45, minval=1)
OB = input(-45, maxval=-1)
reverse = input(false, title="Trade reverse")
posReversal123 = Reversal123(Length, KSmoothing, DLength, Level)
posTDI = TDI(r,s,u,OS,OB)
pos = iff(posReversal123 == 1 and posTDI == 1 , 1,
	   iff(posReversal123 == -1 and posTDI == -1, -1, 0))
possig = iff(reverse and pos == 1, -1,
          iff(reverse and pos == -1 , 1, pos))
if (possig == 1)
    strategy.entry("Long", strategy.long)
if (possig == -1)
    strategy.entry("Short", strategy.short)
if (possig == 0)
    strategy.close_all()
barcolor(possig == -1 ? #b50404: possig == 1 ? #079605 : #0536b3 )
- 日々の脱出戦略
- 定量取引に基づくシグナル対ノイズ移動平均取引戦略
- モメントクロスオーバー 移動平均値とMACDフィルター ハイキン・アシ・キャンドルスタイク戦略
- 複数の相対強度指標の合成戦略
- ランダムフィッシャー変換 一時停止 逆STOCH指標 定量戦略
- アダプティブ・ストップ・ロスト・レール・戦略
- ボリンジャー・バンド 量確認 量的な取引戦略
- パラメータ最適化傾向 定量戦略
- ベガス・チャンネル・クロスオーバー戦略を動かす
- 動的移動平均値に基づく戦略をフォローする傾向
- 移動平均のクロスオーバー戦略の9種類
- ビナインOKX 永続的な自動ヘッジ
- 戦略を踏まえて ダイナミックなブレイクアウト傾向
- カルマンフィルターと平均逆転に基づいたトランシティブ比率取引戦略
- 逆線形回帰戦略
- BankNifty スーパートレンド トレーディング戦略
- 臨時地帯戦略
- ストップ・損失を後押しするダブル移動平均戦略
- 複数のタイムフレームのモメンタムブレイク戦略
- ピボットポイント ゴールデン比 高いものを買う 低いものを売る戦略