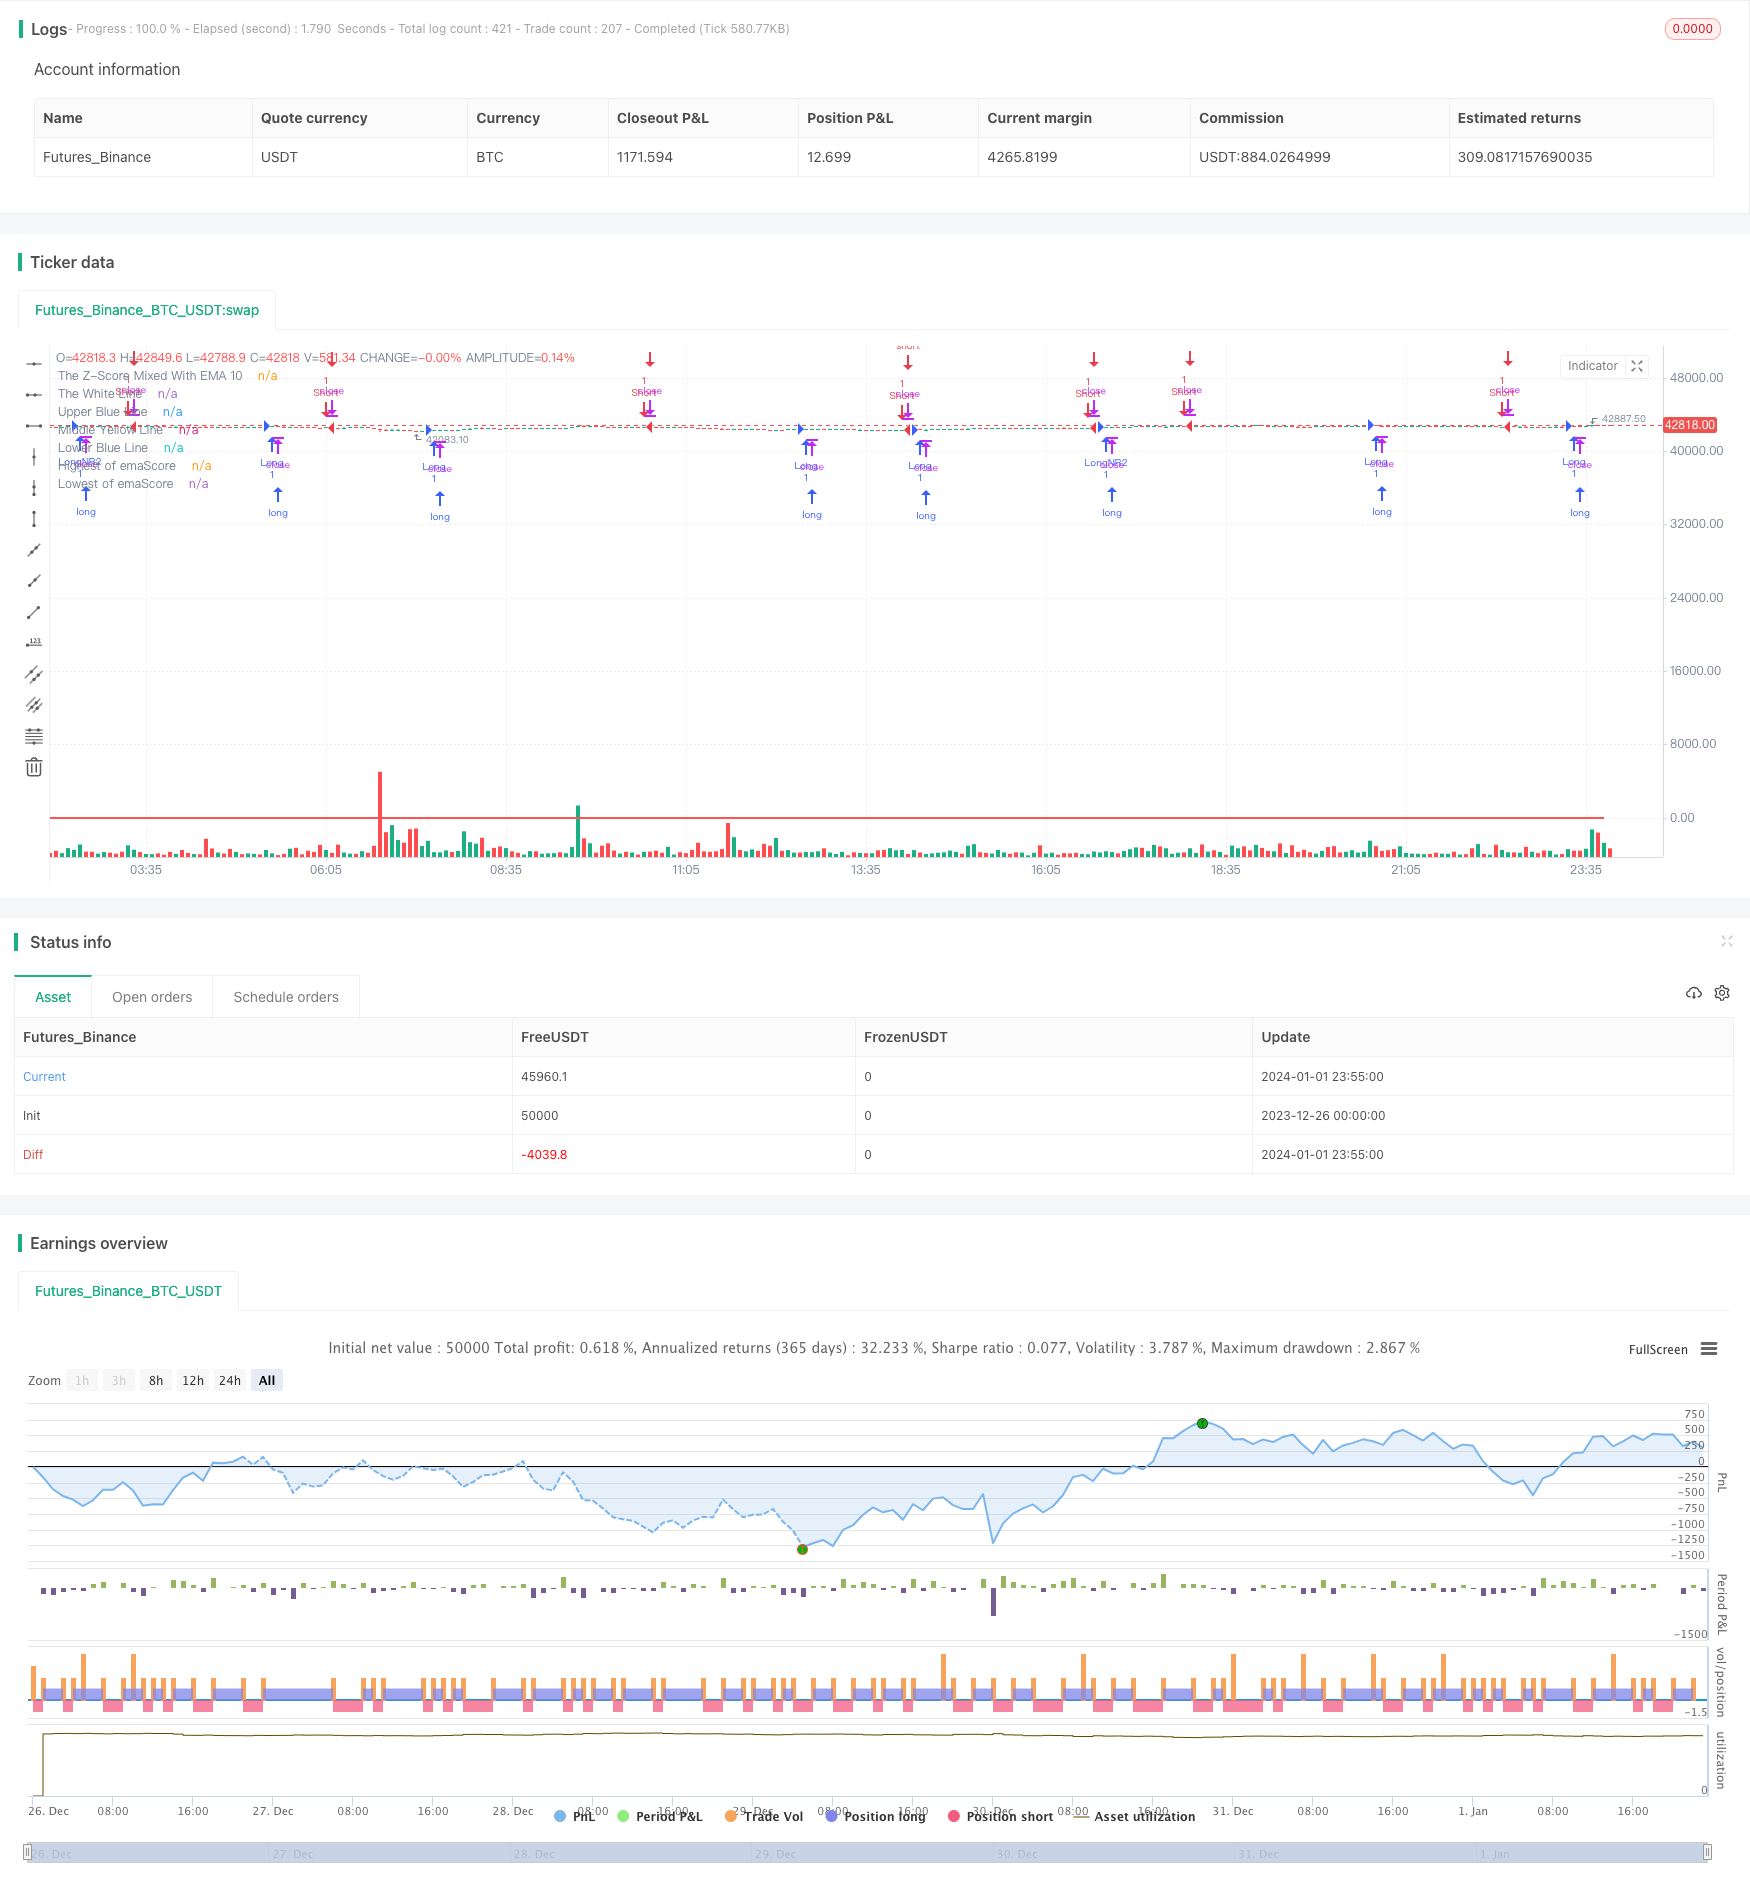
ガウスの移動平均取引戦略
作者: リン・ハーンチャオチャン開催日:2024年1月3日16時06分45秒タグ:

概要
この戦略は,ガウス分布の考え方を適用し,ハイキン・アシのキャンドルストーキンの閉店価格の10期指数的な移動平均値に基づいてZスコアを計算する.その後,曲線がそれらを横断する際に入口と出口信号のZスコアの20期指数的な移動平均値に基づいて
戦略の論理
-
ハイキン・アシ・キャンドルストーキンの閉店価格の10期指数移動平均を計算します.
-
上記の移動平均データに基づいて,25期回顧窓におけるZスコアを計算する.Zスコアは,データポイントが平均値からどのくらい標準偏差しているかを反映し,データが正常か異常かどうかを判断することができます.
-
Zスコアの20期指数関数移動平均を取ると emaScoreと呼ばれる曲線が得られます この曲線は Zスコアの長期トレンドを反映します
-
EmaScore のデータ の分布 を ベース にして 上値 と 下値 を 設定 する.曲線 の 変動 を 考慮 し て,90% と 10% の レベル が 値 値 と し て 選択 さ れ ます.
-
EmaScore が中間線や下限を上向きに突破したときの長さ. emaScore が上向き,下向き,上向き,下向き,100期間の最高値を突破したときの短さ.
利点分析
-
Zスコアを通してガウス分布のアイデアを適用して 正常性を判断し 誤った突破をフィルターします
-
二重指数移動平均は,長期トレンドを決定するフィルタリング効果を持っています.
-
合理的な限界値を設定することで,不正な取引の確率が低下します.
-
100 期間の最高値/最低値を取り入れることで 逆転の機会を捉えるのに役立ちます
リスク分析
-
ZスコアとMAsの組み合わせは パラメータ調整に敏感です 最適化が必要です
-
適切な限界レベルは 戦略の有効性と直接関係しています 幅が幅も狭いかすぎると 失敗します
-
100 期間の最高点/最低点は 簡単に間違った信号を生成することができます. 適正に条件を緩和します.
-
ハイキン・アシ自身も 少し遅れている
オプティマイゼーションの方向性
-
異なる移動平均値の期間,Zスコアバックウィンドウをテストします
-
パラメータを自動最適化するために ウォーク・フォワード・アナリティクスを利用します
-
STD の倍数など 異なる値設定方法を試す.
-
誤った信号を防ぐために最高/最低点の論理を改良する.
-
他のキャンドルタイプや典型的な価格をテストして ヘイキン・アシを入れ替える
概要
この戦略は,価格異常を判断し,ガウス分布,二重指数移動平均値,ダイナミックスロージック設定のアイデアに基づいて取引信号を生成する.主な利点は偽ブレイクをフィルタリングし,逆転を捕捉する.しかし,パラメータ選択と組み合わせに関して大きな影響があります.最良のパラメータと組み合わせを見つけるためにさらなるテストと最適化が必要です.
/*backtest
start: 2023-12-26 00:00:00
end: 2024-01-02 00:00:00
period: 5m
basePeriod: 1m
exchanges: [{"eid":"Futures_Binance","currency":"BTC_USDT"}]
*/


// This source code is subject to the terms of the Mozilla Public License 2.0 at https://mozilla.org/MPL/2.0/
// © jensenvilhelm

// Here is an attempt to create a robust strategy for BTCUSD on a 5 minute chart
// I can't seem to get this code to work the way i want.... if you want to give it a try, please let me know -
// how it goes in comment section.

//@version=5
// Define the strategy settings
strategy("The Z-score", shorttitle="TZS", overlay=true)

// User can set the start date for the strategy
startDate = timestamp("2023 06 01")

// Heikin-Ashi Open, Close, High and Low calculation
haClose = ohlc4
var float haOpen = na
haOpen := na(haOpen[1]) ? (open + close) / 2 : (haOpen[1] + haClose[1]) / 2
haHigh = math.max(nz(haOpen, high), nz(haClose, high), high)
haLow = math.min(nz(haOpen, low), nz(haClose, low), low)

// Function to calculate the Z-Score
z_score(_series, _length) =>
    _mean = ta.sma(_series, _length)
    _stddev = ta.stdev(_series, _length)
    (_series - _mean) / _stddev

// Compute the score and its EMA
score = z_score(ta.ema(haClose, 10), 25)
emaScore = ta.ema(score, 20)

// Calculate lower and upper thresholds using percentiles of EMA
lowerBlue = ta.percentile_linear_interpolation(emaScore, 50, 10)
upperBlue = ta.percentile_linear_interpolation(emaScore, 50, 90)

// Calculate the middle line as 50th percentile
middleLine = ta.percentile_linear_interpolation(emaScore, 50, 50)

// Plot the EMA of the score and the thresholds
plot(emaScore,"The White Line", color=color.white, linewidth=2)
plot(lowerBlue,"Lower Blue Line", linewidth=2)
plot(upperBlue, "Upper Blue Line", linewidth=2)
plot(middleLine, "Middle Yellow Line", linewidth=2, color=color.yellow)
plot(score,"The Z-Score Mixed With EMA 10", color=color.green)

// Calculate highest and lowest EMA score over 100 bars period
highest = ta.highest(emaScore, 100)
lowest = ta.lowest(emaScore, 100)

// Plot highest and lowest EMA score lines
plot(highest, "Highest of emaScore", color=color.red, linewidth=2)
plot(lowest, "Lowest of emaScore", color=color.red, linewidth=2)

// Define entry and exit conditions for long and short positions
longCon = ta.crossover(score, lowerBlue) or ta.crossover(emaScore, middleLine)
addOn = ta.crossover(score, highest)
shortCon = ta.crossunder(emaScore, upperBlue) or ta.crossunder(emaScore, lowerBlue) or ta.crossunder(emaScore, highest)

// Execute trading logic based on conditions and after the start date
if (time >= startDate)
    if longCon
        strategy.entry("Long", strategy.long)
        if shortCon
            strategy.close("Long")
    if addOn
        strategy.entry("LongNR2", strategy.long)
        if shortCon
            strategy.close("LongNR2")

    if shortCon
        strategy.entry("Short", strategy.short)
        if longCon
            strategy.close("Short")
- 多重戦略に基づく反転と重力中心統合取引戦略
- 2倍と3倍指数関数移動平均のクロスオーバー戦略
- ボリンジャー・バンドス ブレイク・スウィング・トレーディング・戦略
- トレンド追跡逆転戦略
- AlexIncのバー v1.2 意義あるバーフィルタリングに基づくブレイアウト蓄積戦略
- 指数関数移動平均をトレイルストップ損失と百分比ストップ損失と組み合わせる株式量取引戦略
- 移動平均のクロスオーバーシステム
- 閉じる 購入 次の オープン 利益 戦略
- ストップ損失追跡戦略を移動する
- Gann Me 分析指標に基づく短期トレンド追跡戦略
- アダプティブ・カウフマン 移動平均 トレンド 戦略
- バンドパスフィルタリングトレンド抽出戦略
- 二重逆転高低戦略
- ハイピング 移動平均トレンド戦略
- マルチタイムフレーム移動平均値とMACDをベースとした長期・短期開拓戦略
- モメント インディケーター RSI リバーサル 取引戦略
- ダブル・ボリンジャー・バンド・ブレークアウト戦略
- T3とATRをベースにした自動トレンド追跡戦略
- ATRチャンネルブレイク トレンドフォロー戦略
- MACD 200 日間移動平均クロスオーバー取引戦略