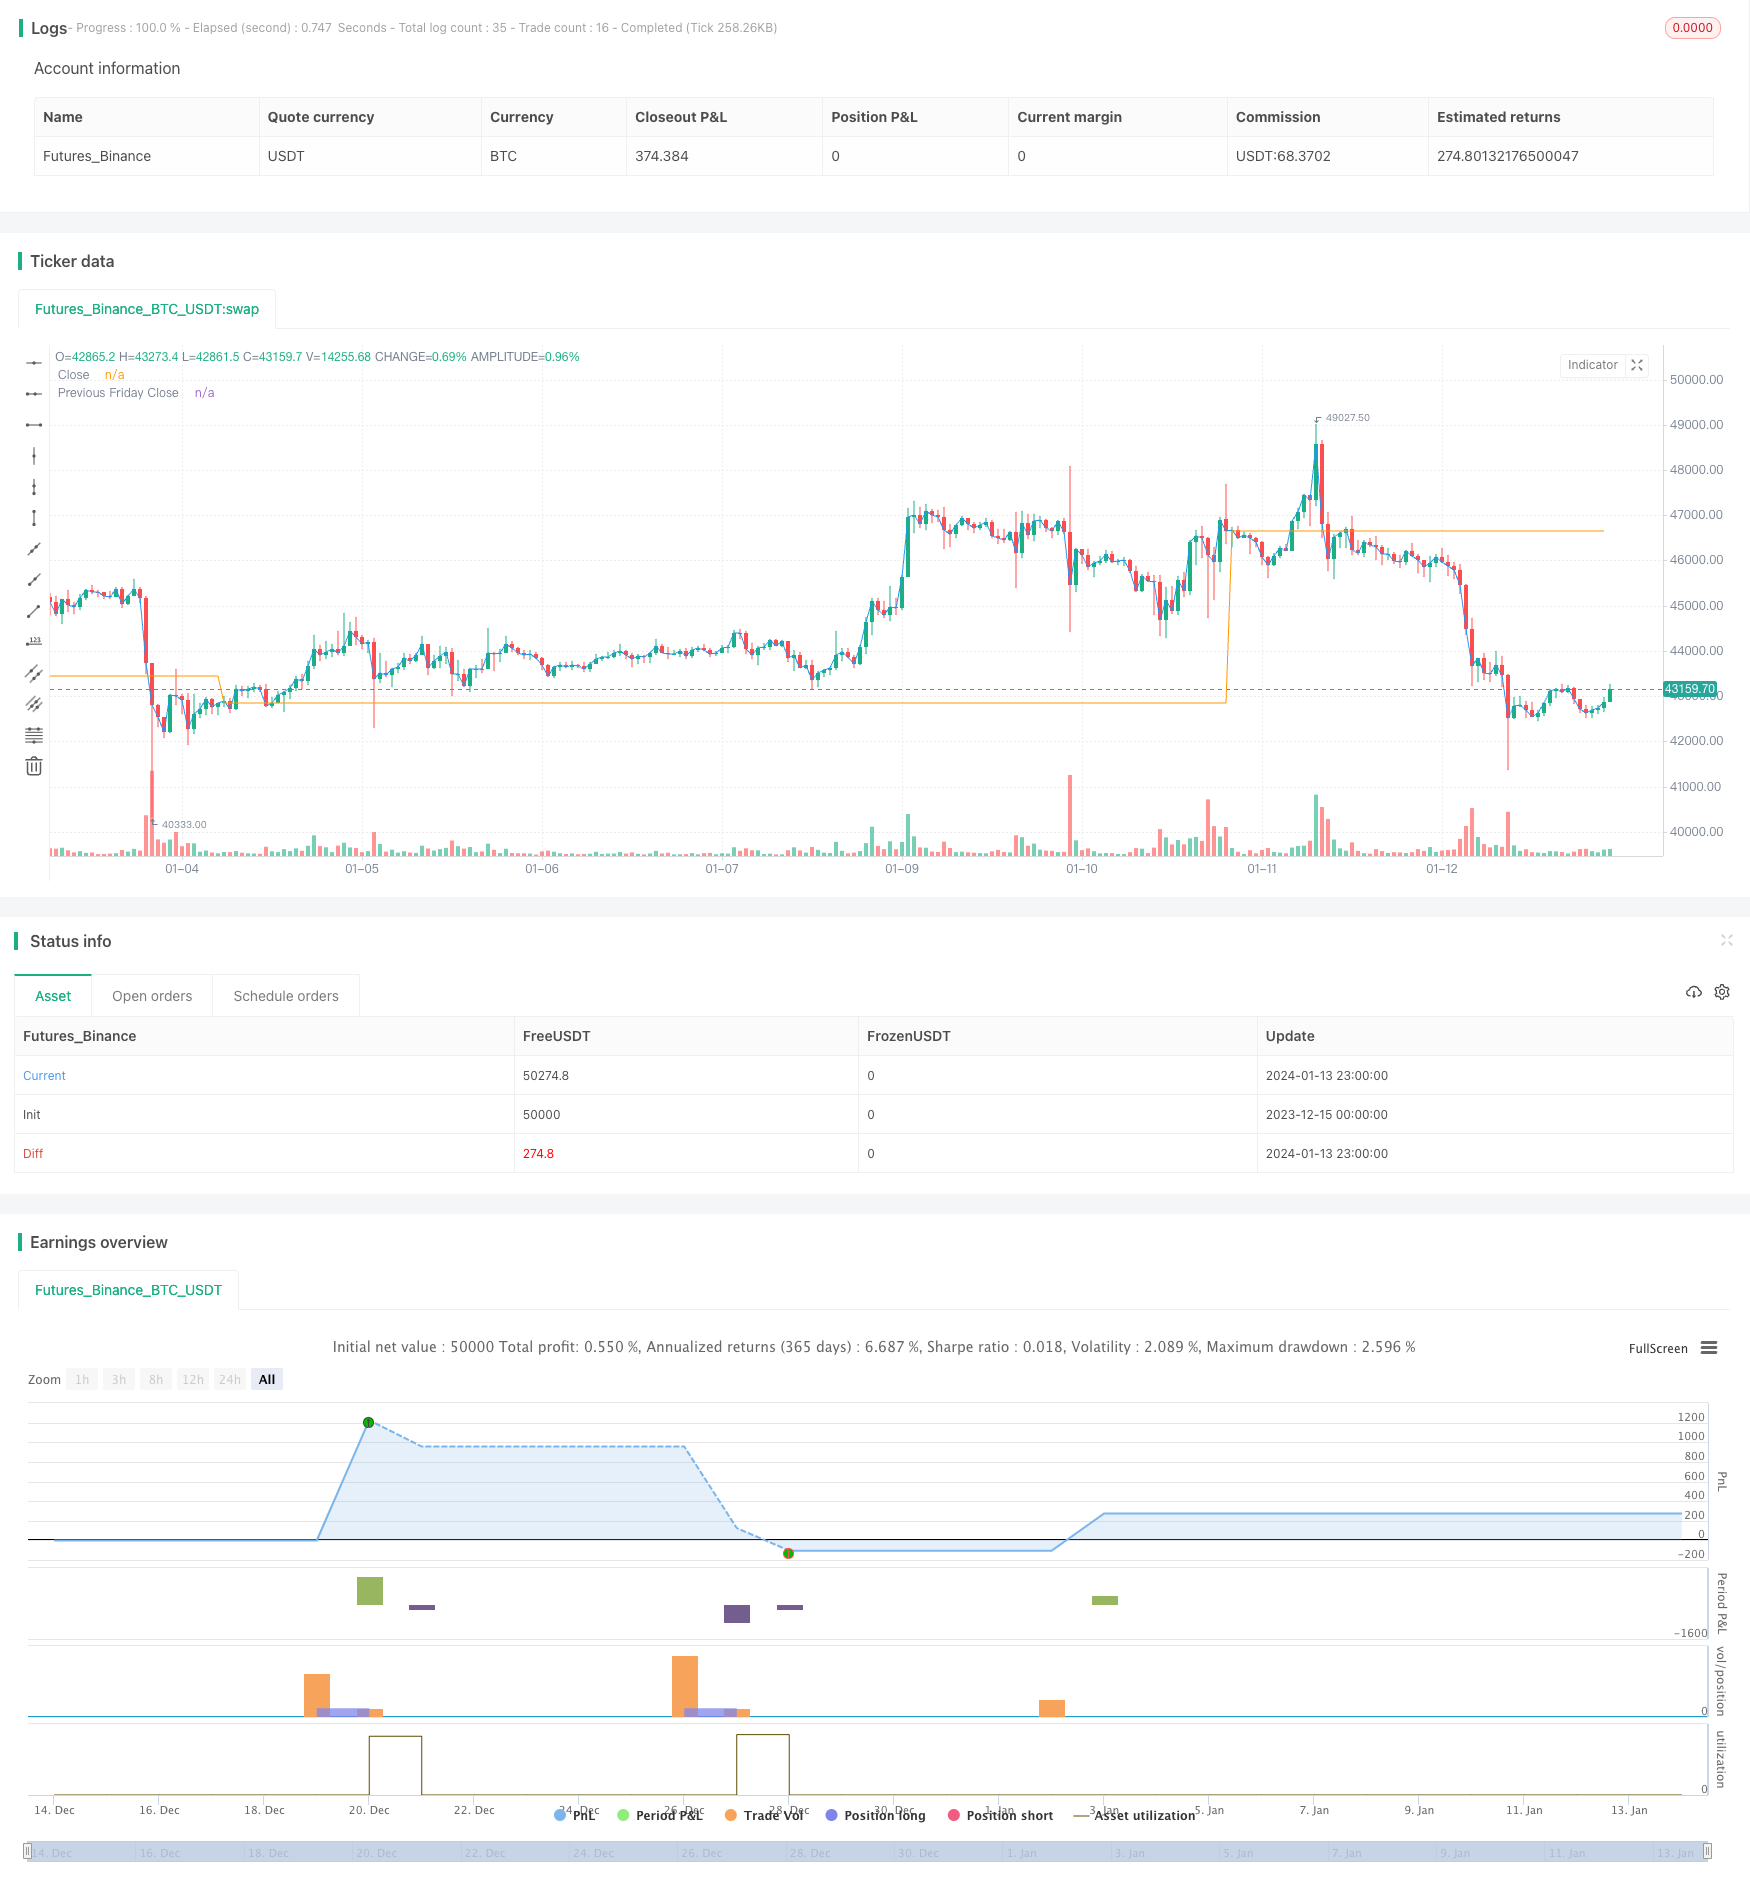
IBSと週間の高ベースSP500先物取引戦略
作者: リン・ハーンチャオチャン開催日:2024年1月15日 14:42:00タグ:

概要
これは,日内波動指数 IBS と週間の高値に基づいたシンプルなSP500先物取引戦略である. 入場タイミングを決定するために,IBS の 0.5 以下の条件と前金曜日より低い価格を使用して,月曜日の開業日にのみ取引信号を送信する. 5 取引日後に終了する.
戦略原則
戦略は主に2つの指標に基づいて判断します.
-
IBS - Intraday Breadth Strength,日中の変動が十分に低いかどうかを判断するために使用される.計算方法は: (近 - 低) / (高 - 低). IBS が0.5以下であるとき,変動が低いと考えられ,入力に適しています.
-
週高値 - 先週の金曜日の閉店を基準高値として使用します.この月曜日の閉店が先週の金曜日の閉店より低い場合,逆転を形成し,取引機会を生む可能性があります.
入場条件は:月曜日 + IBS <0.5 + 閉店 < 前金曜日 閉店.
出口条件は,5日以内に閉じるか,翌日に高値逆転を開ける.
戦略 の 利点
この戦略の主な利点は以下の通りです.
- 戦略の論理は シンプルで明快で 分かりやすく実行できます
- 月曜の営業日だけシグナルを発行できます 過剰な取引を避けます
- 日中の変動を判断するために IBS インディケーターを使用します.これはトレンドの転換点をロックするのに良いです.
- 週構造参照は,逆転が形成されているかどうかを判断するのに単純で有効です.
- リスク管理は 限られた利用率で実施されています
戦略リスク
この戦略にはいくつかのリスクもあります:
- IBSと週額構造判断は,技術指標のみをベースにしており,誤った判断を引き起こす可能性があります.
- 固定された5日間の退出時間は,追加の利益や損失をもたらす可能性があります.動的退出条件を設定する必要があります.
- 月曜日のみの取引は 強いサイクルがあり 信号頻度が少ないので 他のタイミングで 簡単に信号を 見逃します
- 抽出管理が不十分で,最大抽出が過剰である可能性があります.
戦略の最適化
戦略は以下の側面で最適化できます.
-
信号の精度を向上させるための技術指標の確認を増やす.例えば短期トレンド,サポート/レジスタンス,ボリューム,その他の判断論理の強化など.
-
ストップ・ロストまたはテイク・プロフィート価格を設定するために,リアルタイム変動に基づいて動的退出条件を設定します.固定退出時間による追加の利益/損失を回避します.
-
戦略の取引時間枠を月曜日に限定するのではなく拡大します.信号のカバーを改善するために他の取引日へのエントリー条件を合理的に設定します.
-
ストップ損失戦略を使用して引き下げを制御するためのリスク管理モジュールを導入する.浮遊ストップ損失,トレーリングストップ損失などの方法が最適化するために使用できます.
結論
一般的には,この戦略は,日内IBS指標と週間の構造判断に基づく簡単な短期取引戦略である.戦略の考え方は明確で,制御可能なリスクで実行しやすい.しかし,信号の誤判と潜在的な過度のデバッグ問題の確率はある.将来の最適化空間は,より多くの技術指標を追加し,動的なストップロスのメカニズムを設定し,その他にある.継続的にテストと最適化することで,戦略の勝利率と収益性を徐々に改善する.
/*backtest
start: 2023-12-15 00:00:00
end: 2024-01-14 00:00:00
period: 1h
basePeriod: 15m
exchanges: [{"eid":"Futures_Binance","currency":"BTC_USDT"}]
*/

// This source code is subject to the terms of the Mozilla Public License 2.0 at https://mozilla.org/MPL/2.0/
// © hobbiecode

// Today is Monday.
// The close must be lower than the close on Friday.
// The IBS must be below 0.5.
// If 1-3 are true, then enter at the close.
// Sell 5 trading days later (at the close).

//@version=5
strategy("Hobbiecode - SP500 IBS + Higher", overlay=true)

// Check if it's Monday
isMonday = dayofweek(time) == dayofweek.monday

// Calculate the IBS (Intraday Breadth Strength) indicator
ibs = (close - low) / (high - low)

// Calculate the close on the previous Friday
prevFridayClose = request.security(syminfo.tickerid, "W", close[1])

// Entry conditions
enterCondition = isMonday and close < prevFridayClose and ibs < 0.5 and strategy.position_size < 1

// Exit conditions
exitCondition = (close > high[1] or ta.barssince(enterCondition) == 4) and strategy.position_size > 0

// Entry signal
if enterCondition
    strategy.entry("Buy", strategy.long)

// Exit signal
if exitCondition
    strategy.close("Buy")

// Plotting the close, previous Friday's close, and entry/exit points on the chart
plot(close, title="Close", color=color.blue)
plot(prevFridayClose, title="Previous Friday Close", color=color.orange)
plotshape(enterCondition, title="Enter", location=location.belowbar, color=color.green, style=shape.labelup, text="Enter")
plotshape(exitCondition, title="Exit", location=location.abovebar, color=color.red, style=shape.labeldown, text="Exit")
- RMI トレンドシンクロ戦略
- マルチタイムフレームMACD移動平均取引戦略
- ADX ダイナミックトレンド戦略
- トレンド フォロー 戦略 ハルスの移動平均値と真の範囲をベースに
- 双重確認量取引戦略
- divergence 戦略の確認
- ボリンジャー・ウェーブ戦略
- Myo_LS_D 定量戦略
- 複素移動平均 双方向取引戦略
- ドンチアン・チャネル 戦略を踏まえて長期的動向
- FRAMA指標に基づくFRAMAとMAのクロスオーバー取引戦略
- SSLベースラインに基づいた戦略をフォローする傾向
- ボリンジャー・バンドのトレンド 戦略をフォローする
- トレーディング戦略に続く動力傾向
- オープン 閉じる クロス 移動平均 トレンド ストラテジーをフォロー
- 戦略をフォローする適応傾向
- 複数のタイムフレームのRSI戦略
- ボリンジャーバンドとK線組み合わせ戦略
- Aroon オシレーターに基づく株式取引戦略
- EintSimple リターン戦略