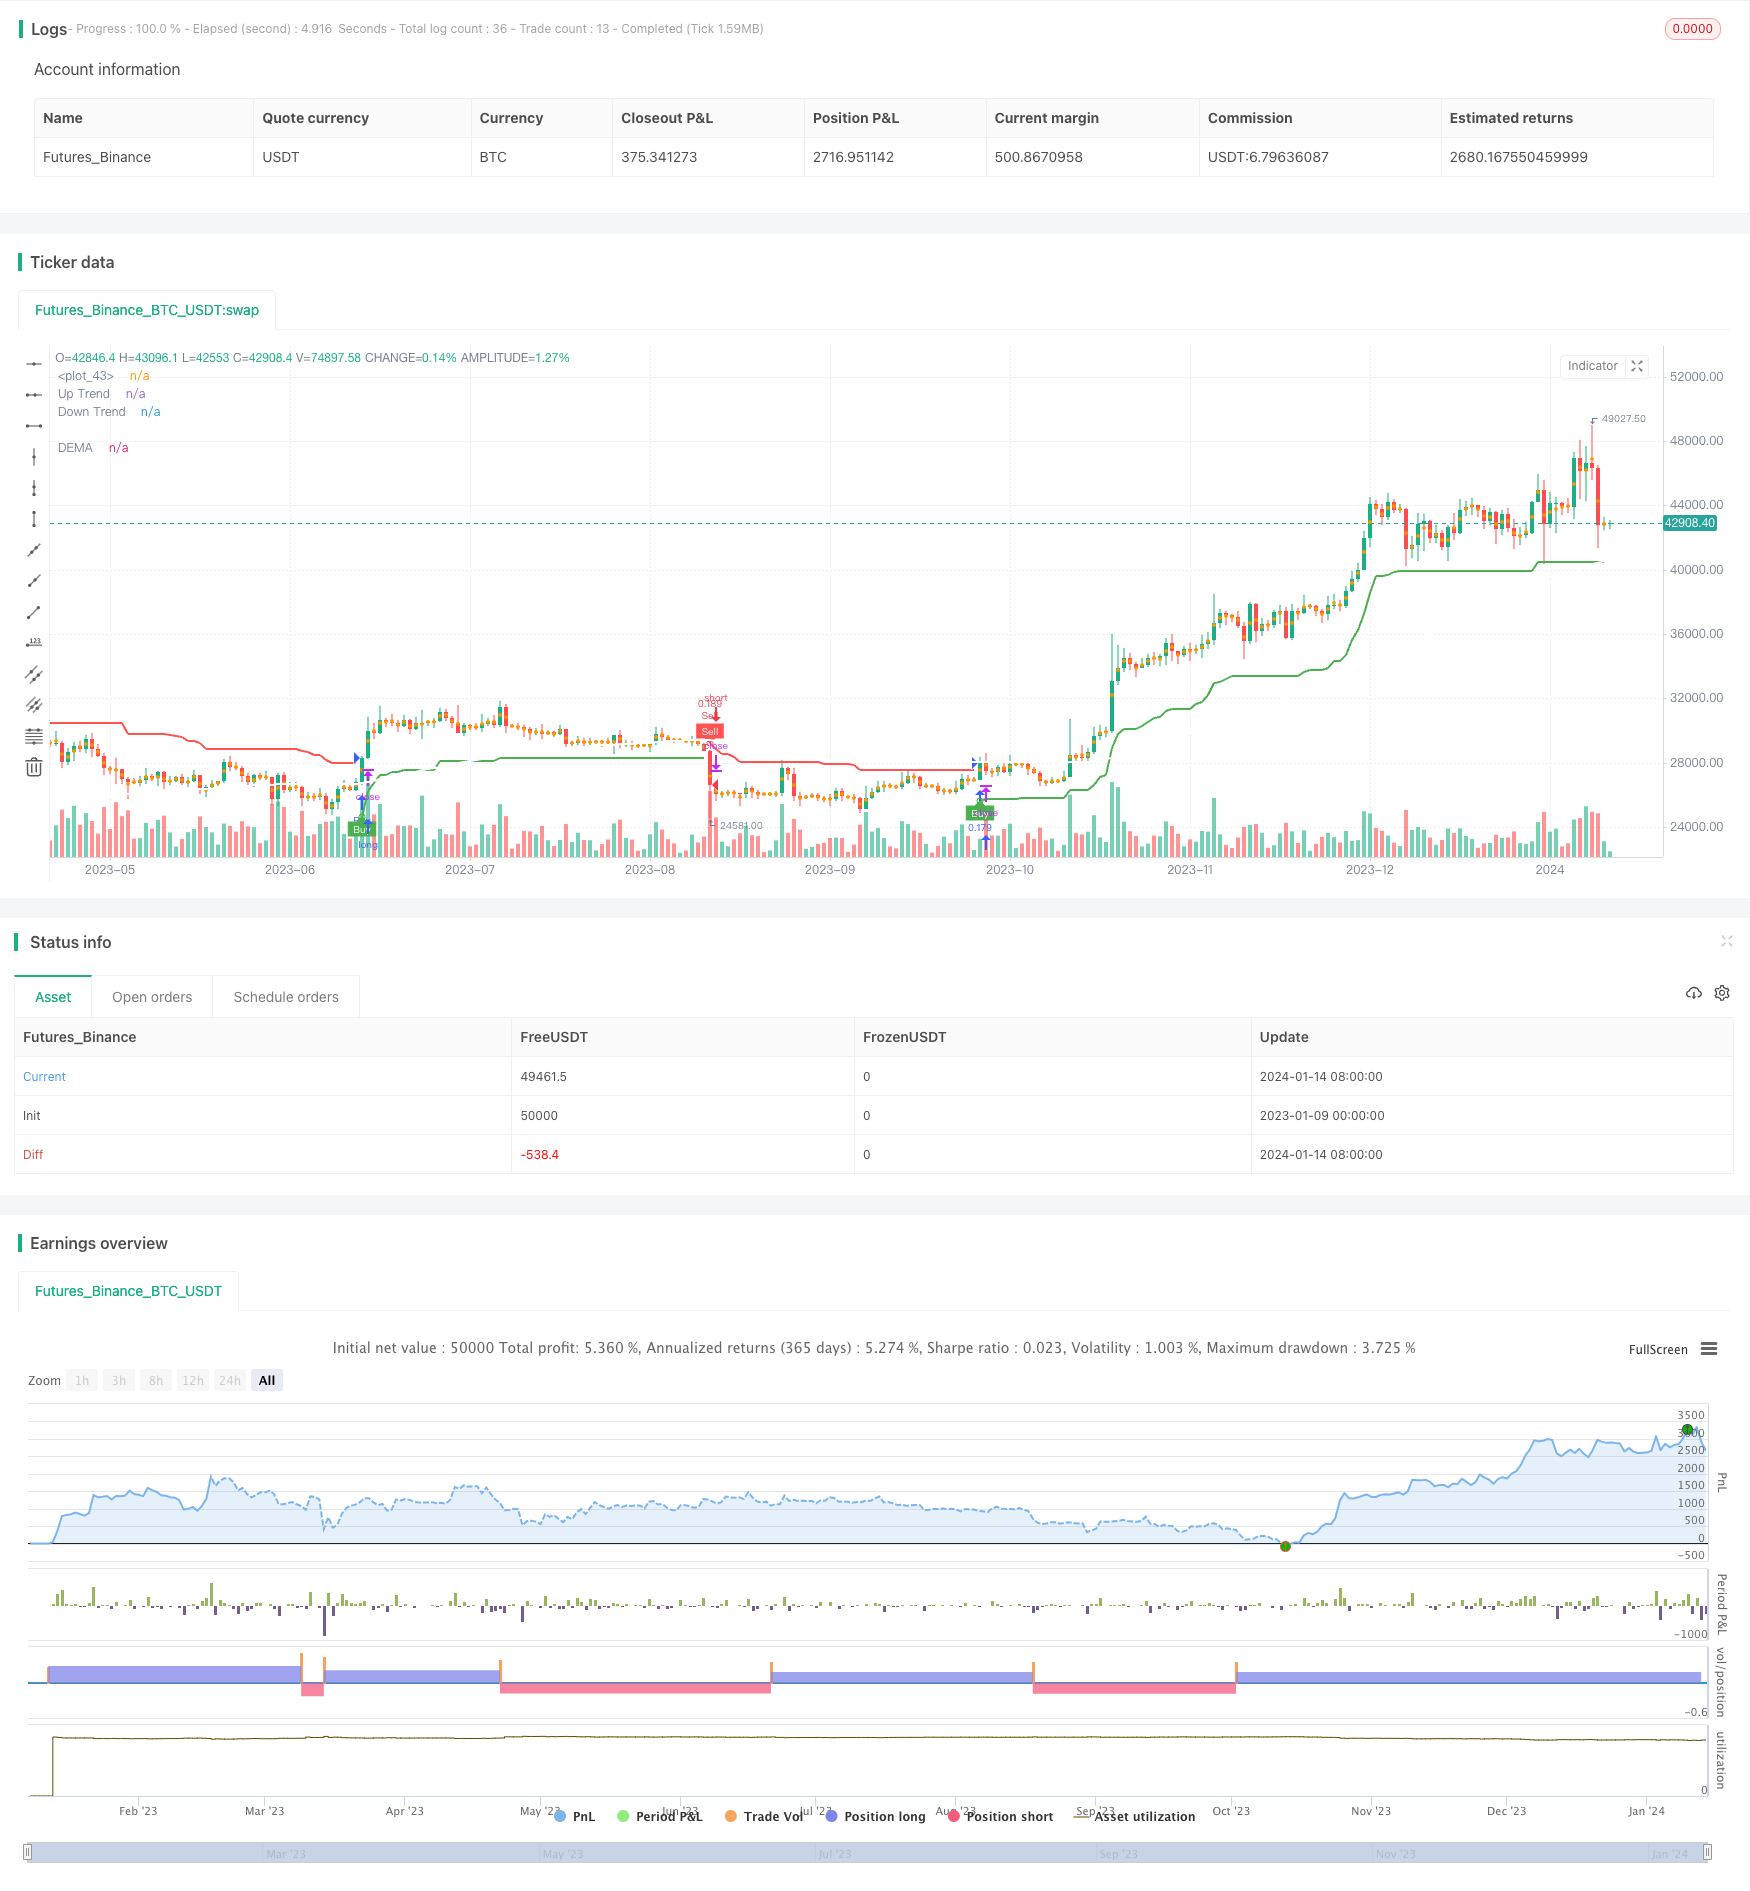
双重トレンド追跡戦略
作者: リン・ハーンチャオチャン開催日:2024年01月16日15時03分55秒タグ:

概要
デュアルトレンド追跡戦略は,スーパートレンド指標,ダブル指数指数移動平均値 (DEMA) とボリンジャー帯を組み合わせた複合戦略である.複数の技術指標の利点を活用することで,トレンドが逆転するときに購入・売却信号を間に合うようにすることを目的としている.
戦略の論理
戦略は主に3つの部分で構成されています.
-
スーパートレンドインジケーター:現在のトレンド方向を決定するために上向きブレイクラインと下向きブレイクラインを計算する.価格がスーパートレンドラインから上向きにブレイクしたときの購入信号,価格が下向きにブレイクしたときの販売信号を生成する.
-
ダブル指数関数移動平均 (DEMA): 単純な移動平均と指数関数移動平均の特徴を組み合わせたトレンド追跡指標で,価格変動により早く反応することができる.この戦略は,長期的トレンド方向を判断するために200日間のDEMAを設定する.
-
ボリンジャーバンド: 価格の変動範囲を表す.ボリンジャーバンドの異常な収縮または拡大は,潜在的なトレンド逆転を示唆する.
Supertrend インディケーターとDEMAが両方とも買/売シグナルを発行すると,戦略は対応するポジションに入ります.また,ボリンジャーバンドの異常は補助判断信号として機能することができます.
利点
-
複数の指標を組み合わせることで 誤った信号が減少します
-
スーパートレンドインジケーターは,わずかな価格変動に敏感ではなく,トレンドのターニングポイントでのみシグナルを生成し,過剰な取引頻度を避ける.
-
DEMAの滑らかな曲線は 長期的な傾向を正確に信頼的に判断します
-
ボリンジャー帯は 傾向の逆転点を決定するのに役立ちます
リスク と 解決策
-
過度に敏感なスーパートレンドパラメータはより多くのノイズを生む可能性があります. ATR期間と倍数パラメータを最適化することで改善できます.
-
長期間のDEMAは 低傾向の追跡能力を生み出します 100日という短い期間をテストできます
-
複数の指標の判断を組み合わせるときに不一致な信号.この場合,スーパートレンドインジケーターは主要な信号とみなすことができます.
オプティマイゼーションの方向性
-
異なるATR期間とマルチプリキュータパラメータをテストして,スーパートレンド指標の最適な組み合わせを見つけます.
-
DEMA 期間パラメータを最適化
-
KDJ,MACDなどの他の補助指標を追加します.
-
ストップ・ロスの戦略を導入する
概要
デュアルトレンドトラッキング戦略は,複数の指標を使用してスーパートレンド,DEMA,ボリンジャー帯の強みを組み合わせ,トレンドを把握しながら信号品質を改善する.パラメータ最適化やストップロスのメカニズムを追加することで,さらなるパフォーマンス改善が期待できる.
/*backtest
start: 2023-01-09 00:00:00
end: 2024-01-15 00:00:00
period: 1d
basePeriod: 1h
exchanges: [{"eid":"Futures_Binance","currency":"BTC_USDT"}]
*/

//@version=4
strategy("Supertrend + DEMA + Bollinger Bands", overlay=true, default_qty_type=strategy.percent_of_equity, default_qty_value=10, precision=2)

// Input parameters for Supertrend
atrLength = input(title="ATR Period", type=input.integer, defval=12)
src = input(hl2, title="Source")
multiplier = input(title="ATR Multiplier", type=input.float, step=0.1, defval=3.0)
changeATR = input(title="Change ATR Calculation Method?", type=input.bool, defval=true)
showSupertrend = input(title="Show Supertrend Indicator?", type=input.bool, defval=true)

// Input parameters for DEMA
demaLength = input(200, title="DEMA Period")
showDEMA = input(title="Show DEMA Indicator?", type=input.bool, defval=true)

// Calculate ATR for Supertrend
atr2 = sma(tr, atrLength)
atr = changeATR ? atr(atrLength) : atr2

// Calculate Supertrend
up = src - (multiplier * atr)
up1 = nz(up[1], up)
up := close[1] > up1 ? max(up, up1) : up

dn = src + (multiplier * atr)
dn1 = nz(dn[1], dn)
dn := close[1] < dn1 ? min(dn, dn1) : dn

trend = 1
trend := nz(trend[1], trend)
trend := trend == -1 and close > dn1 ? 1 : trend == 1 and close < up1 ? -1 : trend

// Plot Supertrend
upPlot = plot(showSupertrend ? (trend == 1 ? up : na) : na, title="Up Trend", style=plot.style_linebr, linewidth=2, color=color.new(color.green, 0))
buySignal = trend == 1 and trend[1] == -1
plotshape(buySignal ? up : na, title="UpTrend Begins", location=location.absolute, style=shape.circle, size=size.tiny, color=color.new(color.green, 0))
plotshape(buySignal ? up : na, title="Buy", text="Buy", location=location.absolute, style=shape.labelup, size=size.tiny, color=color.new(color.green, 0), textcolor=color.new(color.white, 0))

dnPlot = plot(showSupertrend ? (trend == 1 ? na : dn) : na, title="Down Trend", style=plot.style_linebr, linewidth=2, color=color.new(color.red, 0))
sellSignal = trend == -1 and trend[1] == 1
plotshape(sellSignal ? dn : na, title="DownTrend Begins", location=location.absolute, style=shape.circle, size=size.tiny, color=color.new(color.red, 0))
plotshape(sellSignal ? dn : na, title="Sell", text="Sell", location=location.absolute, style=shape.labeldown, size=size.tiny, color=color.new(color.red, 0), textcolor=color.new(color.white, 0))

mPlot = plot(ohlc4, title="", style=plot.style_circles, linewidth=0)

longFillColor = (trend == 1 ? color.new(color.green, 80) : color.new(color.white, 0))
shortFillColor = (trend == -1 ? color.new(color.red, 80) : color.new(color.white, 0))

fill(mPlot, upPlot, title="UpTrend Highlighter", color=longFillColor)
fill(mPlot, dnPlot, title="DownTrend Highlighter", color=shortFillColor)

// Alert conditions
alertcondition(buySignal, title="Custom Supertrend Buy", message="Custom Supertrend Buy!")
alertcondition(sellSignal, title="Custom Supertrend Sell", message="Custom Supertrend Sell!")

// Calculate DEMA
ema1 = ema(close, demaLength)
dema = 2 * ema1 - ema(ema1, demaLength)

// Plot DEMA with white color
plot(showDEMA ? dema : na, color=color.new(color.white, 0), title="DEMA", linewidth=2)

// Add push notification on mobile if buy and sell occurred
if (buySignal)
    strategy.entry("Buy", strategy.long)
    strategy.exit("Sell")
    alert("Buy Signal - Supertrend")

if (sellSignal)
    strategy.entry("Sell", strategy.short)
    strategy.exit("Cover")
    alert("Sell Signal - Supertrend")
- ADXモメンタムトレンド戦略
- 123 逆転点とピボットポイントの組み合わせ戦略
- 移動平均値とストカスティックRSIの組み合わせの取引戦略
- 動的トレンド追跡逆転戦略
- 日々のDCA戦略とEMAの接触
- トレンド強度 バース戦略の確認
- 超トレンド 双動平均戦略
- WaveTrend と DER に 基づく スウィング トレーディング 戦略
- ハル・フィッシャー 適応型 インテリジェント 多要素戦略
- 株式曲線に基づく動的ポジションサイズ戦略
- アダプティブ・インテリジェント・グリッド・トレーディング・戦略
- トレンド追跡逆転戦略
- 価格チャネルブレイク戦略
- SAR 交代期間の取引戦略
- EMA/MAのクロスオーバーオプション取引戦略
- RMI トレンドシンクロ戦略
- マルチタイムフレームMACD移動平均取引戦略
- ADX ダイナミックトレンド戦略
- トレンド フォロー 戦略 ハルスの移動平均値と真の範囲をベースに
- 双重確認量取引戦略