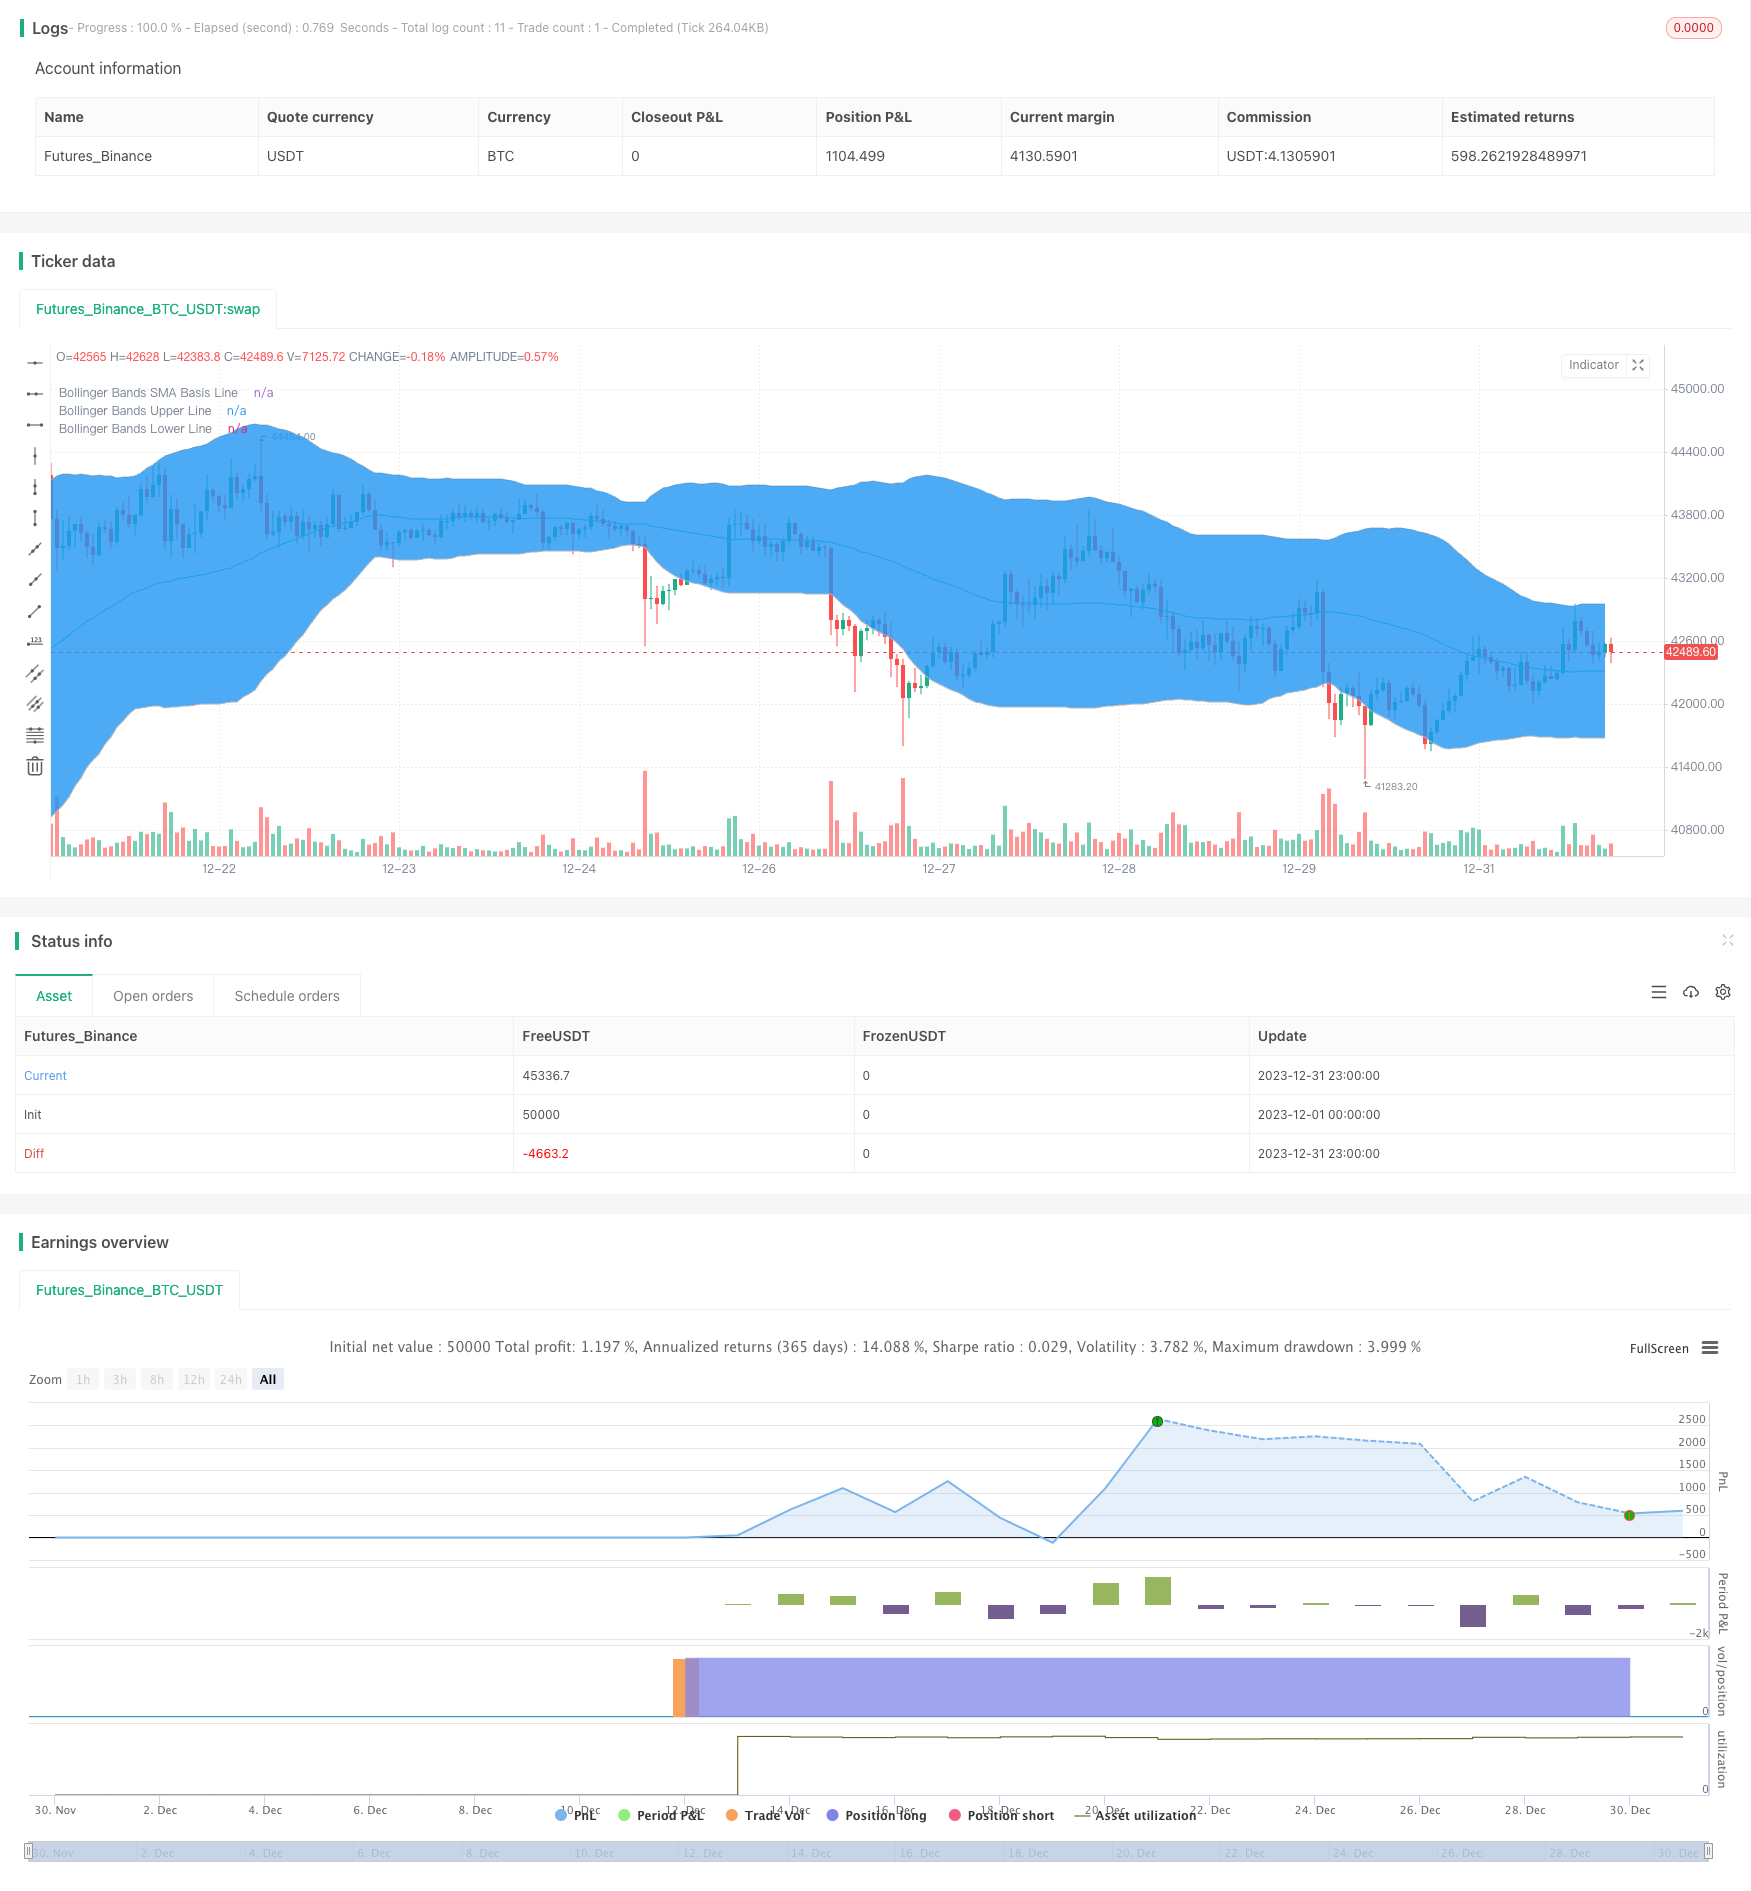
RSI ボリンジャー・バンド取引戦略
作者: リン・ハーンチャオチャン,日付: 2024-01-24 14:56:02タグ:

概要
この戦略は,主に取引シグナル判断のために,相対強度指数 (RSI) とボリンジャーバンドを組み合わせて使用する.特に,RSIが過売値を超えて下ボリンジャーバンドを超えるとロングになり,RSIが過買い値を超えて上ボリンジャーバンドを超えるとショートする.
戦略の論理
この戦略は,まずRSIインジケーターとボリンジャーバンドを計算する. RSIインジケーターは,取引ツールの相対的な強さを反映する. RSIがオーバーセールゾーン (デフォルト30) 以下の値になると,ツールはオーバーセールで購入すべきである. ボリンジャーバンドには上帯,中帯,下帯が含まれ,価格の変動範囲をよく反映する. 下帯の近くで購入し,上帯の近くで販売することで,比較的信頼性の高い信号を提供することができる. この戦略は,RSIインジケーターとボリンジャーバンドを組み合わせて,取引信号判断を行う. RSIがオーバーセールゾーンから上 (デフォルト30) に上昇し,下帯から上へ上昇すると,RSIが下帯から下へ落ちると (デフォルト価格70) 売り信号を生成する.
利点
- RSIとボリンジャー帯を組み合わせることで,信号の正確性が向上します.
- RSI は 騒音 を フィルタリング する
- ボリンジャー・バンドは,現在の市場の変動範囲を反映し,信頼できる信号です
- 厳格な取引規則,無効な取引を避ける
リスク
- 誤ったボリンジャー・バンドのパラメータは,不正確な信号を引き起こす可能性があります.
- RSIの過剰購入/過剰売却ゾーンの設定が不適切である場合,判断に影響を与える可能性があります.
- 戦略は厳格で,いくつかの機会を逃すかもしれない
解決策:
- 最適な組み合わせを見つけるためにボリンジャー帯とRSIパラメータを最適化
- 適度な条件を緩和し,より多くのチャンスのためにいくつかの無効な取引を許可します
オプティマイゼーションの方向性
- 最適のRSIとボリンジャーパラメータをテストし最適化します
- ストップ・ロスをリスク制御に追加する
- シグナル検証のためにMACDのような他の指標を追加することを検討してください.
- テスト最適化結果は,異なる製品とタイムフレームで
概要
ストップ・ロスのためのRSIとボリンジャー・バンドを効果的に組み合わせ,総合戦略は堅牢である.パラメータのテストと最適化によりさらなる改善を達成することができる.また,厳格なルールによる潜在的な信号欠損リスクも認識する必要があります.一般的に,これは信頼できる定量的な取引戦略です.
/*backtest
start: 2023-12-01 00:00:00
end: 2023-12-31 23:59:59
period: 1h
basePeriod: 15m
exchanges: [{"eid":"Futures_Binance","currency":"BTC_USDT"}]
*/

//@version=2
strategy("BB + RSI 20MIN,", shorttitle="BBRSI 20MIN", overlay=true )

     // Strategy Tester Start Time
sYear = input(2019, title = "Start Year")
sMonth = input(04, title = "Start Month", minval = 01, maxval = 12)
sDay = input(01, title = "Start Day", minval = 01, maxval = 31)
sHour = input(00, title = "Start Hour", minval = 00, maxval = 23)
sMinute = input(00, title = "Start Minute", minval = 00, maxval = 59)
startTime = true


///////////// RSI
RSIlength = input(9,title="RSI Period Length")
RSIoverSold = input(30, minval=1,title="RSIL")
RSIoverBought = input(69, minval=1,title="RSIh")
price = open
vrsi = rsi(price, RSIlength)


///////////// Bollinger Bands
BBlength = input(60, minval=1,title="Bollinger Period Length")
BBmult = input(2.0, minval=0.001, maxval=50,title="Bb")
BBbasis = sma(price, BBlength)
BBdev = BBmult * stdev(price, BBlength)
BBupper = BBbasis + BBdev
BBlower = BBbasis - BBdev
source = close
buyEntry = crossover(source, BBlower)
sellEntry = crossunder(source, BBupper)
plot(BBbasis, color=aqua,title="Bollinger Bands SMA Basis Line")
p1 = plot(BBupper, color=silver,title="Bollinger Bands Upper Line")
p2 = plot(BBlower, color=silver,title="Bollinger Bands Lower Line")
fill(p1, p2)


///////////// Colors
switch1=input(true, title="Enable Bar Color?")
switch2=input(true, title="Enable Background Color?")
TrendColor = RSIoverBought and (price[1] > BBupper and price < BBupper) and BBbasis < BBbasis[1] ? red : RSIoverSold and (price[1] < BBlower and price > BBlower) and BBbasis > BBbasis[1] ? green : na
barcolor(switch1?TrendColor:na)
bgcolor(switch2?TrendColor:na,transp=50)


///////////// RSI + Bollinger Bands Strategy
if (not na(vrsi))

    if (crossover(vrsi, RSIoverSold) and crossover(source, BBlower))
        strategy.entry("RSI_BB_L", strategy.long and startTime, stop=BBlower,  comment="RSI_BB_L")
    else
        strategy.cancel(id="RSI_BB_L")

    if (crossunder(vrsi, RSIoverBought) and crossunder(source, BBupper))
        strategy.entry("RSI_BB_S", strategy.short and startTime, stop=BBupper,comment="RSI_BB_S")
    else
        strategy.cancel(id="RSI_BB_S")

//plot(strategy.equity, title="equity", color=red, linewidth=2, style=areabr)
もっと
- EMA の 日中 スカルピング 戦略
- ランダムエントリーに基づく複合ストップ損失と収益戦略
- バンドパスフィルター 逆の戦略
- 2つの移動平均のクロスオーバー取引戦略
- RSIとボリンジャー帯とダイナミックサポート/レジスタンス量的な戦略を組み合わせた
- ダイナミック・ダブル・EMA トレイリング・ストップ戦略
- 複数の指標を組み合わせた定量取引戦略
- コントリアン ドンチアンチャネルタッチエントリー戦略
- 日中の単一のキャンドル指標 コンボ 短期取引戦略
- 移動平均のクロスオーバー取引戦略
- 双 EMA を ベース に する 戦略 を フォロー する 傾向
- 2つの移動平均のブレイクアウト戦略
- RSIと移動平均のブレイクアウト戦略
- EMAの追跡戦略
- 動向平均に基づく戦略をフォローする傾向
- SMAクロスオーバー イチモク 市場深度 量に基づく量的な取引戦略
- トレンドトラッキング ストップ損失 利益 戦略
- 二方向切断ゼロ軸 Qstick インディケーター バックテスト 戦略
- 移動平均のクロスオーバー取引戦略
- 移動平均差の戦略