指標の組み合わせによる画期的なトレンド追跡戦略
作成日:
2024-02-20 11:38:22
最終変更日:
2024-02-20 11:38:22
コピー:
2
クリック数:
610
1
フォロー
1627
フォロワー
概要
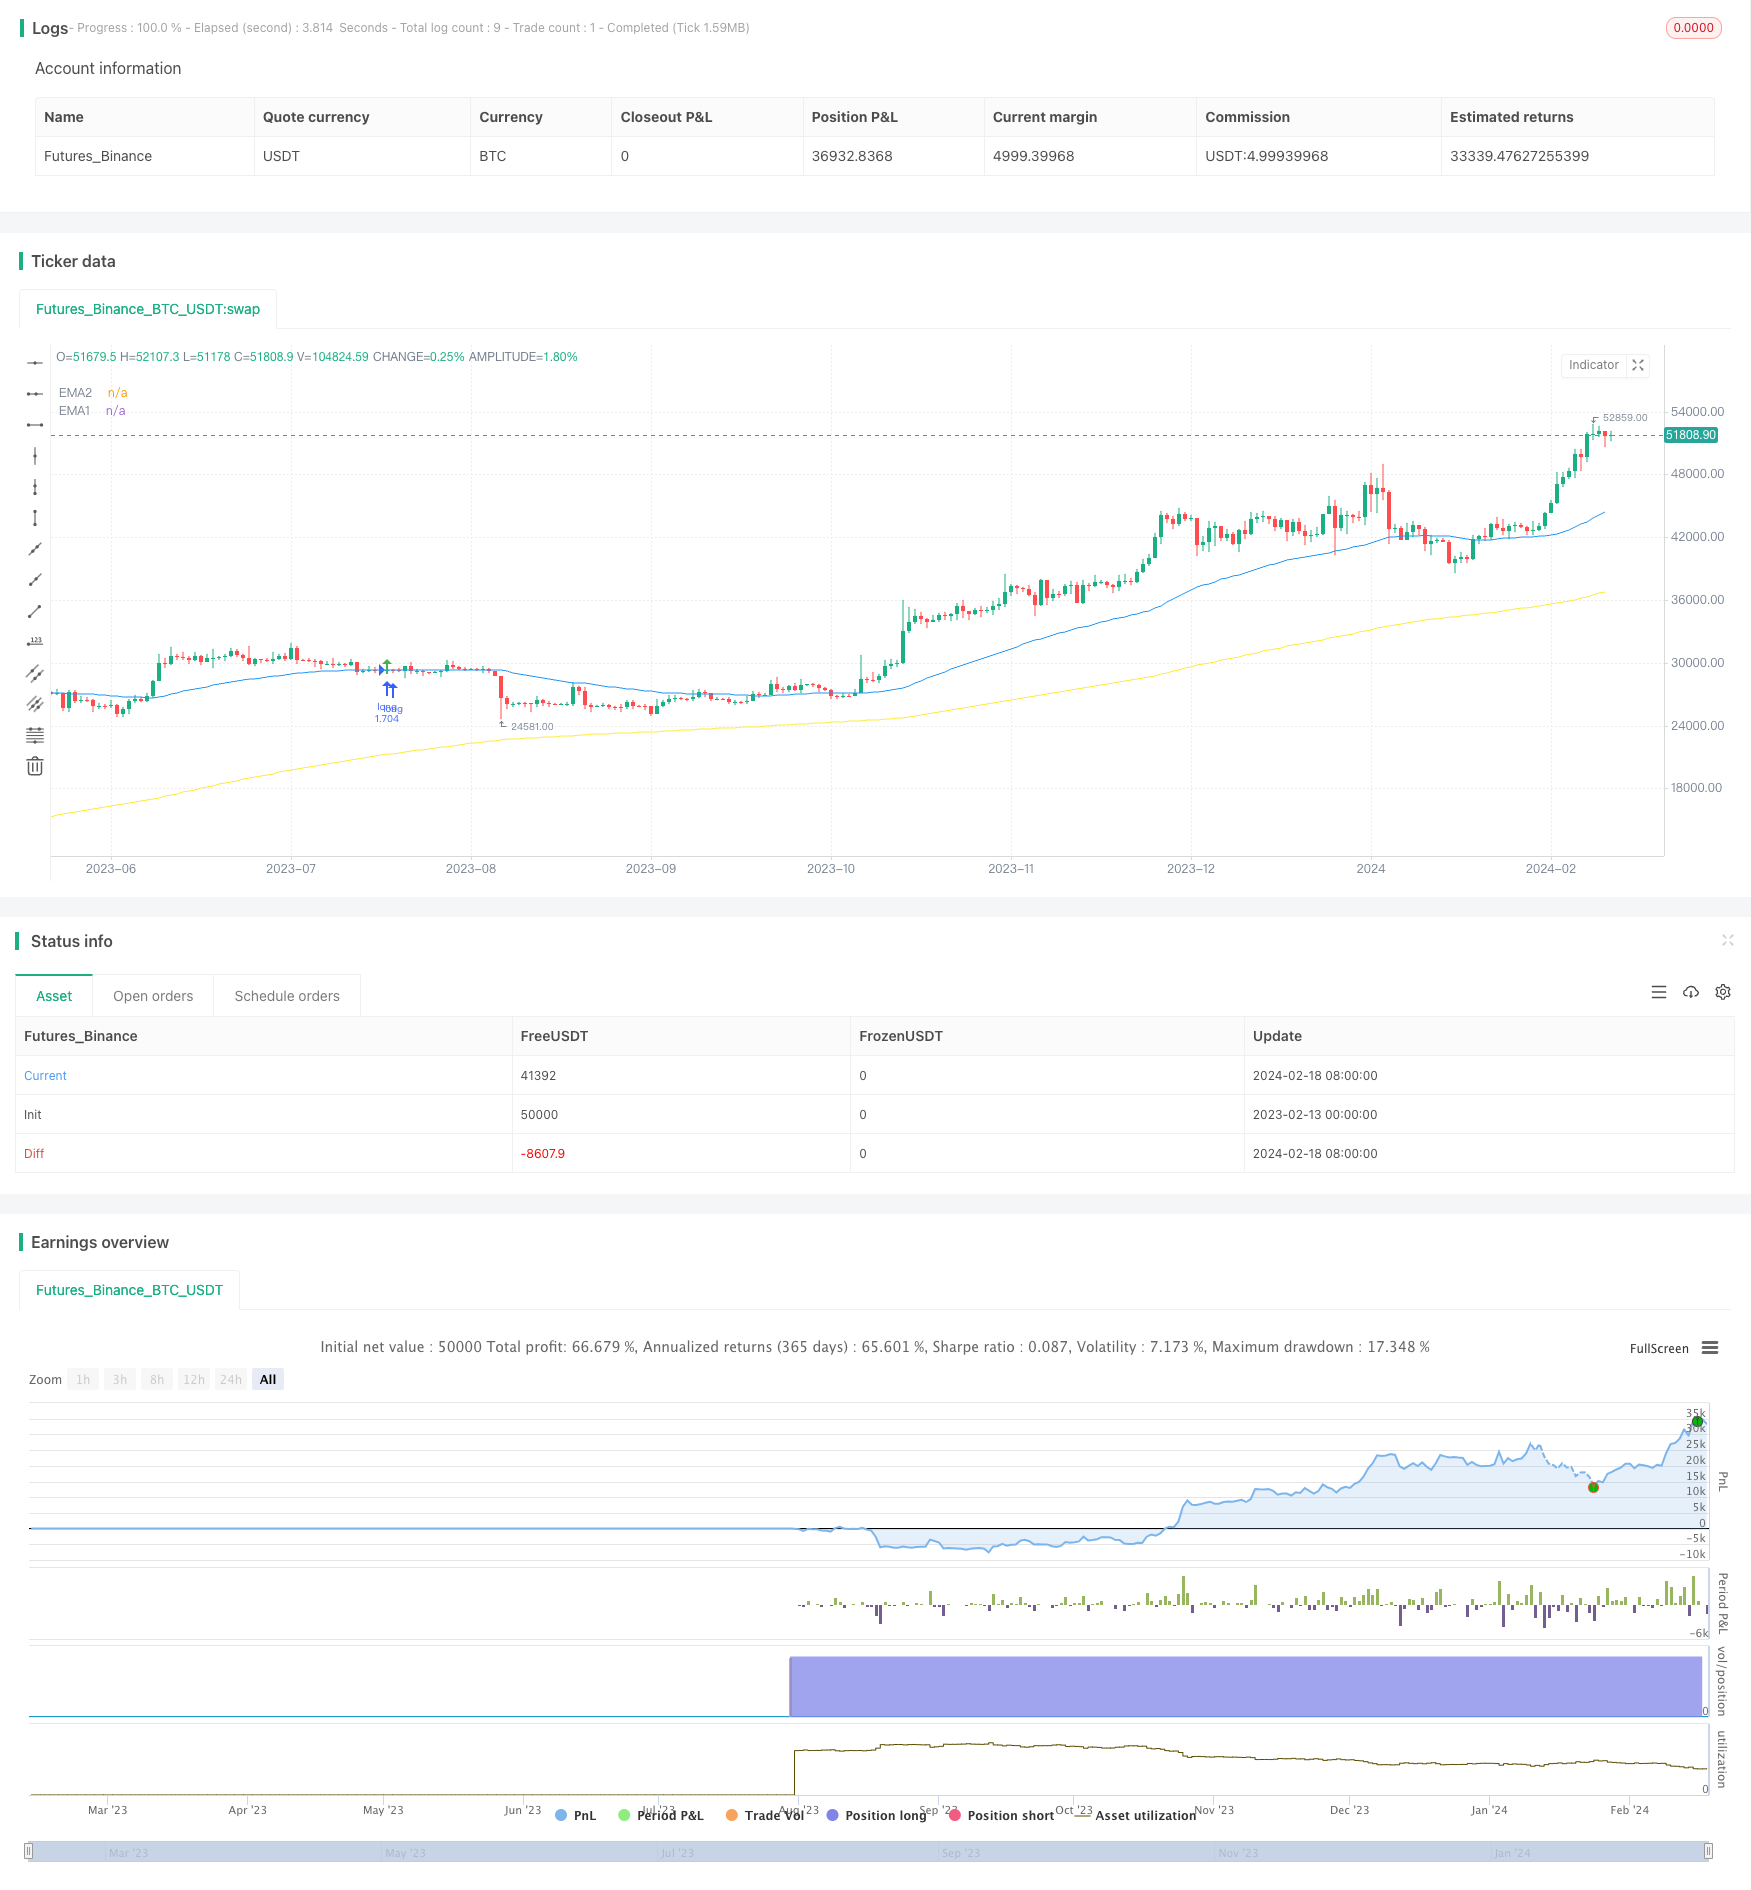
この戦略は,指数组合突破トレンド追跡戦略と呼ばれる.この戦略は,複数の指標を総合的に使用し,市場トレンドの方向を識別し,トレンド追跡操作を行う.主に以下のいくつかの部分を含む.
- 波動トレンド指標を用いて市場の主要トレンドを判断する
- RSIとキャピタルフローの組み合わせで,偽の信号をフィルターします.
- EMAの指数は,特定の行動の方向性を判断します.
- オンラインショップは,トレンドに沿って動作するように,突破的な追跡方法を採用しています.
戦略原則
この戦略は,主要トレンドの方向と強さを判断し,多空双方向取引を設定する.具体的操作原理は以下の通りである.
複数の入口信号:
- 価格が200日EMAより高く,多頭市場であることを示す
- 価格は50日EMAの近くで支柱を形成する方向に逆戻り
- 波の指標は上昇傾向に逆転し,買い信号が出ました.
- RSIとMFIの両方で買い過ぎを示しています.
- 連続3K線が50日間のEMAを突破し,上昇を示している.
空頭入口信号: 複数の入口信号の反対
ストップ・ロスの方法: 2つのオプションが提供されています. 最低価格/最高価格のストップ,ATRのストップ
戦略的優位分析
この戦略の利点は以下の通りです.
- 複数の指標を組み合わせて大きなトレンドを判断し,偽の突破を避ける
- EMAは,トレンドを追跡し,操作方向を判断する
- ストップ・ロスを追跡して持続的な利益を得る方法
- 複数の空白を同時に行うことができ,市場の任意の方向に動きます.
戦略的リスク分析
この戦略にはいくつかのリスクがあります.
- 指示器が誤った信号を発する確率
- ストップポイントが小さすぎると,ストップリスクが増加します.
- 取引の回数が多く,取引費用は隠された損失です.
上記のリスクを低減するために,以下の点で最適化することができます.
- 指数パラメータを調整し,誤信号をフィルターする
- 適切な緩解のストップポイント
- 指数パラメータを最適化し,取引数を減らす
戦略最適化の方向性
この戦略は,コードレベルでは,以下の方向に最適化できます.
- 波動指数,RSI,MFIのパラメータを調整し,最適なパラメータの組み合わせを選択します.
- 異なるEMA周期パラメータのパフォーマンスをテスト
- ストップ・ストップ・ロスの利益リスク比率因子を調整し,最適配置を得る
パラメータ調整とテストにより,戦略はリターンとリスクを最大限に抑えながら,リターンとリスクを最大限に抑えることができます.
要約する
この戦略は,複数の指標を総合的に使って,大トレンドの方向を判断し,EMA指標を具体的な操作信号として採用し,ストップ・ロスを追跡して利益をロックする.パラメータを最適化することで,よりよい安定した利益を得ることができる.しかし,一定のシステムリスクにも注意し,指標効果や市場環境の変化に継続的に注目する必要がある.
ストラテジーソースコード
/*backtest
start: 2023-02-13 00:00:00
end: 2024-02-19 00:00:00
period: 1d
basePeriod: 1h
exchanges: [{"eid":"Futures_Binance","currency":"BTC_USDT"}]
*/

//@version=4
//Lowest Low/ Highest High & ATR Stop Loss/ Take Profit
//Optimized for the 30 minutes chart

strategy(title="TradePro's Trading Idea Cipher B+ Divergence EMA Pullback Strategy", shorttitle="WT MFI RSI EMA PB STRAT", overlay = true, pyramiding = 0, max_bars_back=5000, calc_on_order_fills = false, commission_type =  strategy.commission.percent, commission_value = 0, default_qty_type = strategy.percent_of_equity, default_qty_value = 100, initial_capital=5000, currency=currency.USD)

// { Time Range
FromMonth=input(defval=1,title="FromMonth",minval=1,maxval=12)
FromDay=input(defval=1,title="FromDay",minval=1,maxval=31)
FromYear=input(defval=2020,title="FromYear",minval=2016)
ToMonth=input(defval=1,title="ToMonth",minval=1,maxval=12)
ToDay=input(defval=1,title="ToDay",minval=1,maxval=31)
ToYear=input(defval=9999,title="ToYear",minval=2017)
start=timestamp(FromYear,FromMonth,FromDay,00,00)
finish=timestamp(ToYear,ToMonth,ToDay,23,59)
window()=>true

// See if this bar's time happened on/after start date
afterStartDate = time >= start and time<=finish?true:false

zeroline = 0

// } Time Range

// { Wavetrend, RSI, MFI

// WaveTrend
cl = input(12, "Channel Length")
al = input(12, "Average Length")
overbought = input(53, title = 'WT Overbought Level 1', type = input.integer)
oversold = input(-53, title = 'WT Oversold Level 1', type = input.integer)
ap = hlc3
esa = ema(ap, cl)
d = ema(abs(ap - esa), cl)
ci = (ap - esa) / (0.015 * d)
tci = ema(ci, al)

wt1 = tci
wt2 = sma(wt1,4)

wtOs = wt2 <= oversold
wtOb = wt2 >= overbought
wtX = cross(wt1, wt2)
wtUp = wt2 - wt1 <= 0
wtDown = wt2 - wt1 >= 0
buySignal = wtX and wtOs and wtUp
sellSignal = wtX and wtOb and wtDown

// RSI & MFI

rsiMFIPosY = input(2, title = 'MFI Area Y Pos', type = input.float)
rsiMFIperiod = input(80,title = 'MFI Period', type = input.integer)
rsiMFIMultiplier = input(200, title = 'MFI Area multiplier', type = input.float)
f_rsimfi(_period, _multiplier, _tf) => security(syminfo.tickerid, _tf, sma(((close - open) / (high - low)) * _multiplier, _period) - rsiMFIPosY)
rsiMFI = f_rsimfi(rsiMFIperiod, rsiMFIMultiplier, timeframe.period)

// } Wavetrend, RSI, MFI

// { EMA
emasrc = close
res = input(title="EMA Timeframe", type=input.resolution, defval="30")
len1 = input(title="EMA1 Length", type=input.integer, defval=200)
col1 = color.yellow

len2 = input(title="EMA2 Length", type=input.integer, defval=50)
col2 = color.blue

// Calculate EMA
ema1 = ema(emasrc, len1)
emaSmooth1 = security(syminfo.tickerid, res, ema1, barmerge.gaps_off, barmerge.lookahead_off)

ema2 = ema(emasrc, len2)
emaSmooth2 = security(syminfo.tickerid, res, ema2, barmerge.gaps_off, barmerge.lookahead_off)

// Draw EMA
plot(emaSmooth1, title="EMA1", linewidth=1, color=col1)
plot(emaSmooth2, title="EMA2", linewidth=1, color=col2)

// } EMA

// { Long Entry

enablelong = input(true, title="Enable long?")

//Long Signal
upcondition = close > emaSmooth1
wavetrendlong = wt1 and wt2 < zeroline
mfilong = rsiMFI > 0
emapblong1 = (close > emaSmooth2) and (close[1] < emaSmooth2[1])
emapblong2 = ((close[2] > emaSmooth2[2]) and (close[3] > emaSmooth2[3]) and (close[4] > emaSmooth2[4])) or ((close[5] > emaSmooth2[5]) and (close[6] > emaSmooth2[6]) and (close[7] > emaSmooth2[7])) or ((close[8] > emaSmooth2[8]) and (close[9] > emaSmooth2[9]) and (close[10] > emaSmooth2[10]))

longcondition = upcondition and wavetrendlong and buySignal and mfilong and emapblong1 and emapblong2

//strategy buy long
if (longcondition) and (afterStartDate) and strategy.opentrades < 1 and (enablelong == true)
    strategy.entry("long", strategy.long)

plotshape(longcondition, style=shape.arrowup,
                 location=location.abovebar, color=color.green)

// } Long Entry

// { Short Entry

enableshort = input(true, title="Enable short?")

//Short Signal
downcondition = close < emaSmooth1
wavetrendshort = wt1 and wt2 > zeroline
mfishort = rsiMFI < 0
emapbshort1 = (close < emaSmooth2) and (close[1] > emaSmooth2[1])
emapbshort2 = ((close[2] < emaSmooth2[2]) and (close[3] < emaSmooth2[3]) and (close[4] < emaSmooth2[4])) or ((close[5] < emaSmooth2[5]) and (close[6] < emaSmooth2[6]) and (close[7] < emaSmooth2[7])) or ((close[8] < emaSmooth2[8]) and (close[9] < emaSmooth2[9]) and (close[10] < emaSmooth2[10]))

shortcondition = downcondition and wavetrendshort and sellSignal and mfishort and emapbshort1 and emapbshort2

//strategy buy short
if (shortcondition) and (afterStartDate) and strategy.opentrades < 1 and (enableshort == true)
    strategy.entry("short", strategy.short)

plotshape(shortcondition, style=shape.arrowdown,
                 location=location.belowbar, color=color.red)

// } Short Entry

// { Exit Conditions
bought = strategy.position_size[1] < strategy.position_size
sold = strategy.position_size[1] > strategy.position_size
barsbought = barssince(bought)
barssold = barssince(sold)
slbuffer = input(title="SL Buffer", type=input.float, step=0.1, defval=0)

// } Exit Conditions

// { Lowest Low/ Highes High Exit Condition
enablelowhigh = input(false, title="Enable lowest low/ highest high exit?")

//Lowest Low LONG
profitfactorlong = input(title="ProfitfactorLong", type=input.float, step=0.1, defval=2)
loLen = input(title="Lowest Low Lookback", type=input.integer,
  defval=50, minval=2)
stop_level_long = lowest(low, loLen)[1]

if enablelowhigh == true and strategy.position_size>0
    profit_level_long = strategy.position_avg_price + ((strategy.position_avg_price - stop_level_long[barsbought])*profitfactorlong) + slbuffer
    strategy.exit(id="TP/ SL", stop=stop_level_long[barsbought] - slbuffer, limit=profit_level_long)

//Lowest Low SHORT
profitfactorshort = input(title="ProfitfactorShort", type=input.float, step=0.1, defval=2)
highLen = input(title="highest high lookback", type=input.integer,
  defval=50, minval=2)
stop_level_short = highest(high, highLen)[1]

if enablelowhigh == true and strategy.position_size<0
    profit_level_short = strategy.position_avg_price - ((stop_level_short[barssold] - strategy.position_avg_price)*profitfactorshort) - slbuffer
    strategy.exit(id="TP/ SL", stop=stop_level_short[barssold] + slbuffer, limit=profit_level_short)

// } Lowest Low/ Highes High Exit Condition

// { ATR Take Profit/ Stop Loss
enableatr = input(true, title="Enable ATR exit?")
atrprofitfactorlong = input(title="ATR Profitfactor Long", type=input.float, step=0.1, defval=6)
atrstopfactorlong = input(title="ATR Stopfactor Long", type=input.float, step=0.1, defval=5)
atrprofitfactorshort = input(title="ATR Profitfactor Short", type=input.float, step=0.1, defval=3)
atrstopfactorshort = input(title="ATR Stopfactor Short", type=input.float, step=0.1, defval=5)

//ATR
lengthATR = input(title="ATR Length", defval=11, minval=1)
atr = atr(lengthATR)

//LONG EXIT
if (afterStartDate) and ((enableatr == true) and (strategy.opentrades > 0))
    barsbought1 = barssince(bought)
    profit_level = strategy.position_avg_price + (atr*atrprofitfactorlong)
    stop_level = strategy.position_avg_price - (atr*atrstopfactorlong)
    strategy.exit("Take Profit/ Stop Loss", "long", stop=stop_level[barsbought1], limit=profit_level[barsbought1])

//SHORT EXIT
if (afterStartDate) and ((enableatr == true) and (strategy.opentrades > 0))
    barssold1 = barssince(sold)
    profit_level = strategy.position_avg_price - (atr*atrprofitfactorshort)
    stop_level = strategy.position_avg_price + (atr*atrstopfactorshort)
    strategy.exit("Take Profit/ Stop Loss", "short", stop=stop_level[barssold1], limit=profit_level[barssold1])

// } ATR Take Profit/ Stop Loss