スーパートレンドとボリンジャーバンドの組み合わせ戦略
作成日:
2024-03-29 15:18:22
最終変更日:
2024-03-29 15:18:22
コピー:
14
クリック数:
1115
1
フォロー
1627
フォロワー

概要
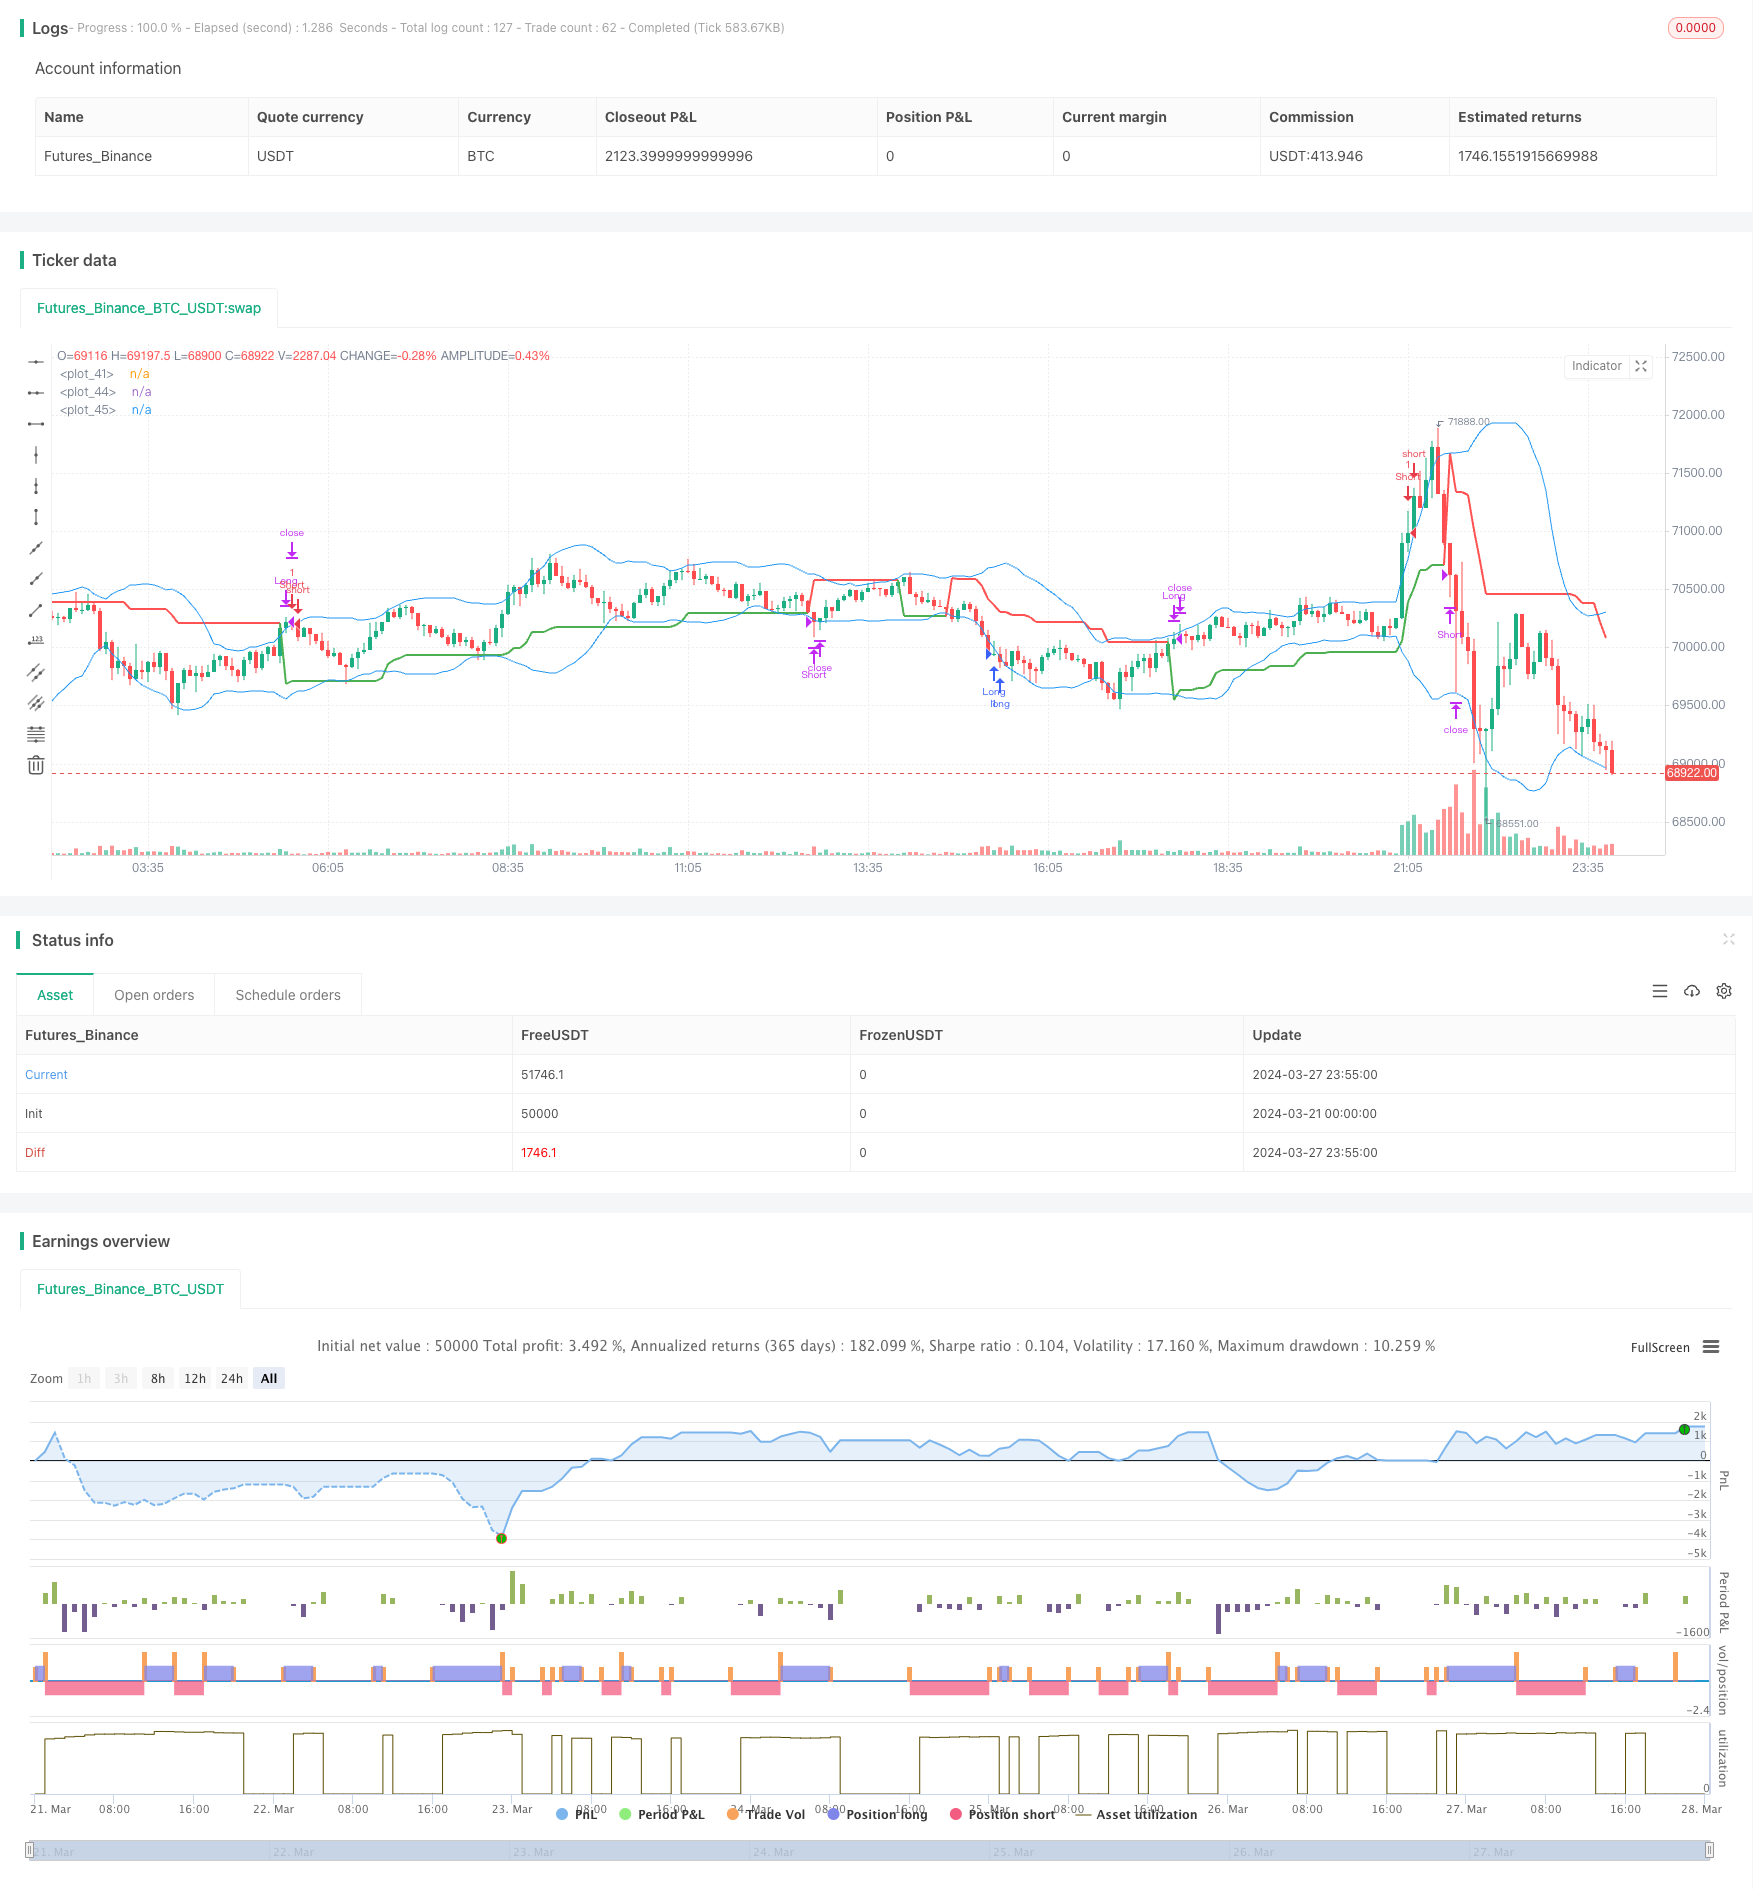
この戦略は,スーパートレンド指数とブリン帯の指数を組み合わせて,市場のトレンドの機会を捉えることを目的としています.スーパートレンド指数は,現在の市場のトレンド方向を判断するために使用され,ブリン帯の指数は,市場の変動率を測定するために使用されます.
戦略原則
- 市場における現在のトレンド方向を判断するために,実際の波幅 ((ATR) と超トレンド指標を計算する.
- ブリン帯を上下軌道で計算し,市場の変動率を測定する.
- 閉店価格が超トレンドラインを突破してブリン帯下線にあるとき,多做信号を生成する.閉店価格が超トレンドラインを突破してブリン帯上線にあるとき,空き信号を生成する.
- 複数頭ポジションを保有するときは,閉盘価格が超トレンドラインを下回ると平仓する.空頭ポジションを保有するときは,閉盘価格が超トレンドラインを突破すると平仓する.
戦略的優位性
- トレンドと波動率の2次元情報を組み合わせることで,市場機会をより全面的に把握できます.
- トレンドが明らかになった時に,タイムリーにエントリーできれば,トレンドの利得を捉えるのに役立ちます.
- 震えのある市場では,ブリン帯と超トレンドが組み合わせて,偽の突破信号を効果的にフィルターし,震えのある状況下での損失のリスクを軽減します.
- コードロジックは明快で,パラメータは少なく,理解し,実装しやすい.
戦略リスク
- 単面的なトレンドの状況では,頻繁に突破シグナルが発生するので,取引頻度が高くなり,取引コストが増加する可能性があります.
- 突破点の捕捉は,超トレンド指標に依存しており,これはパラメータに敏感であり,異なるパラメータの下の指標走行の差異が大きいため,戦略の効果に影響を与える可能性があります.
- ブリン帯域は,市場の変動率の変化に合わせて変化し,高変動率の環境では,ストップローズを拡大する可能性があります.
戦略最適化の方向性
- 取引量,市場情緒などの有効なフィルタリング条件を導入することを検討し,信号の信頼性をさらに向上させることができます.
- スーパートレンド指標のパラメータについては,最適化テストを行い,戦略の安定性を高めるために最適なパラメータを選択することができます.
- 取引実行の面で,移動停止,動的にポジションを調整するなど,より細かいポジション管理とリスク制御の措置を導入することができ,単一取引のリスクの限界を減らすことができます.
要約する
超トレンドブリンバンド組合せ戦略は,トレンド追跡型の戦略であり,トレンドと変動率の2つの市場要素を組み合わせることで,トレンドの機会を比較的に効果的に捕捉することができる.しかし,この戦略には,パラメータに敏感,高変動率環境でリスクが増加するなど,一定の制限がある.したがって,実際のアプリケーションでは,市場の特徴と自身のリスク好みに応じて,戦略に適切な最適化と改善が必要である.
ストラテジーソースコード
/*backtest
start: 2024-03-21 00:00:00
end: 2024-03-28 00:00:00
period: 5m
basePeriod: 1m
exchanges: [{"eid":"Futures_Binance","currency":"BTC_USDT"}]
*/

// This Pine Script™ code is subject to the terms of the Mozilla Public License 2.0 at https://mozilla.org/MPL/2.0/
// © sabhiv27

//@version=4
strategy("Supertrend & Bollinger Bands Strategy", shorttitle="ST_BB_Strategy", overlay=true)

// Input options
factor = input(3, title="Supertrend Factor")
length = input(10, title="ATR Length")
bollinger_length = input(20, title="Bollinger Bands Length")
bollinger_deviation = input(2, title="Bollinger Bands Deviation")

// Calculate True Range for Supertrend
truerange = rma(tr, length)

// Calculate Supertrend
var float up_trend = na
var float dn_trend = na
var float trend = na
up_signal = hl2 - (factor * truerange)
dn_signal = hl2 + (factor * truerange)
up_trend := close[1] > up_trend[1] ? max(up_signal, up_trend[1]) : up_signal
dn_trend := close[1] < dn_trend[1] ? min(dn_signal, dn_trend[1]) : dn_signal
trend := close > dn_trend ? 1 : close < up_trend ? -1 : nz(trend[1], 1)

// Calculate Bollinger Bands
basis = sma(close, bollinger_length)
dev = stdev(close, bollinger_length)
upper_band = basis + bollinger_deviation * dev
lower_band = basis - bollinger_deviation * dev

// Entry conditions
long_condition = crossover(close, up_trend) and close < lower_band
short_condition = crossunder(close, dn_trend) and close > upper_band

// Exit conditions
exit_long_condition = crossover(close, dn_trend)
exit_short_condition = crossunder(close, up_trend)

// Plot Supertrend
plot(trend == 1 ? up_trend : dn_trend, color=trend == 1 ? color.green : color.red, linewidth=2)

// Plot Bollinger Bands
plot(upper_band, color=color.blue)
plot(lower_band, color=color.blue)

// Generate buy and sell signals
strategy.entry("Long", strategy.long, when=long_condition)
strategy.entry("Short", strategy.short, when=short_condition)
strategy.close("Long", when=exit_long_condition)
strategy.close("Short", when=exit_short_condition)