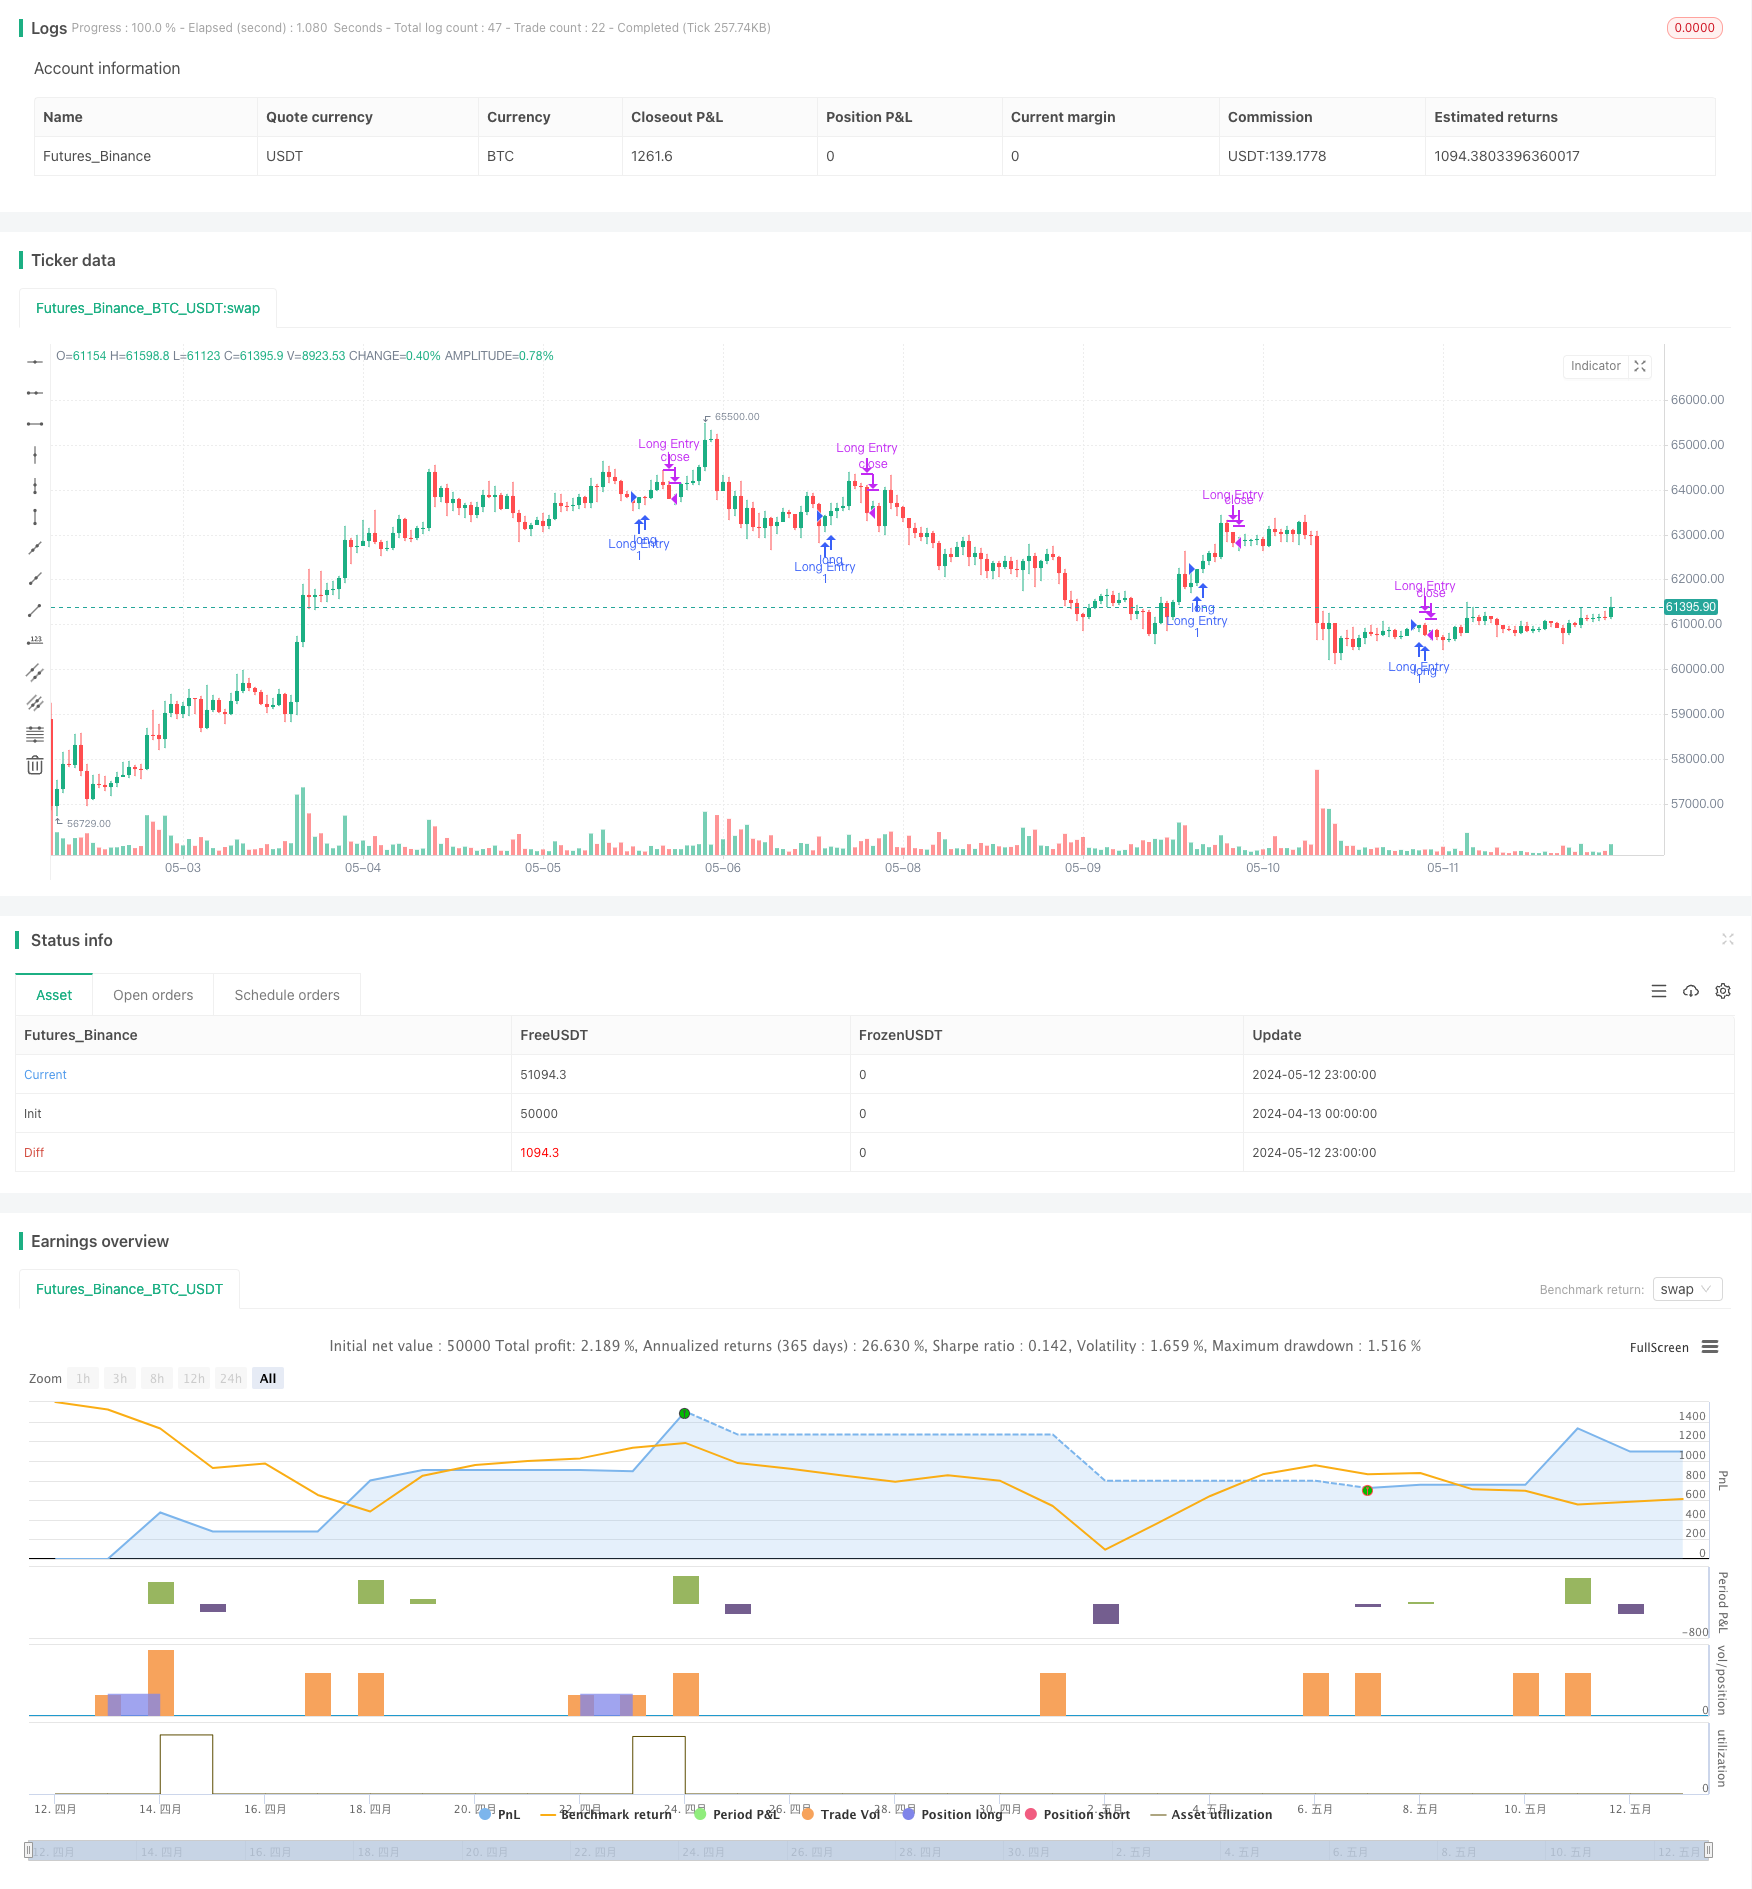
概要
この戦略の主な構想は,上引線のない看板K線を買取信号として探し,価格が前K線低点を下回った時に平仓するものである.この戦略は,多方面力が強いことを示す看板K線上での引線が小さいという特性を利用し,株価が上昇し続ける可能性が大きい.同時に,前K線低点をストップポイントとして,リスクを効果的に制御することができる.
戦略原則
- 現在のK線が看板K線であるかどうかを判断する (閉盘価格が開盘価格より高い)
- K線上の引線長が,K線実体長に占める割合を計算する
- 上引線比率が5%未満なら,有効であると考えられる上引線なしの看板K線で,買取信号を発する
- 購入後,Kラインの最低価格をストップポイントとして記録します.
- 価格がストップ・ロスを破ると,平仓から退出する
戦略的優位性
- 上線なしのK線で入場し,トレンドの強さや成功率が高くなる
- 前K線低点をストップポイントとして利用し,リスクはコントロールできます.
- 論理がシンプルで,実行し,最適化できます.
- トレンドの状況で使うのに適している
戦略リスク
- 購入シグナルが発信された後,即時撤回でストップが発動される場合
- 変動率が高い品種では,購入価格に近いストップが設定され,早期のストップが発生する可能性があります.
- 収益目標の欠如と,最適な平定タイミングの把握が困難
戦略最適化の方向性
- MA,MACDなどの他の指標と組み合わせて,トレンドの強さを確認し,入場信号の有効性を高めることができます.
- 高波動の品種では,前N根K線の最低点のような,より遠い位置にストップを設定して,ストップ周波数を減らすことができます.
- N倍ATRや利回り率などの利回り目標を導入し,利回りを間に合うようにロックします.
- ポジション管理,例えば信号の強度に応じてポジションのサイズを調整するなど
要約する
この戦略は,上引線のない看板K線を選択して入場し,前K線の低点のストップを活用して,トレンドの状況で効果的に利益を捕捉することができる。しかし,戦略には一定の制限がある.例えば,ストップ・ロズ・ポジションは柔軟ではない,利益目標がないなどである。他の指標のフィルタリング信号を導入し,ストップ・ロズ・ポジションを最適化し,利益目標を設定するなど,戦略をより安定して効果的に改善することができる。
Overview
The main idea of this strategy is to find bullish candles without upper wicks as buy signals and close positions when the price breaks below the low of the previous candle. The strategy utilizes the characteristic of bullish candles with very small upper wicks, indicating strong bullish momentum and a higher probability of continued price increases. At the same time, using the low of the previous candle as a stop-loss level can effectively control risk.
Strategy Principles
- Determine if the current candle is a bullish candle (close price higher than open price)
- Calculate the ratio of the current candle’s upper wick length to its body length
- If the upper wick ratio is less than 5%, consider it a valid bullish candle without an upper wick and generate a buy signal
- Record the lowest price of the previous candle after buying as the stop-loss level
- When the price breaks below the stop-loss level, close the position and exit
Strategy Advantages
- Selecting bullish candles without upper wicks for entry, the trend strength is greater and the success rate is higher
- Using the low of the previous candle as the stop-loss level, risks are controllable
- Simple logic, easy to implement and optimize
- Suitable for use in trending markets
Strategy Risks
- There may be cases where a buy signal is followed by an immediate pullback triggering the stop-loss
- For highly volatile instruments, the stop-loss level may be set too close to the buy price, leading to premature stop-outs
- Lack of profit targets, making it difficult to grasp the optimal exit timing
Strategy Optimization Directions
- Combine with other indicators such as MA, MACD, etc., to confirm trend strength and improve the effectiveness of entry signals
- For highly volatile instruments, set the stop-loss level at a further position, such as the lowest point of the previous N candles, to reduce the stop-loss frequency
- Introduce profit targets, such as N times ATR or percentage gains, to lock in profits in a timely manner
- Consider adding position management, such as adjusting position size based on signal strength
Summary
This strategy captures profits effectively in trending markets by selecting bullish candles without upper wicks for entry and using the low of the previous candle for stop-loss. However, the strategy also has certain limitations, such as inflexible stop-loss placement and lack of profit targets. Improvements can be made by introducing other indicators to filter signals, optimizing stop-loss positions, and setting profit targets to make the strategy more robust and effective.
/*backtest
start: 2024-04-13 00:00:00
end: 2024-05-13 00:00:00
period: 1h
basePeriod: 15m
exchanges: [{"eid":"Futures_Binance","currency":"BTC_USDT"}]
*/

// This Pine Script™ code is subject to the terms of the Mozilla Public License 2.0 at https://mozilla.org/MPL/2.0/
// © nagpha

//@version=5
strategy("My strategy", overlay=true, margin_long=100, margin_short=100)

candleBodySize = math.abs(open - close)

// Calculate candle wick size
candleWickSize = high - close

// Calculate percentage of wick to candle body
wickPercentage = (candleWickSize / candleBodySize) * 100

// Check if candle is bullish and wick is less than 1% of the body
isBullish = close > open
isWickLessThan5Percent = wickPercentage < 5


longCondition = isBullish and isWickLessThan5Percent

if (longCondition)
    // log.info("long position taken")
    strategy.entry("Long Entry", strategy.long)

float prevLow = 0.0
prevLow := request.security(syminfo.tickerid, timeframe.period, low[1], lookahead=barmerge.lookahead_on)

float closingPrice = close
//plot(closingPrice, "Close Price", color.purple, 3)
//plot(prevLow, "Previous Low", color.red, 3)
//log.info("Outside: {0,number,#}",closingPrice)
//log.info("Outside: {0,number,#}",prevLow)

if closingPrice < prevLow and strategy.position_size > 0
    //log.info("inside close: {0,number} : {0,number}",closingPrice,prevLow)
    // log.info("position exited")
    strategy.close("Long Entry")
    longCondition := false
    prevLow := 0
    isBullish := false

//plot(series=strategy.position_size > 0 ? prevLow : na, color = color.new(#40ccfb,0), style=plot.style_cross,linewidth = 5)