概要
この戦略はブリン帯,RSI,複数の移動平均値とMACD指標を組み合わせて,完全な取引システムを構築する.まずはブリンによって価格の変動を判断し,価格がブリン帯の中軌道の位置を比較してトレンドを決定する.同時に,RSI指標を使用して,超買い状態を判断し,RSI偏差を使用して,潜在的トレンド反転を識別する.複数の移動平均線は,トレンドを追跡し,抵抗位置を判断する.最後に,MACD指標は,トレンドと潜在的反転を判断するのに役立ちます.
戦略原則
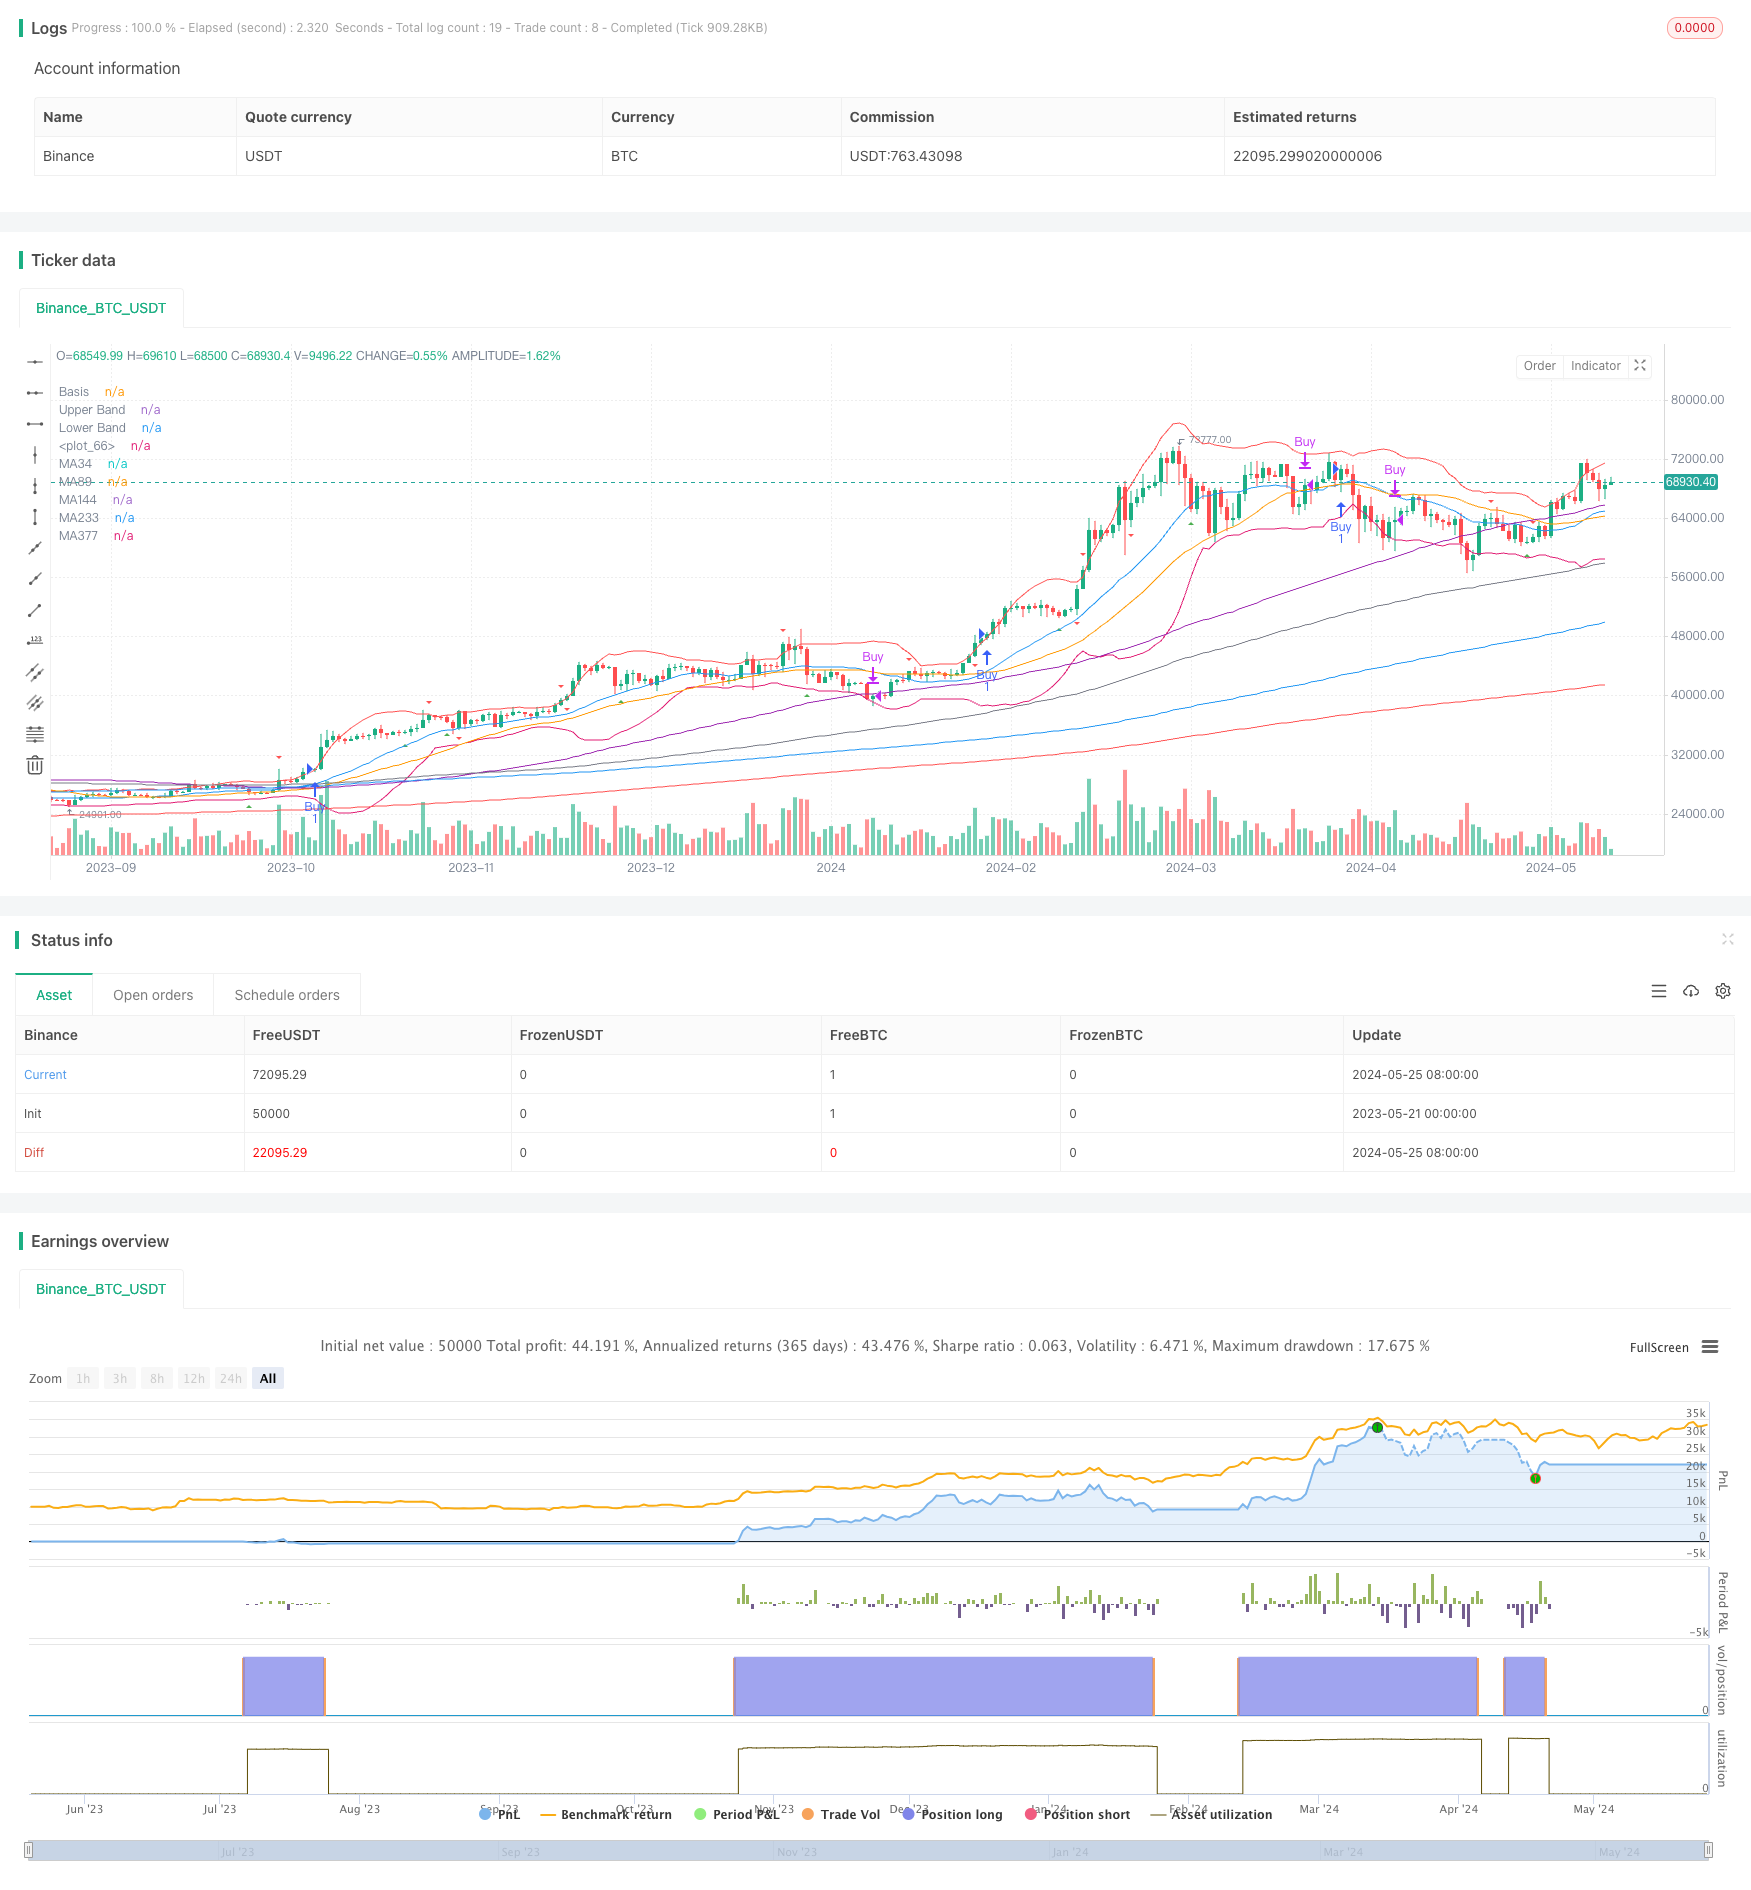
- 20周期,2倍標準差のブリン帯を使用し,閉盘価格がブリン帯の中軌道に相対的に位置する位置によってトレンドを判断する.
- 14サイクルRSIを計算し,RSIが30と70のレベルと交差することで,超売りと超買いを判断し,潜在的な反転を識別する.
- 34,89,144,233,377および610周期の単純な移動平均を計算し,均線の多頭並列によってトレンドを確認し,均線は抵抗位としてサポートすることもできます.
- 12,26,9のパラメータに基づいてMACD指標を計算し,MACD柱状図と0軸の交差を介してトレンドの逆転を判断するのに補助します.
- 市場を評価する上で,平仓の論理を練るには,
- ポジション開設:閉盘価格がブリン帯の中央軌道上であり,短期平均線が長期平均線上であるときに多ポジションを開設する.
- 平仓:閉盘価格がブリン帯中軌道から下落したときの平仓の半分,短期平均線が長期平均線から下落したときの全平仓.
戦略的優位性
- ブリン帯は,価格の変動を客観的に量化することができ,トレンド判断の根拠を提供している.
- RSIの導入は,過剰買いと過剰売りを判断し,潜在的なトレンド転換の機会を捉えるのに役立ちます.
- 複数の均線を組み合わせることで,各時間スケールの傾向をより全面的に分析できます.
- MACD指標は,トレンドと逆転の補助判断として,信号の信頼性を高めます.
- ポジション開設の論理にポジション管理の考えが加えられ,トレンドが不確実なときにポジションを段階的に下げてリスクをコントロールする.
戦略リスク
- 震動の状況では,ブリン帯と均線系は,頻繁に矛盾する信号を生成する可能性がある.
- RSIとMACDの指標は,強いトレンドの状況下では,長期にわたって超買い超売り領域に留まり,判断力を失う可能性があります.
- 参数選択 (ブリン帯周期,均線周期など) はある程度主観性があり,異なる参数によって異なる結果をもたらす可能性がある.
- ストップ・ロスの欠如は,単一取引のリスクを高めることにつながります.
- ブラック・スワンなどの極端な状況では,対応が遅れる可能性があり,大きな撤退が起こります.
戦略最適化の方向性
- 各指標のパラメータ,ブリン帯の周期と幅,RSIの周期と値などのより体系的な最適化.
- 交通量の変化などの確認信号の導入により,信号の信頼性が向上します.
- ポジション開設の条件にストップ・ロスト・メカニズムを導入し,単一取引のリスクをよりよくコントロールする.
- ポジション調整メカニズムを導入することを検討し,異なる市場状況に応じてポジションを柔軟に調整し,利益リスク比率を向上させる.
- 極端な状況に対する設計は,VIXインデックスに基づくなどのセーフジングやアルファ因子に対する動的加重などの予測に対応する.
要約する
この戦略は,トレンド判断,オーバーバイオーバーセール判断,多時間尺度分析,ポジション制御など,複数の次元からより完善な取引システムを構築しています.しかし,戦略は,震動的状況や極端な状況に対応する際には,最適化されなければなりません.さらに体系的なパラメータ最適化やリスク管理が欠けている.将来,より精密な信号,ダイナミック権重調整,極端な状況に対応するなど,より精密な信号,ダイナミック権重調整などの面において,改善を続けることができます.この戦略は,継続的な反射最適化と実体テストにより,安定した,持続可能な量化取引戦略に成長する見込みがあります.
ストラテジーソースコード
/*backtest
start: 2023-05-21 00:00:00
end: 2024-05-26 00:00:00
period: 1d
basePeriod: 1h
exchanges: [{"eid":"Binance","currency":"BTC_USDT"}]
*/

//@version=5
strategy("Bollinger Bands + RSI Strategy with MA", overlay=true)

// Bollinger Bands
length = input.int(20, title="BB Length")
mult = input.float(2.0, title="BB Mult")
basis = ta.sma(close, length)
dev = mult * ta.stdev(close, length)
upper_band = basis + dev
lower_band = basis - dev

// RSI
rsi_length = input.int(14, title="RSI Length")
rsi_oversold = input.int(30, title="RSI Oversold", minval=0, maxval=100)
rsi_overbought = input.int(70, title="RSI Overbought", minval=0, maxval=100)
rsi = ta.rsi(close, rsi_length)

// RSI Divergence
rsi_divergence_bottom = ta.crossunder(rsi, rsi_oversold)
rsi_divergence_peak = ta.crossunder(rsi_overbought, rsi)

// Moving Averages
ma34 = ta.sma(close, 34)
ma89 = ta.sma(close, 89)
ma144 = ta.sma(close, 144)
ma233 = ta.sma(close, 233)
ma377 = ta.sma(close, 377)
ma610 = ta.sma(close, 610)

// MACD Calculation
[macd_line, signal_line, _] = ta.macd(close, 12, 26, 9)
macd_histogram = macd_line - signal_line

// MACD Divergence
macd_divergence_bottom = ta.crossunder(macd_histogram, 0)
macd_divergence_peak = ta.crossover(macd_histogram, 0)

// Conditions for Buy and Sell
basis_gt_ma34 = basis > ma34
ma34_gt_ma89 = ma34 > ma89

// Entry condition
buy_condition = basis_gt_ma34 and ma34_gt_ma89
sell_condition =  basis <ma34

// Calculate position size
position_size = 1.0  // 100% capital initially

// Update position size based on conditions
if (sell_condition)
    position_size := 0.5  // Sell half of the position
if (not basis_gt_ma34)
    position_size := 0.0  // Sell all if basis < ma34

// Entry and exit strategy
if (buy_condition)
    strategy.entry("Buy", strategy.long, qty=position_size)
if (sell_condition)
    strategy.close("Buy")

// Plot Bollinger Bands and Moving Averages
bb_fill_color = basis > basis[1] ? color.new(color.blue, 90) : color.new(color.blue, 10)
plot(basis, color=color.blue, title="Basis")
plot(upper_band, color=color.red, title="Upper Band")
plot(lower_band, color=color.green, title="Lower Band")
fill(plot1=plot(upper_band), plot2=plot(lower_band), color=bb_fill_color, title="BB Fill")
plot(ma34, color=color.orange, title="MA34")
plot(ma89, color=color.purple, title="MA89")
plot(ma144, color=color.gray, title="MA144")
plot(ma233, color=color.blue, title="MA233")
plot(ma377, color=color.red, title="MA377")
plot(ma610, color=color.green, title="MA610")

// Plot RSI Divergence
plotshape(series=rsi_divergence_bottom, style=shape.triangleup, location=location.abovebar, color=color.green, size=size.small)
plotshape(series=rsi_divergence_peak, style=shape.triangledown, location=location.belowbar, color=color.red, size=size.small)

// Plot MACD Histogram Divergence
plotshape(series=macd_divergence_bottom, style=shape.triangleup, location=location.belowbar, color=color.green, size=size.small)
plotshape(series=macd_divergence_peak, style=shape.triangledown, location=location.abovebar, color=color.red, size=size.small)