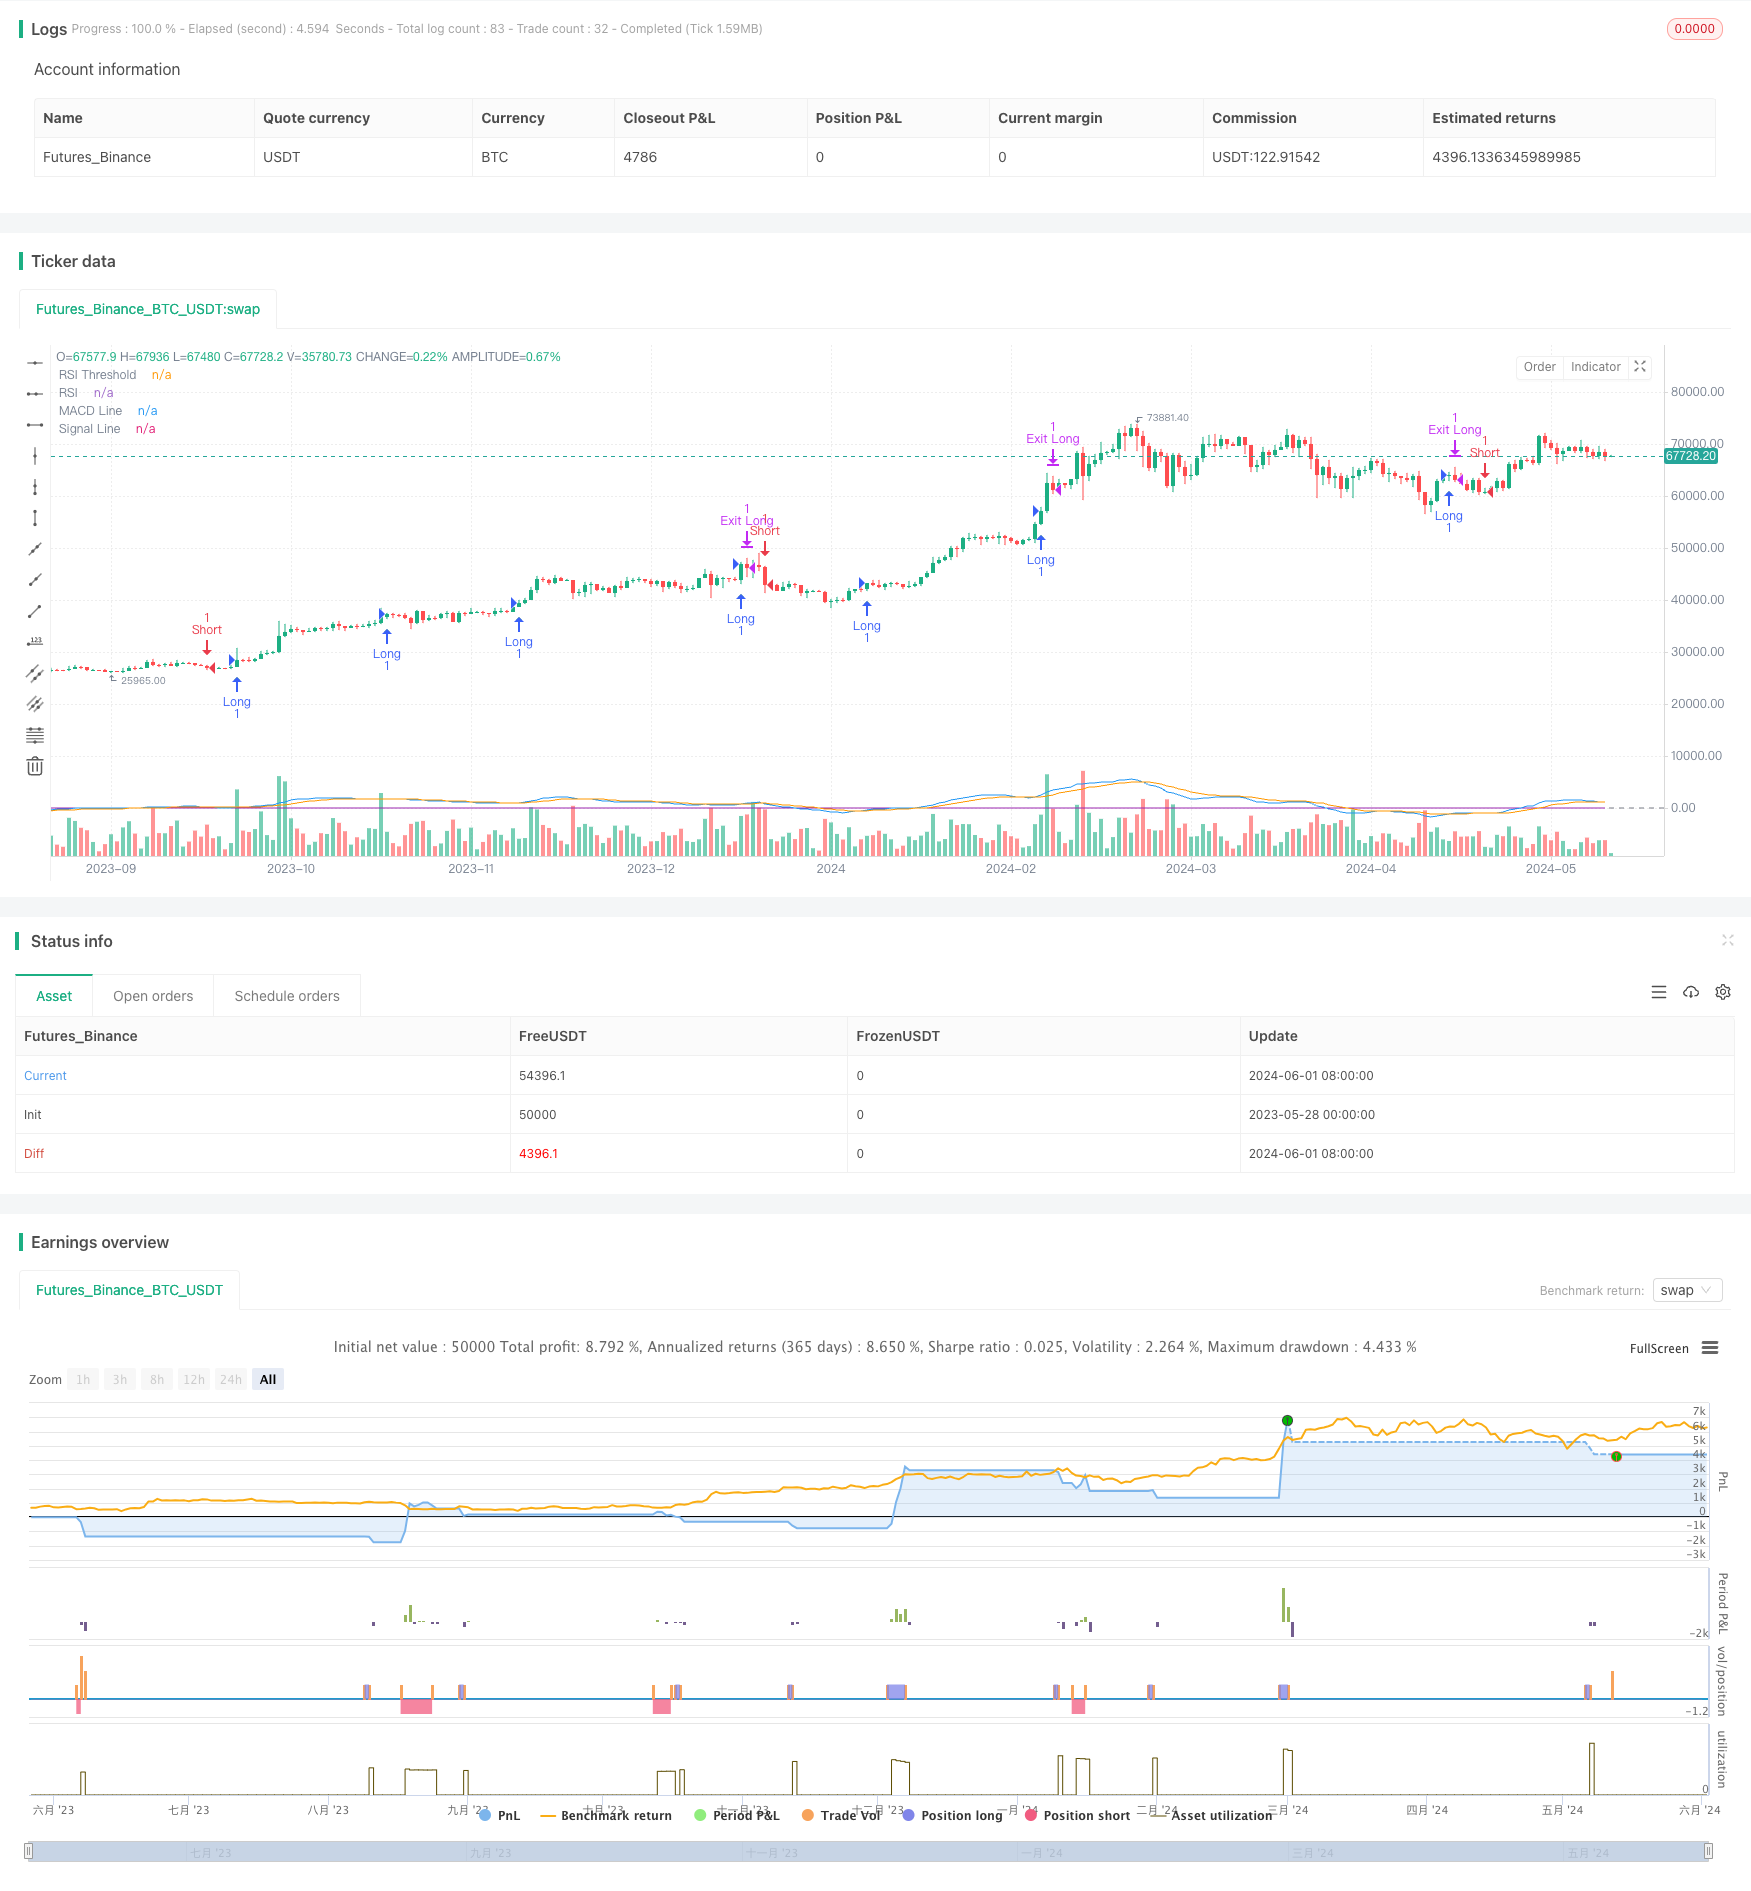
概要
この戦略は,移動平均 ((MA),相対的に強い指数 ((RSI) と平均リアル波幅 ((ATR) などの技術分析ツールと組み合わせて,市場のトレンドの機会を捉えることを目的としています. 戦略は,双平線交差によってトレンドの方向を判断し,RSI指標を使用して取引信号を動量でフィルターし,ATRを損失の基準として使用し,リスクを制御します.
戦略原則
この戦略の核心は,2つの異なる周期の移動平均 (快線と慢線) の交差を用いて市場トレンドを判断することである.快線上を慢線に横切ると,上昇傾向を示し,戦略は多多信号を生成する.逆に,快線下を慢線に横切ると,下降傾向を示し,戦略は多空信号を生成する.
取引信号の信頼性を高めるために,戦略は,動力のフィルターとしてRSI指標を導入した. RSIが特定の値 (例えば50) よりも高いときだけ,多ポジションを開くことが許可され,RSIがその値より低いときだけ,空いているポジションを開くことが許可される.
さらに,戦略はATRをストップベースとして採用し,近年の価格の変動幅に応じてストップポイントを動的に調整し,異なる市場状態に適応する.この自己適応のストップ方式は,トレンドが不明なときに迅速にストップし,撤回を制御し,トレンドが強くなるとより大きな利益の余地を与え,戦略の利益を向上させる.
戦略的優位性
- トレンドフォロー: 市場トレンドを2つの均線交差で捉え,市場の主な方向に順応して戦略の勝利率を向上させる.
- 動量フィルタリング:RSI指標を使用して取引シグナルを二次確認し,動力が不足しているときに盲目に入場を避けるため,単一の取引の質を向上させる.
- 適応ストップ:ATRの動的調整によるストップポイントにより,異なる市場状態でリスクの自主適応を実現し,引き下げを軽減し,資金利用効率を向上させることができる.
- シンプルで使いやすい:戦略の論理が明確で,パラメータが少なく,理解し,実行しやすく,ほとんどの投資家が使うのに適している.
戦略リスク
- 変動する市場リスク: 変動が繰り返され,トレンドが不明であるとき,頻繁に交差することは,戦略がより多くの取引シグナルを生み出し,頻繁な取引と資金の急速な損失を引き起こす可能性があります.
- パラメータリスク:戦略のパフォーマンスはパラメータ設定に敏感であり,異なるパラメータは全く異なる結果をもたらす可能性があります.パラメータが正しく選択されていない場合,戦略が失効する可能性があります.
- トレンド突破リスク:市場が急激に変化し,急激にトレンドが逆転すると,戦略は止損に遅れ,大きな損失を被る可能性があります.
- 総合リスク:この戦略は,動量フィルタが加えられているが,全体的にトレンド戦略であり,市場が長期にわたる揺れやトレンドが明確でない場合,システムリスクに直面する可能性がある.
戦略最適化の方向性
- トレンド強度識別: トレンド判断の基礎に,トレンド強度指標 (ADXなど) をさらに導入して,弱いトレンドの下での頻繁な取引を避け,トレンド把握の精度を向上させることができます.
- 多空動量区分:既存の策略は多空信号に対して同じ動量フィルタリングを採用し,多頭と空頭に対して別々のRSI値を設定することを検討し,多空傾向の不対称性をよりよく適応させる.
- 止損最適化:ATR止損の基礎で,他の止損方法 (比率止損,サポート/レジスタンス位止損など) と組み合わせて,多元的な止損システムを構築し,リスクをさらに制御する.
- パラメータ自在化: パラメータ最適化または自在化アルゴリズムを導入することを検討し,市場の状況の変化に応じて戦略のパラメータを自動的に調整し,戦略の適応性と安定性を向上させる.
要約する
この戦略は,トレンドフォローと動量フィルターの有機的な組み合わせにより,市場におけるトレンド性機会を捉えると同時に,リスクをより良くコントロールする.戦略の論理は明確で,実行しやすく,最適化できる.しかし,実用的な応用では,依然として,波動的な市場リスクとパラメータリスクに注意し,市場特性と独自のニーズに応じて,柔軟に調整し,最適化する戦略が必要である.全体的に,これはトレンド把握とリスク管理の両方を兼ね備えたバランスの取れた戦略であり,さらなる探索と実践に値する.
/*backtest
start: 2023-05-28 00:00:00
end: 2024-06-02 00:00:00
period: 1d
basePeriod: 1h
exchanges: [{"eid":"Futures_Binance","currency":"BTC_USDT"}]
*/

//@version=5
strategy("Trend-Following Strategy with MACD and RSI Filter", overlay=true)

// Input variables
fastLength = input(12, title="Fast MA Length")
slowLength = input(26, title="Slow MA Length")
signalLength = input(9, title="Signal Line Length")
stopLossPct = input(1.0, title="Stop Loss %") / 100
rsiLength = input(14, title="RSI Length")
rsiThreshold = input(50, title="RSI Threshold")

// Moving averages
fastMA = ta.sma(close, fastLength)
slowMA = ta.sma(close, slowLength)

// MACD
[macdLine, signalLine, _] = ta.macd(close, fastLength, slowLength, signalLength)

// RSI
rsi = ta.rsi(close, rsiLength)

// Entry conditions with RSI filter
bullishSignal = ta.crossover(macdLine, signalLine) and rsi > rsiThreshold
bearishSignal = ta.crossunder(macdLine, signalLine) and rsi < rsiThreshold

// Calculate stop loss levels
longStopLoss = ta.highest(close, 10)[1] * (1 - stopLossPct)
shortStopLoss = ta.lowest(close, 10)[1] * (1 + stopLossPct)

// Execute trades
strategy.entry("Long", strategy.long, when=bullishSignal)
strategy.entry("Short", strategy.short, when=bearishSignal)
strategy.exit("Exit Long", "Long", stop=longStopLoss)
strategy.exit("Exit Short", "Short", stop=shortStopLoss)

// Plotting signals
plotshape(bullishSignal, style=shape.triangleup, location=location.belowbar, color=color.green, size=size.small, title="Bullish Signal")
plotshape(bearishSignal, style=shape.triangledown, location=location.abovebar, color=color.red, size=size.small, title="Bearish Signal")

// Plot MACD
plot(macdLine, color=color.blue, title="MACD Line")
plot(signalLine, color=color.orange, title="Signal Line")

// Plot RSI
hline(rsiThreshold, "RSI Threshold", color=color.gray)
plot(rsi, color=color.purple, title="RSI")