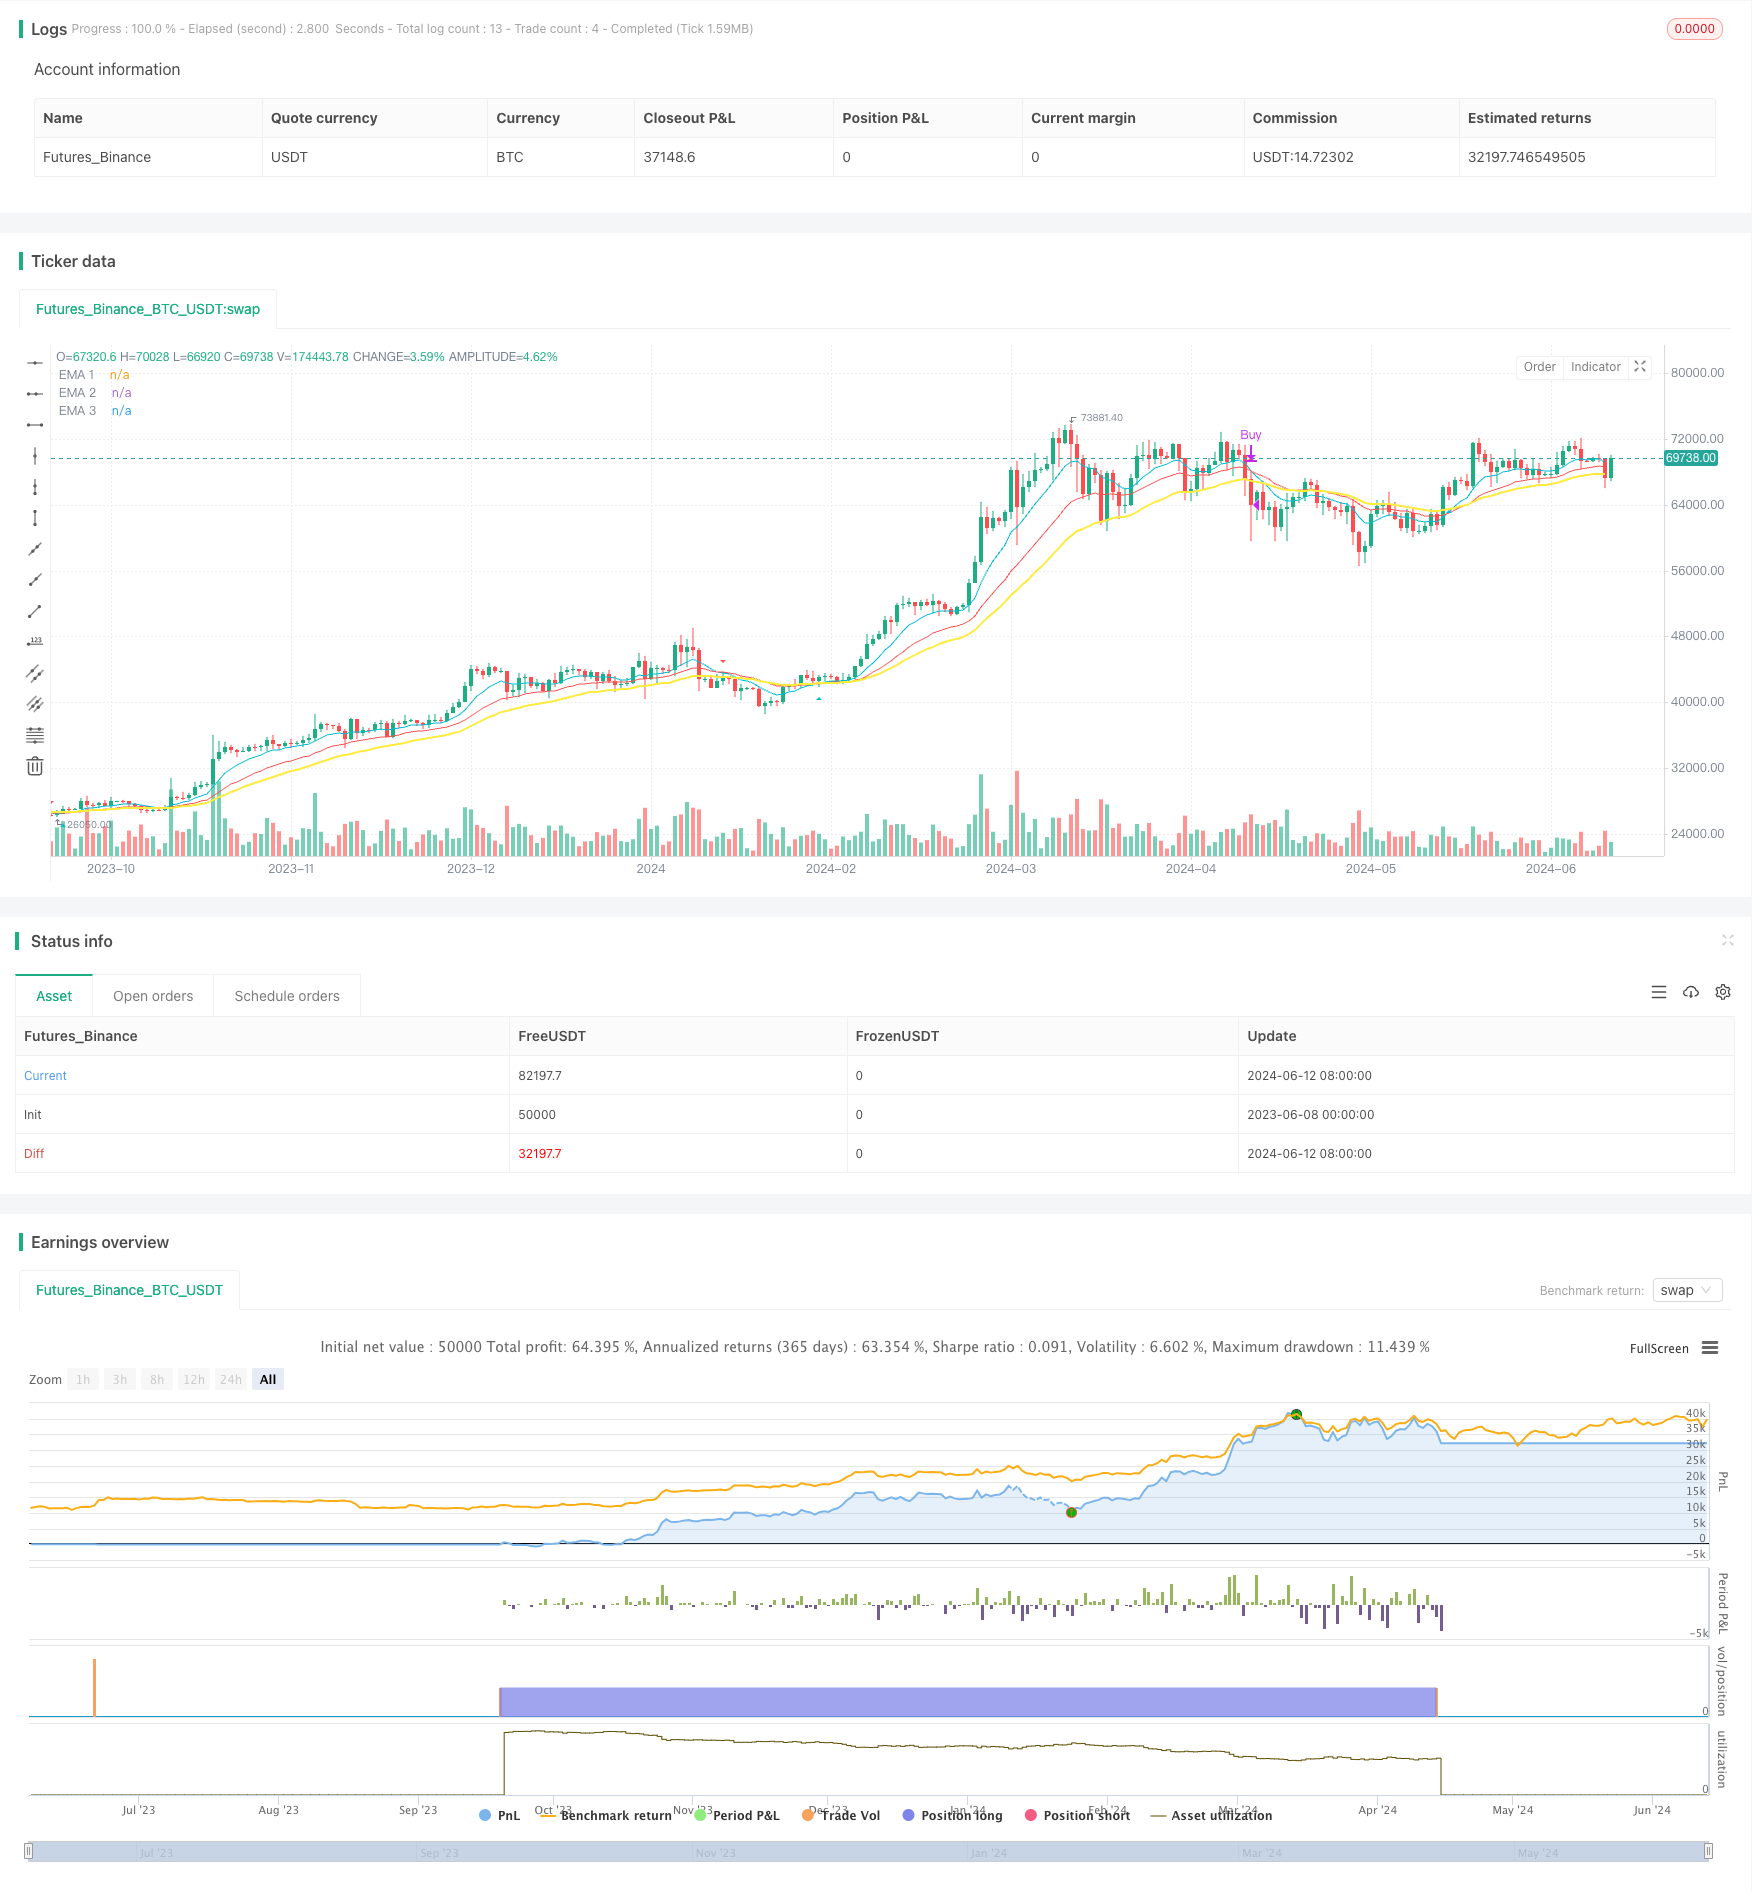
EMA RSI MACD ダイナミック・テイク・プロフィート・ストップ・ロスト・トレード・戦略
作者: リン・ハーンチャオチャン,日付: 2024-06-14 15:38:17タグ:エイマRSIマックド

概要
この取引戦略は,指数移動平均 (EMA),相対強度指数 (RSI),移動平均収束分差 (MACD) の3つの技術指標を組み合わせています.価格が特定の条件を満たすときに,そのクロスオーバーと価値関係を分析することによって,買取・売却信号を生成します.また,戦略は,ダイナミックな取利益とストップ損失を組み込み,取引リスクを管理します.
戦略原則
- 高値,低値,閉値 (HLCC4) の平均を戦略のベースデータとして計算する.
- HLCC4に基づいて,異なる期間の3つの EMAとRSIを計算します.
- MACDヒストグラムの値を計算する.
- EMA1とEMA2の交差条件を決定する.
- EMA1が EMA2を横切ると,上昇信号が生成されます.
- EMA1が EMA2を下回ると,下落シグナルが発信されます.
- EMA,RSI,MACD指標の値を徹底的に検討し,購入または販売条件が満たされているかどうかを判断します.
- 購入条件: EMA1が EMA2を横切る,HLCC4が EMA3を上回る,RSIが
値を超えている,閉値が開値より高く,MACDヒストグラムが正である. - 販売条件: EMA1が EMA2を下回り,HLCC4が EMA3を下回り,RSIが
値を下回り,閉値が開値を下回り,MACDヒストグラムがマイナスである.
- 購入条件: EMA1が EMA2を横切る,HLCC4が EMA3を上回る,RSIが
- ポジションを保持している間に反対の信号が表示される場合は,新しいポジションを開く前に現在のポジションを閉じる.
- 購入または販売する際には,指定されたピップ数に基づいて,利益とストップ損失の価格を設定します.
戦略 の 利点
- 総合的な判断のために複数の技術指標を組み合わせ,信号の信頼性を向上させる.
- リスクを効果的にコントロールするための ダイナミックな利益とストップ・ロスのメカニズムを導入します
- 逆の信号が表示されたとき,新しい位置を開く前に現在のポジションを閉じ,重複ポジションの問題を回避します.
- 調整可能なパラメータ,強い適応性があり,異なる市場環境に応じて最適化することができます.
戦略リスク
- 横向市場では,頻繁なクロスオーバーが過剰な取引につながり,取引コストが上昇する可能性があります.
- 固定・ピップ・テイク・プロフィートとストップ・ロスは,市場の変動に適応できず,早期のストップ・ロスまたは遅延したテイク・プロフィートにつながる可能性があります.
- 戦略は過去のデータに基づいているため,突然の出来事や異常な市場状況に及ばないかもしれない.
戦略の最適化方向
- 信号の正確性を向上させるために,ボリンジャー帯やATRなどのより多くの技術指標や市場情勢指標を導入することを検討する.
- 利益とストップ損失の取扱には,ストップ損失を遅らせたり,波動性に基づいて利益とストップ損失距離を調整したりなど,よりダイナミックなアプローチを採用する.
- 主要なニュースイベントや経済データリリースなどの基本的な分析を組み合わせて,取引信号をフィルタリングし,特別な期間中に取引を避ける.
- パラメータ設定については,最適なパラメータ組み合わせを見つけるために機械学習または最適化アルゴリズムを使用します.
概要
この戦略は,EMA,RSI,MACDなどの複数の技術指標を組み合わせて完全な取引システムを形成する.トレンド市場では,動的利益とストップ損失を通じてトレンドとリスクを効果的に把握し,制御することができる.しかし,横向市場では,頻繁な取引が収益性に影響を与える可能性があります.将来,戦略は,信号最適化,リスク制御最適化,パラメータ最適化という点で精製され,安定性と収益性を向上させることができます.
/*backtest
start: 2023-06-08 00:00:00
end: 2024-06-13 00:00:00
period: 1d
basePeriod: 1h
exchanges: [{"eid":"Futures_Binance","currency":"BTC_USDT"}]
*/

//@version=5
strategy("[BUY/SELL]EMA RSI MACD with TP and SL", overlay=true)

// Input parameters
ema1Length = input.int(9, title="EMA 1 Length")
ema2Length = input.int(21, title="EMA 2 Length")
ema3Length = input.int(34, title="EMA 3 Length")
rsiLength = input.int(14, title="RSI Length")
rsiThreshold = input.int(50, title="RSI Threshold")
macdFastLength = input.int(12, title="MACD Fast Length")
macdSlowLength = input.int(26, title="MACD Slow Length")
macdSignalSmoothing = input.int(9, title="MACD Signal Smoothing")
tpPips = input.int(10, title="Take Profit (pips)")
slPips = input.int(10, title="Stop Loss (pips)")

// HLCC4 calculation
hlcc4_custom = (high + low + close + close) / 4

// Calculate EMA and RSI based on HLCC4
ema1 = ta.ema(hlcc4_custom, ema1Length)
ema2 = ta.ema(hlcc4_custom, ema2Length)
ema3 = ta.ema(hlcc4_custom, ema3Length)
rsi = ta.rsi(hlcc4_custom, rsiLength)

// Calculate MACD Histogram
[a, b, histogram] = ta.macd(hlcc4_custom, macdFastLength, macdSlowLength, macdSignalSmoothing)

// EMA1 and EMA2 crossover conditions
emaCrossUp = ta.crossover(ema1, ema2)
emaCrossDown = ta.crossunder(ema1, ema2)

// BUY signal conditions
buySignal = emaCrossUp and hlcc4_custom > ema3 and rsi > rsiThreshold and close > open and histogram > 0

// SELL signal conditions
sellSignal = emaCrossDown and hlcc4_custom < ema3 and rsi < rsiThreshold and close < open and histogram < 0

var float entryPrice = na
var float tpPrice = na
var float slPrice = na

// Check if there is an open position and a contrary signal appears, then close all old orders first
if strategy.opentrades > 0
    if sellSignal and strategy.position_size > 0
        strategy.close("Buy", comment="Close Buy Order")
    if buySignal and strategy.position_size < 0
        strategy.close("Sell", comment="Close Sell Order")

// Place a BUY order when there is a BUY signal and set TP and SL based on pips
if buySignal and strategy.position_size == 0
    entryPrice := close
    tpPrice := entryPrice + tpPips * syminfo.mintick
    slPrice := entryPrice - slPips * syminfo.mintick
    strategy.entry("Buy", strategy.long)
    strategy.exit("Take Profit/Stop Loss", "Buy", limit=tpPrice, stop=slPrice)

// Place a SELL order when there is a SELL signal and set TP and SL based on pips
if sellSignal and strategy.position_size == 0
    entryPrice := close
    tpPrice := entryPrice - tpPips * syminfo.mintick
    slPrice := entryPrice + slPips * syminfo.mintick
    strategy.entry("Sell", strategy.short)
    strategy.exit("Take Profit/Stop Loss", "Sell", limit=tpPrice, stop=slPrice)

// Plot the crossover points of EMA1 and EMA2
plotshape(series=emaCrossUp, location=location.belowbar, color=color.aqua, style=shape.triangleup, title="EMA Cross Up", size=size.small)
plotshape(series=emaCrossDown, location=location.abovebar, color=color.red, style=shape.triangledown, title="EMA Cross Down", size=size.small)

// Plot the EMA lines on the chart
plot(ema1, title="EMA 1", color=color.aqua)
plot(ema2, title="EMA 2", color=color.red)
plot(ema3, title="EMA 3", color=color.yellow, linewidth=2)
関連性
- 多指標高周波取引戦略: 指数関数移動平均値と動向指標を組み合わせた短期取引システム
- BONK 多要素取引戦略
- EMA,MACD,およびRSIのトリプルインジケーターモメンタム戦略
- EMA ダイナミックストップ・ロスの取引戦略
- 多レベルバランスのとれた量的な取引戦略
- EMAクロスオーバーとRSIフィルターによる二重トレンド戦略
- 先進的なMACD動的トレンド量的な取引戦略
- 多指標性高レバレッジの短期取引戦略
- EMA/MACD/RSIのクロスオーバー戦略
- 多指標総合的なモメンタム・トレーディング戦略
もっと
- RSIの低点逆転戦略
- フィッシャー・トランスフォーム ダイナミック・スリージングル トレンド 戦略をフォローする
- 平均逆転戦略
- EMA100とNUPL 相対的未実現利益量的な取引戦略
- ストカスティックオシレーターに基づく波動範囲取引戦略
- シンプルな組み合わせ戦略:ピボットポイント スーパートレンドとDEMA
- EMAのトレンドフィルター戦略
- 移動平均のクロスオーバー戦略
- 3分間のキャンドル・ハイ・ロー・ポイントに基づいた日中のブレイクアウト戦略
- 移動平均値,サポート/レジスタンス,およびボリュームに基づいたアドバンストエントリー戦略
- G-Trend EMA ATR インテリジェント・トレーディング・ストラテジー
- トレンドフォロー戦略 200日移動平均値とストカスティックオシレーターに基づく
- RSI トレンド戦略
- EMAのクロスオーバー・モメンタム・スカルピング戦略
- BBの脱出戦略
- VWAP と RSI ダイナミック・ボリンガー・バンドは,利益とストップ・ロスの戦略をとる
- チェンデ・クロール ストップ ダイナミックATRトレンド 戦略をフォローする
- この戦略はチャイキンマネーフロー (CMF) をベースに取引信号を生成します
- トレンドフィルタピンのバー逆転戦略
- サポート・レジスタンスレベルでの逆転パターンに基づく定量的な取引戦略