1
フォロー
1625
フォロワー

概要
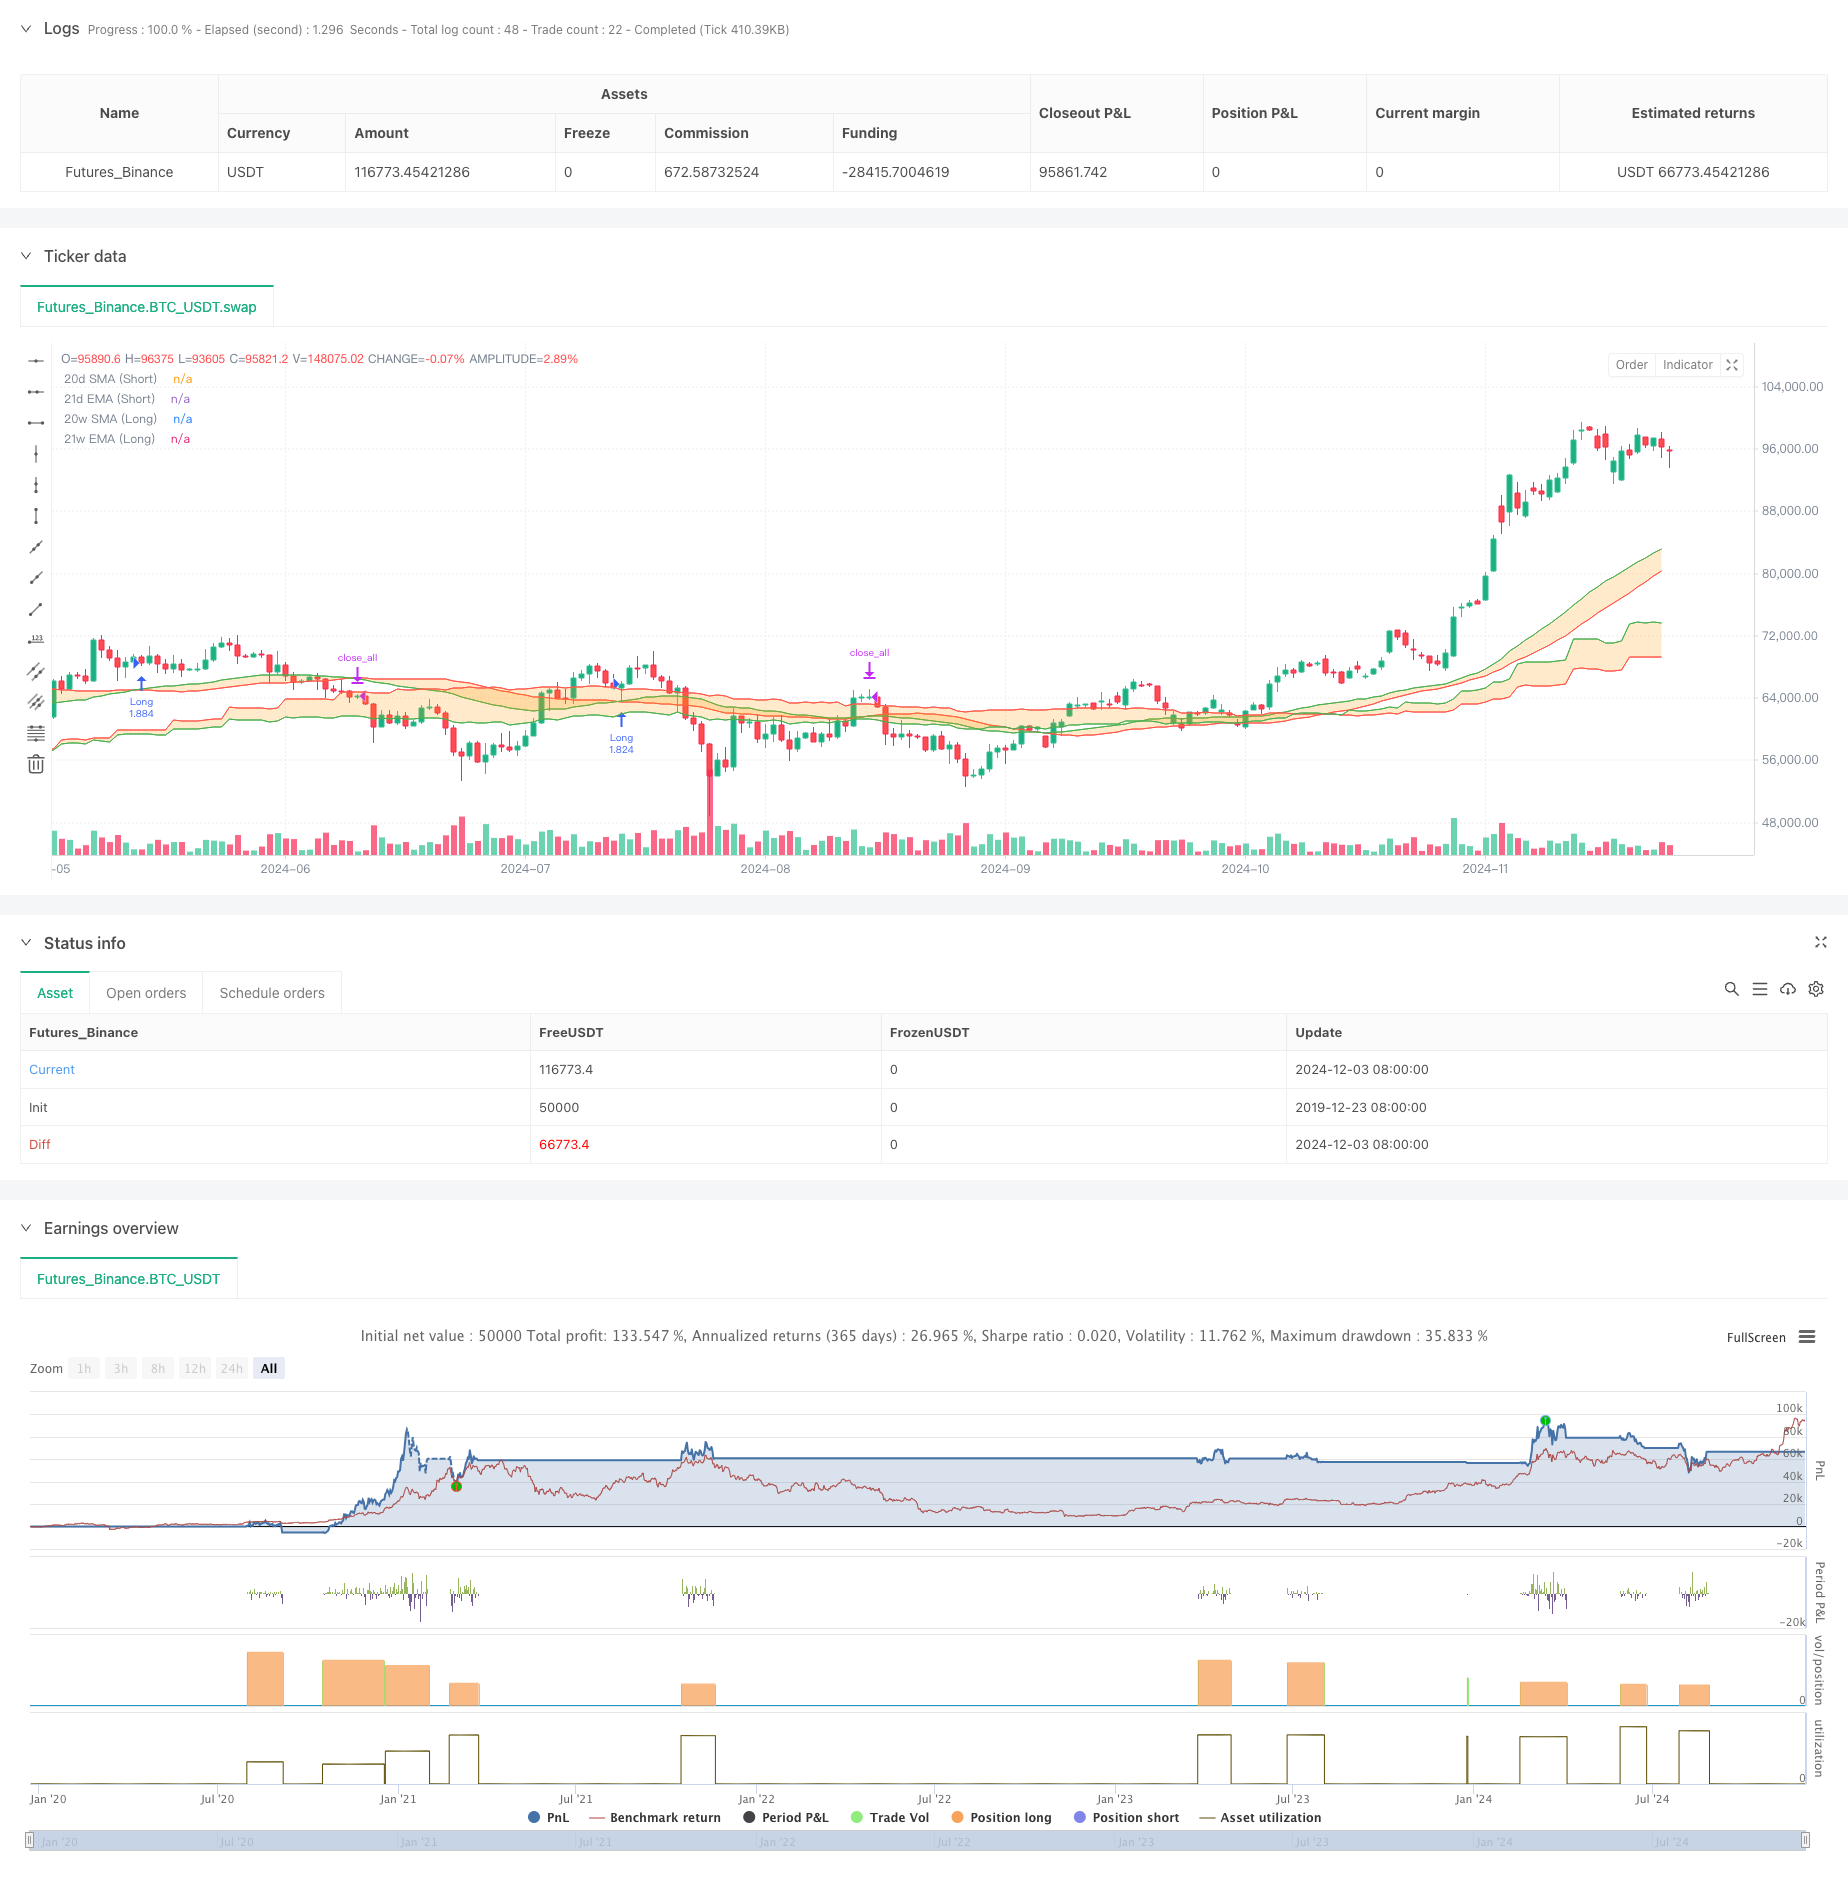
この戦略は,二重時間枠に基づくダイナミック・サポート・ポジション取引システムで,周線と日線時間枠でSMAとEMA均線を組み合わせた交差シグナルで取引を行う.システムは均線間の形成されたサポートを利用して,市場動向と取引機会を識別し,二つの異なる時間周期のシグナル確認によって取引の正確性を向上させる.戦略は,パーセントポジション管理の方法を採用し,取引コストとスライド要因を考慮する.
戦略原則
戦略の核心となる原理は,二つの時間周期における均線の交差と位置の関係を監視することによって取引信号を決定することである.
- 長周期 (周線) は20週間のSMAと21週間のEMAを使用し,短周期 (日線) は50日SMAと51日EMAを使用する
- 長期周期では,EMAがSMAを上方に通過すると多行シグナルが作られ,下方に通過すると平行シグナルが作られる.
- 短周期では,短周期EMAが長周期EMAの上にあり,EMAがSMAを向上して横切るときに多信号が生成される.
- 短周期の空白信号または長周期の均線交差が下向きに発生すると,システムはすべての多項を平らにする.
- 戦略は,指定された時間帯で動作し,自閉閉範囲を超えています.
戦略的優位性
- 複数の確認メカニズム:偽信号の影響を減らすために,2つの時間周期の信号確認
- ダイナミック・サポート・バンド:均等線の間のサポート・バンドは,市場の変化にダイナミックに適応する
- リスク管理の改善:取引コストと滑り点を考慮し,パーセンテージポジション管理を使用
- 適応力:市場波動に合わせて自律的に位置を調整する
- 操作規則が明確:入場・出場条件が明確で,実行・反省が容易である
戦略リスク
- 振動市場のリスク:横盤振動市場では頻繁に偽信号が生じる可能性がある
- 遅滞のリスク:平均線指数は,それ自体には遅滞があり,最良の入場点を逃す可能性があります.
- 参数感性:平均線周期の選択は,戦略のパフォーマンスに大きな影響を与える
- 市場環境依存性: 戦略はトレンド市場ではうまく機能するが,激しい波動の市場ではうまく機能しない可能性がある
- 資金管理のリスク: 固定パーセントポジションは,特定の市場状況下では過度のリスクになる可能性がある
戦略最適化の方向性
- 波動率指標の導入:ポジションサイズを動的に調整するためにATRなどの波動率指標の追加を検討する
- 最適化パラメータ選択:異なる時間周期の平均線パラメータを回測することでシステムのパフォーマンスを最適化できる
- 市場環境のフィルタリングを増やす:不適切な市場環境をフィルタリングするためのトレンド強度指標を追加する
- リスク管理の強化: 移動式または固定式のストップを追加することを検討する
- ポジション管理の最適化:シグナル強さや市場の変動に応じてポジションのサイズを動的に調整できる
要約する
この戦略は,異なる時間周期の均線交差信号を組み合わせて,比較的安定した取引システムを構築する.市場動向を支柱帯の概念によって認識し,複数の確認機構を使用して取引の正確性を向上させる.戦略の設計には,取引コスト,滑り点,時間管理など,実際の取引における様々な要因が考慮される.いくつかの固有のリスクがあるものの,提供された最適化方向によって,戦略の安定性と収益性をさらに向上させることができる.
ストラテジーソースコード
/*backtest
start: 2019-12-23 08:00:00
end: 2024-12-04 00:00:00
period: 1d
basePeriod: 1d
exchanges: [{"eid":"Futures_Binance","currency":"BTC_USDT"}]
*/

//@version=5
strategy("Demo GPT - Bull Market Support Band", overlay=true, default_qty_type=strategy.percent_of_equity, default_qty_value=100, commission_value=0.1, slippage=3)

start_date = input(timestamp("2018-01-01 00:00 +0000"), title="Start Date")
end_date = input(timestamp("2069-12-31 00:00 +0000"), title="End Date")

lsmaLength = input.int(20, title="Long SMA Length", minval=1)
lemaLength = input.int(21, title="Long EMA Length", minval=1)
customLongTimeframe = input.timeframe("W", title="Long Timeframe")  // Khung thời gian dài
ssmaLength = input.int(50, title="Short SMA Length", minval=1)
semaLength = input.int(51, title="Short EMA Length", minval=1)
customShortTimeframe = input.timeframe("D", title="Short Timeframe")  // Khung thời gian ngắn

source = close

// Tính toán SMA và EMA cho khung thời gian dài
smaLong = ta.sma(source, lsmaLength)
emaLong = ta.ema(source, lemaLength)
outSmaLong = request.security(syminfo.tickerid, customLongTimeframe, smaLong)
outEmaLong = request.security(syminfo.tickerid, customLongTimeframe, emaLong)

// Tính toán SMA và EMA cho khung thời gian ngắn
smaShort = ta.sma(source, ssmaLength)
emaShort = ta.ema(source, semaLength)
outSmaShort = request.security(syminfo.tickerid, customShortTimeframe, smaShort)
outEmaShort = request.security(syminfo.tickerid, customShortTimeframe, emaShort)

// Plot các chỉ báo trên biểu đồ
smaPlotLong = plot(outSmaLong, color=color.new(color.red, 0), title='20w SMA (Long)')
emaPlotLong = plot(outEmaLong, color=color.new(color.green, 0), title='21w EMA (Long)')
smaPlotShort = plot(outSmaShort, color=color.new(color.red, 0), title='20d SMA (Short)')
emaPlotShort = plot(outEmaShort, color=color.new(color.green, 0), title='21d EMA (Short)')

// Fill vùng giữa các đường SMA và EMA
fill(smaPlotLong, emaPlotLong, color=color.new(color.orange, 75), fillgaps=true)
fill(smaPlotShort, emaPlotShort, color=color.new(color.orange, 75), fillgaps=true)

// Điều kiện long và short cho khung thời gian dài
longConditionLong = ta.crossover(outEmaLong, outSmaLong)
shortConditionLong = ta.crossunder(outEmaLong, outSmaLong)

// Điều kiện long và short cho khung thời gian ngắn
longConditionShort = ta.crossover(outEmaShort, outSmaShort) and (outEmaShort > outEmaLong)
shortConditionShort = ta.crossunder(outEmaShort, outSmaShort) and (outEmaShort > outEmaLong) // Điều kiện short khi EMA ngắn hạn cắt xuống dưới SMA ngắn hạn và EMA ngắn hạn cao hơn EMA dài hạn

// Kiểm tra điều kiện trong khoảng thời gian được chỉ định
inDateRange = true

// Nếu khung ngắn hạn xuất hiện tín hiệu short, ưu tiên đóng tất cả các lệnh Long
if shortConditionShort and inDateRange
    strategy.close_all()

// Nếu khung dài có tín hiệu short, đóng tất cả các lệnh Long
if shortConditionLong and inDateRange
    strategy.close_all()

// Nếu khung ngắn hạn có tín hiệu long và không có tín hiệu short từ khung dài, vào lệnh Long
if longConditionShort and not shortConditionLong and not shortConditionShort and inDateRange
    strategy.entry("Long", strategy.long)

// Đóng tất cả các lệnh khi không trong khoảng thời gian được chọn
if not inDateRange
    strategy.close_all()